

Abstract
Background
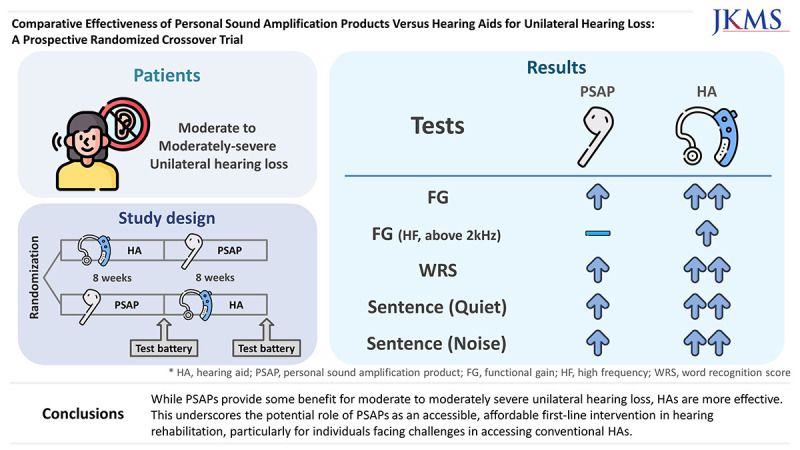
This study compared hearing outcomes with use of personal sound amplification products (PSAPs) and hearing aids (HAs) in patients with moderate to moderately severe unilateral hearing loss.
Methods
Thirty-nine participants were prospectively enrolled, and randomly assigned to use either one HA (basic or premium type) or one PSAP (basic or high-end type) for the first 8 weeks and then the other device for the following 8 weeks. Participants underwent a battery of examinations at three visits, including sound-field audiometry, word recognition score (WRS), speech perception in quiet and in noise, real-ear measurement, and self-report questionnaires.
Results
Functional gain was significantly higher with HAs across all frequencies (P < 0.001). While both PSAPs and HAs improved WRS from the unaided condition, HAs were superior to PSAPs. The speech recognition threshold in quiet conditions and signal-to-noise ratio in noisy conditions were significantly lower in the HA-aided condition than in the PSAP-aided condition, and in the PSAP-aided condition than in the unaided condition. Subjective satisfaction also favored HAs than PSAPs in questionnaires, Abbreviated Profile of Hearing Aid Benefit, International Outcome Inventory for Hearing Aids, and Host Institutional Questionnaire.
Conclusion
While PSAPs provide some benefit for moderate to moderately severe unilateral hearing loss, HAs are more effective. This underscores the potential role of PSAPs as an accessible, affordable first-line intervention in hearing rehabilitation, particularly for individuals facing challenges in accessing conventional HAs.
Keywords: Hearing Aids, Personal Sound Amplification Products, Unilateral Hearing Loss
Graphical Abstract
INTRODUCTION
Hearing loss is a significant global disability, affecting approximately 466 million individuals, or about 6.12% of the world’s population.1 This prevalence is predicted to rise significantly due to demographic changes, such as population growth and aging.2 Hearing loss is not only associated with various diseases but also leads to depression, social isolation, and loss of productivity, imposing an estimated annual cost of over 750 billion dollars.1,3 Consequently, effective hearing rehabilitation has become increasingly essential. Hearing aids (HAs) are the primary clinical management intervention for sensorineural hearing loss, including conditions like presbycusis.4 Numerous studies have highlighted the benefits of HAs, such as improvements in mental health, cognitive function, and reductions in feelings of loneliness.5,6,7,8,9,10
Despite their effectiveness, global HA coverage is as low as 10–11%.11 Barriers to HA usage include high costs, social stigma, limited financial resources, and restricted access to hearing healthcare services.12,13,14 To address these challenges, Personal Sound Amplification Products (PSAPs) have been developed. PSAPs are over-the-counter devices designed for sound amplification in certain environments, targeting non-hearing-impaired users. While not intended to replace HAs, and generally less effective in speech recognition and listening effort,15,16 PSAPs offer advantages like cost-effectiveness and no requirement for professional consultation or fitting. Research indicates that PSAPs can be beneficial for individuals with mild to moderate sensorineural hearing loss, yet their effectiveness varies greatly among users and typically does not reach the consistent performance level of professionally fitted Has.17,18,19,20,21,22
Unilateral hearing loss (UHL) presents a unique challenge; it is a condition where hearing is normal in one ear but impaired in the other. This impairment creates difficulties in sound localization, word recognition, and speech perception in noisy settings,23,24 affecting both children and adults.25,26 Although treatments like cochlear implantation and contralateral-routing-of-sound HAs have been explored for ‘single-sided deafness,’ research on auditory rehabilitation for UHL with remaining hearing ability is limited. A U.S. report indicated that while the total prevalence of UHL is about 7.2%, only 1.5% have moderate to severe UHL.27 Notably, in the mild UHL group, nearly two-thirds report perceiving their hearing as excellent or good, yet over two-thirds with moderate or worse UHL experience significant hearing difficulties, with only a small proportion (4.2%) using HAs.
This study aims to fill a critical gap in existing research by investigating the utility of PSAPs for UHL, focusing on those with moderate to moderately severe UHL who, despite experiencing hearing discomfort, are likely to benefit from auditory assistance. Employing a prospective randomized crossover design, we aim to provide a comprehensive evaluation of the effectiveness of auditory rehabilitation using both PSAPs and HAs in this specific group.
METHODS
Participants
From November 19, 2020 to June 20, 2022, 39 adults with moderate to moderately severe UHL were prospectively enrolled. The inclusion criteria were individuals aged 15 years and older, and a weighted four-frequency average ([500 Hz +1,000 Hz × 2 + 2000 Hz × 2 + 4,000 Hz]/6) of pure-tone audiometry. This necessitated that the average hearing threshold in the better ear be less than 25 dB, while the average hearing threshold in the worse ear needed to fall between 41 and 70 dB. All participants presented with acquired sensorineural hearing loss. Participants with previous experience using hearing assistive devices such as HAs or PSAPs, difficulties in cooperating with tests due to communication problems, lesions of the auditory tract or diseases of the central nervous system, or cases with clinical trial-related secondary gains were excluded. After obtaining approval, eligible participants were identified through consultations with individuals attending the Otolaryngology outpatient clinic. Inclusion criteria were carefully applied, and potential subjects were informed about the research objectives and procedures. Subsequently, written informed consent was obtained from those who met the inclusion criteria, following their consultation at the outpatient clinic. All participants tested at the Chungnam National University Hospital Hearing Research Laboratory. The information of all patients was collected and managed using the Korea National Institute of Health web-based system (Internet-based Clinical Research and Trial Management system; iCreaT, https://icreat2.nih.go.kr) (registration number: C200013).
Study design
This study was a prospective randomized crossover trial. In all, 39 participants were randomly assigned to use either HA for the first 8 weeks and then PSAP for the following 8 weeks or to use the two hearing devices in the reverse order. Participants were randomly assigned to use either basic or premium HAs and basic or high-end PSAPs and used the devices exclusively on their poorer hearing ear for amplification. Sequentially numbered, opaque and sealed envelopes containing the allocations were utilized for randomization. Randomization was conducted based on a table prepared by the Department of Preventive Medicine at Seoul National University College of Medicine. Participants underwent a battery of examinations during their first visit, after 8 weeks, and after 16 weeks, for a total of three visits.
EVOKE 220 (Widex, Allerød, Denmark, $3,700/single) was chosen as the basic HA, and EVOKE 330 (Widex, $5,000/single) was used as the premium HA. The basic HA had 10 channels, whereas the premium HA featured 12 channels and included an additional function, a speech enhancer. Both HAs shared special functions such as noise reduction, feedback cancellation, and a personal audibility extender. EM-C110 (BeethoSoL, Chuncheon, Korea, $210/pair) and SmartEar (Olive, Carson City, NV, USA, $253/single) were chosen as the basic and high-end type PSAP, respectively. The basic PSAP has 5 channels, while the high-end PSAP has 16 channels. Both PSAPs were equipped with special functions including noise reduction, feedback cancellation, and self-fitting capabilities. In the study, only basic amplification functions were activated; special functions such as noise canceling and speech enhancement were not enabled.
The HAs were fitted using the Widex-exclusive COMPASS GPS software. Initial settings were automatically generated by entering the participant’s audiometric data into the COMPASS GPS program. This utilized the Widex Fitting Rationale (WFR), which optimizes gain, compression, and feature settings based on the individual's hearing loss profile. Due to the brief duration of this study, no additional detailed personal fittings were conducted after the initial fitting. Unlike HAs, PSAPs do not have dedicated fitting software and are generally adjusted manually. The fitting process involved adjusting the volume up or down according to the participant’s comfort and auditory clarity. This adjustment was made during a session in a soundproof room and in field conditions, where participants identified and confirmed their preferred settings. Following the adjustment, a hearing test was conducted to assess the efficacy of the set volume levels.
Outcome measures
Participants’ hearing was evaluated via audiometry, speech perception, real-ear measurement (REM), and self-report questionnaires, which were administered at three visits. The results measured during the first visit were utilized as baseline data for the study. The outcomes from the second and third visits were used to assess the effectiveness of the devices used over the preceding 8-week periods.
Audiometry
Pure-tone thresholds and word recognition scores (WRSs) were measured under unaided and aided conditions.28 Audiometry was conducted in the sound field, with masking applied to the contralateral better ear. A Madsen Orbiter 922 audiometer (Madsen Electronics, Taastrup, Denmark) and TDH-39P headphones (Telephonics, Farmingdale, NY, USA) were used as measuring devices. Pure-tone thresholds were obtained at frequencies of 0.25, 0.5, 1, 2, 4, and 8 kHz using an ascending 5 dB method (modified Hughson–Westlake method). Functional gain was calculated by subtracting the aided from the unaided pure-tone threshold. WRS was measured using the Korean standard monosyllabic word lists for adults (KS-MWL-A)29 at the most comfortable level. Participants were presented with 25 monosyllabic words from the KS-MWL-A at 65 dB HL through a loudspeaker located at 0° azimuth and a distance of 1 m. Percent-correct scores were calculated for scoring.
Speech perception
The sentences from the Korean version of the Hearing in Noise Test (K-HINT)30 were used to repeatedly measure the participants’ speech recognition thresholds (SRTs) in both the unaided and aided conditions. In the noisy condition, the signal-to-noise ratio (SNR) was evaluated using K-HINT sentences. Noise was set to 65 dB with a loudspeaker (HS-50M, Yamaha, Japan) at 0° azimuth and 1 m from the participant. The test was carried out while the loudness of the words was adjusted based on the correct and incorrect responses of the participants, and the dB SNR at which 50% of the sentences were recognized was measured.
Real ear measurement
REM was performed on the second and third visits. After otoscopic examination, the loudspeaker was placed at 0° azimuth and a distance of 0.5 m from the participant. A probe tube was inserted into the participant’s ear canal for testing, with the tip placed within 6 mm of the eardrum. After equalization and calibration of the probe microphone, hearing data such as pure-tone threshold were entered and a fitting formula suitable for the hearing assistive device was selected. Real-ear unaided and aided responses were measured with International Speech Test Signal input signals at three sound levels: 55, 65, and 75 dB SPL. The real-ear insertion gain was automatically calculated using REM equipment (AVANT REMsp; MedRx, Largo, FL, USA).
Self-report questionnaires
Several self-report questionnaires were used to evaluate subjective satisfaction with hearing devices, including the Korean version of Abbreviated Profile of Hearing Aid Benefit (K-APHAB),31 Korean version of Tinnitus Handicap Inventory (K-THI),32 Visual Analogue Scale (VAS) for Tinnitus, Korean version of International Outcome Inventory for Hearing Aids (K-IOI-HA),33 and a questionnaire developed by the research host institution.
The APHAB questionnaire assesses hearing discomfort in various everyday situations and consist of four subsections: ease of communication (EC), reverberation (RV), background noise (BN), and aversiveness (AV). VAS for Tinnitus consists of four subsections: loudness, duration, annoyance, and life effect. Both unilateral and bilateral tinnitus cases were included, and assessments were conducted without distinction through questionnaire surveys. The IOI-HA is divided into two factors: factor 1 for hearing device benefit and factor 2 for residual difficulty, and the total score (the sum of the two) was also evaluated.
The questionnaire developed by this research institute includes items on overall satisfaction, hearing improvement, convenience, cosmetic aspect, and cost-effectiveness. The average scores for each item on this questionnaire were also analyzed.
Sample size
The prospective sample size was calculated based on the following assumptions: a one-tailed alpha of 2.5%, a statistical power of 80%, a non-inferiority margin of 10%, and a between-group difference of 0%. The standard deviation was assumed to be 13 based on previous research. The calculated study sample size was 16, and the final sample size, accounting for a 20% dropout rate, was determined to be 20 individuals per group.
Statistical analysis
The test results are presented using descriptive statistics, such as the mean and standard deviation. Independent data were analyzed using one-way ANOVA or the Kruskal–Wallis test. In the case of missing data, a mixed-effects model was used. Paired data were analyzed using the paired t test or repeated measures ANOVA (RM-ANOVA). All data were checked for normality, and the appropriate parametric or nonparametric tests were used based on the results. Tukey’s test was utilized as a multiple comparison method for one-way ANOVA, mixed-effects model, and RM-ANOVA, while Dunn’s test was used for the Kruskal–Wallis test. Statistical analyses were performed using GraphPad Prism 9 (GraphPad Software Inc., San Diego, CA, USA). In all analyses, P < 0.05 was taken to indicate statistical significance.
Ethics statement
The present study protocol was reviewed and approved by the Institutional Review Board of Chungnam National University College of Medicine (approval No. 2020–11–003). Informed consent was submitted by all subjects when they were enrolled.
RESULTS
Participants
In all, 39 participants (14 males, 25 females, age range 41–80 years, average 57.8 years) with UHL completed the trial and their data were included in all analyses (Fig. 1). Each participant was randomly provided one PSAP and one HA. Of these, 14 participants used the basic PSAP, while 25 participants used the high-end PSAP. Twenty-two participants used the basic HA, and 17 participants used the premium HA. The demographic and clinical characteristics of participants for each device are presented in Table 1.
Fig. 1. CONSORT flow diagram.

HA = hearing aid, PSAP = personal sound amplification product.
Table 1. Demographics and clinical characteristics of participants.
| Factors | Basic PSAP | High-end PSAP | Basic HA | Premium HA | |
|---|---|---|---|---|---|
| Sex | |||||
| Total | 14 | 25 | 22 | 17 | |
| Male | 6 | 8 | 7 | 7 | |
| Female | 8 | 17 | 15 | 10 | |
| Age, yr | |||||
| Mean ± SD | 65.7 ± 10.8 | 54.0 ± 9.2 | 56.9 ± 10.9 | 59.9 ± 11.7 | |
| Min–Max | 41–78 | 41–80 | 41–80 | 41–78 | |
| Aided side | |||||
| Right | 4 | 13 | 10 | 7 | |
| Left | 10 | 12 | 12 | 10 | |
| Hearing thresholds,a dB | |||||
| Mean ± SD | 63.7 ± 6.2 | 61.3 ± 9.2 | 60.6 ± 8.5 | 64.1 ± 7.7 | |
| Min–Max | 53.8–71.3 | 43.8–77.5 | 43.8–75.0 | 52.5–77.5 | |
| WRS (%, mean ± SD) | 66.6 ± 17.0 | 63.5 ± 25.8 | 69.1 ± 19.1 | 58.8 ± 26.5 | |
HA = hearing aid, PSAP = personal sound amplification product, SD = standard deviation, WRS = word recognition score.
aHearing thresholds were measured under sound field and obtained by averaging the thresholds at 500, 1,000, 2,000, and 4,000 Hz on a continues scale for the poorer-hearing ear.
Pure-tone thresholds
The mean and standard deviation of pure-tone thresholds were calculated for unaided, PSAP-aided, and HA-aided conditions (Fig. 2). At all measured frequencies, HA outperformed PSAP, while PSAP outperformed the unaided condition. A similar pattern was observed when PSAP and HA were subdivided by grade and compared by device. The functional gains of each device were compared statistically and analyzed for a more accurate comparison. When comparing the functional gain of PSAP with HA, HA demonstrated superior performance at all frequencies tested from 250 Hz to 8 kHz (all P < 0.001, paired t-test). Furthermore, the one-sample t-test was conducted to compare the functional gain value with 0, and showed P < 0.001 at all frequencies, indicating significant hearing improvement with both PSAP and HA in contrast to the unaided condition. On the other hand, comparison of functional gain for each device revealed significant differences between groups at 2, 3, 4, 6, and 8 kHz (all P < 0.01, ANOVA or Kruskal–Wallis test), but none were statistically significant at 0.25, 0.5, and 1 kHz (P = 0.371, 0.228, 0.055, respectively). Multiple comparative tests were conducted at significant frequencies, and basic and premium HA outperformed basic and high-end PSAP at 2, 3, and 4 kHz. At 6 kHz, basic, and premium HA performed significantly better than high-end PSAP, while at 8 kHz basic HA outperformed either basic or high-end PSAP.
Fig. 2. Comparison of audiometry results between unaided, PSAP-aided, and (HA-aided conditions. Symbols and vertical bars represent means and standard deviations, respectively. (A) Pure-tone thresholds for all 39 participants. (B) Device-specific pure-tone thresholds. (C) Functional gain comparison of PSAP and HA for all 39 participants. (D) Functional gain comparison of groups based on device. (E) Comparison of WRSs for all 39 participants under unaided, PSAP-aided, and HA-aided conditions. (F) Comparison of WRSs among device groups.

PSAP = personal sound amplification product, HA = hearing aid, WRS = word recognition score.
**P < 0.01, ***P < 0.001, ****P < 0.0001.
Speech discrimination
WRSs were analyzed to compare the levels of speech discrimination in the aided condition. The results of repeated measures ANOVA revealed clear differences between unaided, PSAP-aided, and HA-aided conditions (Fig. 2). Both PSAP and HA showed significant improvements in WRS compared to the unaided condition (both P < 0.001). In addition, the use of HA provided a significant advantage over the use of PSAP (P < 0.001). In comparative analysis by device group (Kruskal–Wallis test), all devices exhibited significantly improved WRS than the unaided condition (P = 0.013 in basic PSAP, P < 0.001 in the others). However, there were no significant differences in WRS among the devices.
Speech perception in quiet and in noise
Fig. 3 presents the results of speech perception tests in quiet and noisy conditions for each aided condition. In the quiet testing environment of the K-HINT, the SRT was significantly lower in the PSAP-aided condition than in the unaided condition and lower in the HA-aided condition than in the PSAP-aided condition. The SRTs of the three conditions showed significant differences from each other (all P < 0.001, RM-ANOVA). When the SRTs in quiet condition were compared by device (ANOVA), all devices had a significantly lower threshold than the unaided condition (all P < 0.001). Basic HA showed a significantly lower SRT than basic PSAP (P = 0.004) and high-end PSAP (P = 0.009), while premium HA showed a significant difference only compared to basic PSAP (P = 0.046).
Fig. 3. Comparison of speech perception using the Korean version of the Hearing-in-Noise Test. Symbols and vertical bars represent the means and standard deviations, respectively. (A) SRT in quiet testing environment for unaided condition, PSAPs condition, and the HAs condition. (B) SRT in quite condition for each type of device. (C) SNR in the noisy testing environment for unaided, PSAP-aided, and HA-aided conditions. (D) SNR in the noisy environment for each type of device.

PSAP = personal sound amplification product, HA = hearing aid, SRT = speech recognition threshold, SNR = signal-to-noise ratio.
*P < 0.05, **P < 0.01, ****P < 0.0001.
The SRT in noisy conditions showed a similar pattern to test findings in quiet conditions. The SNR in the noisy testing environment decreased gradually from unaided to PSAP-aided to HA-aided, with each showing a significant difference (all P < 0.001, RM-ANOVA). When the SNR in the noisy condition for each hearing device was analyzed (Kruskal–Wallis test), the unaided condition had a significantly higher SNR than the other devices (P = 0.005 in basic PSAP, P < 0.001 in other devices). The use of basic HA produced much better outcomes than the use of basic PSAP (P = 0.048), and there were no significant differences between the other devices.
Real ear measurement
Real ear insertion gains (REIGs) were assessed for each hearing device according to input level, and differences in REIG between devices for each frequency were analyzed by ANOVA or the Kruskal–Wallis test depending on normality (Fig. 4). At an input level of 55 dB, significant differences were found between devices at all frequencies, whereas at input levels of 65 dB or 75 dB significant differences were observed only at 1–8 kHz. Multiple comparisons were conducted on frequencies with significant interdevice differences. In all cases, there were no statistically significant differences in REIG between basic and premium HAs. Interestingly, the basic PSAPs showed considerably better REIG at 1 kHz than the high-end PSAPs regardless of input level. In other cases, there were no differences in REIG between basic and high-end PSAPs, and all significant differences were found when comparing PSAPs and HAs.
Fig. 4. Real ear insertion gains for each hearing device measured at input levels of 55 dB (A), 65 dB (B), and 75 dB (C). Symbols and vertical bars represent the means and standard deviations, respectively.

REIG = real ear insertion gain, PSAP = personal sound amplification product, HA = hearing aid.
*P < 0.05, **P < 0.01, ****P < 0.0001.
Questionnaires
Abbreviated Profile of Hearing Aid Benefit (APHAB)
The APHAB scores were compared across the various hearing devices (Fig. 5). Both basic and premium types of HAs led to reduced discomfort compared to the unaided condition in the EC, RV, and BN subscales. However, no significant differences were observed across conditions in the AV subscale.
Fig. 5. APHAB comparison of the hearing devices for each subscale. Symbols and vertical bars represent the means and standard deviations, respectively. (A) Ease of communication. (B) Reverberation. (C) Background noise. (D) Aversiveness.

APHAB = Abbreviated Profile of Hearing Aid Benefit, EC = ease of communication, PSAP = personal sound amplification product, HA = hearing aid, RV = reverberation, BN = background noise, AV = aversiveness.
*P < 0.05, **P < 0.01.
Tinnitus questionnaire assessment
To evaluate subjective changes in tinnitus before and after using hearing devices, THI and VAS questionnaires were utilized. The usage of PSAPs and HAs did not have any significant effect on the subjective alleviation of tinnitus. There were no significant differences in THI score between the unaided, PSAP, and HA conditions (Fig. 6, P = 0.567), and the same observation was made in the analysis by device (P = 0.152). The 10-point VAS for Tinnitus Loudness, Duration, Annoyance, and Life Effect showed no significant changes after wearing the hearing devices (Fig. 6, P = 0.393, 0.942, 0.652, 0.684, respectively), and no significant differences were observed across the devices.
Fig. 6. Comparison of questionnaires between the unaided, PSAP, and HA conditions. Symbols and vertical bars represent the means and standard deviations, respectively. (A) THI comparison of the unaided, PSAP, and HA conditions for all 39 participants. (B) THI comparison of the groups based on the device. (C–F) VAS for Tinnitus comparison of hearing devices for each subscale. (G) International Outcome Inventory for Hearing Aids by device. Factor 1: use of HA, perceived benefits, satisfaction, and quality of life. Factor 2: residual activity limitation, residual participation restriction and impact on others. (H) Questionnaire developed by the research institution. Symbols and vertical bars represent the means and standard deviations, respectively.

THI = Tinnitus handicap inventory, PSAP = personal sound amplification product, HA = hearing aid.
**P < 0.01, ****P < 0.0001.
International Outcome Inventory for Hearing Aids (IOI-HA)
The Korean version of the IOI-HA questionnaire was used to evaluate the results of each hearing device (Fig. 6). Factor 1, which is the sum of the scores of questions linked to the evaluation of the hearing device, factor 2, the sum of the scores of questions about the influence of the hearing device on the individual’s external activities, and the total score, which is the sum of the scores of the other two factors, were analyzed. All of these factors showed significant differences between devices, and these differences were analyzed using multiple comparisons. In factor 1, basic and premium HA outperformed high-end PSAP (P < 0.001 both). The factor 2 score for basic HA was greater than for basic and high-end PSAP (P = 0.037, P = 0.003, respectively). When comparing the total scores, basic HA outperformed both basic and high-end PSAP (P = 0.015, P < 0.001, respectively), and premium HA also scored significantly higher than high-end PSAP (P < 0.001).
Own questionnaire developed by the research host institution
The results of the satisfaction questionnaire developed by the research institution were analyzed by device, and significant differences were found in all five categories and for the average scores (Fig. 6, P < 0.001, Kruskal–Wallis test). Multiple comparisons were used to analyze statistical significance in detail. HA outperformed PSAP in terms of overall satisfaction, hearing improvement, convenience, cost-effectiveness, and average scores, which were unrelated to the type of HA and PSAP. Premium HA outscored basic and high-end PSAP in cosmetic scores, while basic HA outscored only basic PSAP. There were no differences in any subcategory between basic and high-end PSAPs or basic and premium HAs.
DISCUSSION
This study critically examined the efficacy of PSAPs in comparison to HAs for individuals with moderate to moderately severe UHL. Our findings revealed that while PSAPs provide significant improvements in functional gain, WRS, and speech perception in both quiet and noisy environments over the unaided condition, their effectiveness falls considerably short of HAs. This is consistent with existing literature on bilateral hearing loss, indicating a general limitation in PSAPs’ amplification abilities.15,17,34
Notably, the limited effectiveness of PSAPs in high-frequency ranges, as previously reported,17,19,20,21,34,35 was also observed in our study. This was particularly evident when comparing functional gain across four devices and REIG. This suggests that, especially for individuals with poor high-frequency hearing, HAs might be a more suitable recommendation.
Furthermore, our participant surveys highlighted a marked preference for HAs over PSAPs in terms of subjective satisfaction. Both the IOI-HA and our institution’s own questionnaire indicated a perceptible edge for HAs. Additionally, in three out of the four categories of the APHAB, PSAPs did not show significant benefits over unaided hearing, whereas HAs were much more satisfying for participants. This supports existing research suggesting that PSAPs are less effective in environments with BN.17,20,22,34
To the best of our knowledge, this is the first study to investigate the use of PSAPs for UHL. Our findings are particularly relevant considering the often-overlooked segment of individuals with moderate to severe UHL, who typically show less interest in hearing rehabilitation due to the presence of one functioning ear.27 Despite this, our results suggest that PSAPs, while not as effective as HAs, can still offer tangible benefits. Given PSAPs' greater accessibility and affordability, they could represent an attractive initial option in hearing rehabilitation for this group. The results of a recent survey indicated that the rate of perception of PSAPs is exceedingly low.36 It is crucial for hearing care professionals to provide accurate information about PSAPs, enhancing public awareness and enabling informed decisions. Nevertheless, it is important to acknowledge the limitations of PSAPs in comparison to HAs, particularly in terms of auditory improvement.
One limitation of our study is the relatively small participant pool. This limited the statistical power to draw definitive conclusions, especially when categorizing devices by effectiveness. Additionally, the diverse range of hearing loss severity among participants restricted our ability to precisely determine PSAPs' impact on UHL. Future research should aim for more granular analyses with larger sample sizes and more specific categorization of hearing loss levels. Moreover, a longer study duration would likely provide a deeper understanding of PSAPs’ long-term effectiveness.
Another limitation of this study is the diversity and variability of PSAPs available in the market. The specific models used in our research might not comprehensively represent the entire spectrum of PSAPs currently available. This significant variation in the quality and features of PSAPs across different brands and models suggests that our findings may not be universally applicable to all PSAPs. As such, caution should be exercised when extrapolating our results to the broader market of PSAPs.
In summary, our findings provide critical insights into the differential capabilities of PSAPs and HAs in treating UHL. They imply that for patients with moderate to moderately severe UHL, HAs should be recommended for more effective communication in diverse environments. However, PSAPs can still be considered as a viable first step for patients hesitant about the cost or complexity of traditional HAs. This underscores the need for a personalized approach in hearing rehabilitation, considering the individual patient's lifestyle, severity of hearing loss, and specific listening needs.
Footnotes
Funding: This research was supported by a grant of Patient-Centered Clinical Research Coordinating Center (PACEN) funded by the Ministry of Health & Welfare, Republic of Korea (grant number: HC19C0128). The funders had no role in study design, data collection and analysis, decision to publish, or preparation of the manuscript.
Disclosure: The authors have no potential conflicts of interest to disclose.
- Conceptualization: Park YH.
- Data curation: Kim MS, Kim KH, Park YH.
- Formal analysis: Kim MS, Kim KH, Choe G.
- Funding acquisition: Park YH.
- Investigation: Kim KH, Park YH.
- Methodology: Kim KH, Choe G, Park YH.
- Resources: Park YH.
- Software: Kim KH.
- Supervision: Park YH.
- Validation: Choe G.
- Visualization: Kim KH, Choe G.
- Writing - original draft: Kim MS.
- Writing - review & editing: Choe G, Park YH.
References
- 1.World Health Organization. Addressing the Rising Prevalence of Hearing Loss. Geneva, Switzerland: World Health Organization; 2018. [Google Scholar]
- 2.Mathers C, Smith A, Concha M. Global Burden of Hearing Loss in the Year 2000. Geneva, Switzerland: World Health Organization; 2000. pp. 1–30. [Google Scholar]
- 3.Gates GA, Mills JH. Presbycusis. Lancet. 2005;366(9491):1111–1120. doi: 10.1016/S0140-6736(05)67423-5. [DOI] [PubMed] [Google Scholar]
- 4.Choi J, Chung WH. Age-related hearing loss and the effects of hearing aids. J Korean Med Assoc. 2011;54(9):918. [Google Scholar]
- 5.Atef RZ, Michalowsky B, Raedke A, Platen M, Mohr W, Mühlichen F, et al. Impact of hearing aids on progression of cognitive decline, depression, and quality of life among people with cognitive impairment and dementia. J Alzheimers Dis. 2023;92(2):629–638. doi: 10.3233/JAD-220938. [DOI] [PubMed] [Google Scholar]
- 6.Dillard LK, Pinto A, Mueller KD, Schubert CR, Paulsen AJ, Merten N, et al. Associations of hearing loss and hearing aid use with cognition, health-related quality of life, and depressive symptoms. J Aging Health. 2023;35(7-8):455–465. doi: 10.1177/08982643221138162. [DOI] [PMC free article] [PubMed] [Google Scholar]
- 7.Marques T, Marques FD, Miguéis A. Age-related hearing loss, depression and auditory amplification: a randomized clinical trial. Eur Arch Otorhinolaryngol. 2022;279(3):1317–1321. doi: 10.1007/s00405-021-06805-6. [DOI] [PubMed] [Google Scholar]
- 8.Naylor G, Dillard L, Orrell M, Stephan BC, Zobay O, Saunders GH. Dementia and hearing-aid use: a two-way street. Age Ageing. 2022;51(12):afac266. doi: 10.1093/ageing/afac266. [DOI] [PMC free article] [PubMed] [Google Scholar]
- 9.Weinstein BE, Sirow LW, Moser S. Relating hearing aid use to social and emotional loneliness in older adults. Am J Audiol. 2016;25(1):54–61. doi: 10.1044/2015_AJA-15-0055. [DOI] [PubMed] [Google Scholar]
- 10.Zahl SM. Effects of receiving hearing aids on health-related quality of life in adults with mild hearing loss. J Audiol Otol. 2023;27(1):24–29. doi: 10.7874/jao.2022.00227. [DOI] [PMC free article] [PubMed] [Google Scholar]
- 11.Bisgaard N, Zimmer S, Laureyns M, Groth J. A model for estimating hearing aid coverage world-wide using historical data on hearing aid sales. Int J Audiol. 2022;61(10):841–849. doi: 10.1080/14992027.2021.1962551. [DOI] [PubMed] [Google Scholar]
- 12.Grundfast KM, Liu SW. What otolaryngologists need to know about hearing aids. JAMA Otolaryngol Head Neck Surg. 2017;143(2):109–110. doi: 10.1001/jamaoto.2016.3416. [DOI] [PubMed] [Google Scholar]
- 13.Powell W, Jacobs JA, Noble W, Bush ML, Snell-Rood C. Rural adult perspectives on impact of hearing loss and barriers to care. J Community Health. 2019;44(4):668–674. doi: 10.1007/s10900-019-00656-3. [DOI] [PubMed] [Google Scholar]
- 14.Valente M, Amlani AM. Cost as a barrier for hearing aid adoption. JAMA Otolaryngol Head Neck Surg. 2017;143(7):647–648. doi: 10.1001/jamaoto.2017.0245. [DOI] [PubMed] [Google Scholar]
- 15.Brody L, Wu YH, Stangl E. A comparison of personal sound amplification products and hearing aids in ecologically relevant test environments. Am J Audiol. 2018;27(4):581–593. doi: 10.1044/2018_AJA-18-0027. [DOI] [PMC free article] [PubMed] [Google Scholar]
- 16.Cho YS, Park SY, Seol HY, Lim JH, Cho YS, Hong SH, et al. Clinical performance evaluation of a personal sound amplification product vs a basic hearing aid and a premium hearing aid. JAMA Otolaryngol Head Neck Surg. 2019;145(6):516–522. doi: 10.1001/jamaoto.2019.0667. [DOI] [PMC free article] [PubMed] [Google Scholar]
- 17.Choi JE, Kim J, Yoon SH, Hong SH, Moon IJ. A personal sound amplification product compared to a basic hearing aid for speech intelligibility in adults with mild-to-moderate sensorineural hearing loss. J Audiol Otol. 2020;24(2):91–98. doi: 10.7874/jao.2019.00367. [DOI] [PMC free article] [PubMed] [Google Scholar]
- 18.Chen CH, Huang CY, Cheng HL, Lin HH, Chu YC, Chang CY, et al. Comparison of personal sound amplification products and conventional hearing aids for patients with hearing loss: a systematic review with meta-analysis. EClinicalMedicine. 2022;46:101378. doi: 10.1016/j.eclinm.2022.101378. [DOI] [PMC free article] [PubMed] [Google Scholar]
- 19.Kim GY, Kim S, Jo M, Seol HY, Cho YS, Lim J, et al. Hearing and speech perception for people with hearing loss using personal sound amplification products. J Korean Med Sci. 2022;37(12):e94. doi: 10.3346/jkms.2022.37.e94. [DOI] [PMC free article] [PubMed] [Google Scholar]
- 20.Perron M, Lau B, Alain C. Interindividual variability in the benefits of personal sound amplification products on speech perception in noise: a randomized cross-over clinical trial. PLoS One. 2023;18(7):e0288434. doi: 10.1371/journal.pone.0288434. [DOI] [PMC free article] [PubMed] [Google Scholar]
- 21.Sheffield SW, Jacobs M, Ellis C, Jr, Gerasimchik A. Comparing direct-to-consumer devices to hearing aids: amplification accuracy for three types of hearing loss. Am J Audiol. 2023 doi: 10.1044/2023_AJA-22-00170. [DOI] [PubMed] [Google Scholar]
- 22.Reed NS, Betz J, Kendig N, Korczak M, Lin FR. Personal sound amplification products vs a conventional hearing aid for speech understanding in noise. JAMA. 2017;318(1):89–90. doi: 10.1001/jama.2017.6905. [DOI] [PMC free article] [PubMed] [Google Scholar]
- 23.Bess FH, Tharpe AM, Gibler AM. Auditory performance of children with unilateral sensorineural hearing loss. Ear Hear. 1986;7(1):20–26. doi: 10.1097/00003446-198602000-00005. [DOI] [PubMed] [Google Scholar]
- 24.Douglas SA, Yeung P, Daudia A, Gatehouse S, O’Donoghue GM. Spatial hearing disability after acoustic neuroma removal. Laryngoscope. 2007;117(9):1648–1651. doi: 10.1097/MLG.0b013e3180caa162. [DOI] [PubMed] [Google Scholar]
- 25.Dwyer NY, Firszt JB, Reeder RM. Effects of unilateral input and mode of hearing in the better ear: self-reported performance using the speech, spatial and qualities of hearing scale. Ear Hear. 2014;35(1):126–136. doi: 10.1097/AUD.0b013e3182a3648b. [DOI] [PMC free article] [PubMed] [Google Scholar]
- 26.Firszt JB, Reeder RM, Holden LK. Unilateral hearing loss: understanding speech recognition and localization variability-implications for cochlear implant candidacy. Ear Hear. 2017;38(2):159–173. doi: 10.1097/AUD.0000000000000380. [DOI] [PMC free article] [PubMed] [Google Scholar]
- 27.Golub JS, Lin FR, Lustig LR, Lalwani AK. Prevalence of adult unilateral hearing loss and hearing aid use in the United States. Laryngoscope. 2018;128(7):1681–1686. doi: 10.1002/lary.27017. [DOI] [PubMed] [Google Scholar]
- 28.Suh MJ, Lee J, Cho WH, Jin IK, Kong TH, Oh SH, et al. Improving accuracy and reliability of hearing tests: an exploration of international standards. J Audiol Otol. 2023;27(4):169–180. doi: 10.7874/jao.2023.00388. [DOI] [PMC free article] [PubMed] [Google Scholar]
- 29.Kim JS, Lim D, Hong HN, Shin HW, Lee KD, Hong BN, et al. Development of Korean standard monosyllabic word lists for adults (KS-MWL-A) Audiology. 2008;4(2):126–140. [Google Scholar]
- 30.Moon SK, Mun HA, Jung HK, Soli SD, Lee JH, Park K. Development of Sentences for Korean Hearing in Noise Test (KHINT) Korean J Otorhinolaryngol-Head Neck Surg. 2005;48(6):724–728. [Google Scholar]
- 31.Lim HJ, Park MK, Cho YS, Han GC, Choi JW, An YH, et al. Validation of the Korean version of the abbreviated profile of hearing aid benefit. Korean J Otorhinolaryngol-Head Neck Surg. 2017;60(4):164–173. [Google Scholar]
- 32.Kim JH, Lee SY, Kim CH, Lim SL, Shin JN, Chung WH, et al. Reliability and validity of a Korean adaptation of the Tinnitus Handicap Inventory. Korean J Otorhinolaryngol-Head Neck Surg. 2002;45(4):328–334. [Google Scholar]
- 33.Chu H, Cho YS, Park SN, Byun JY, Shin JE, Han GC, et al. Standardization for a Korean adaptation of the international outcome inventory for hearing aids: study of validity and reliability. Korean J Otorhinolaryngol-Head Neck Surg. 2012;55(1):20–25. [Google Scholar]
- 34.Kim GY, Kim JS, Jo M, Seol HY, Cho YS, Moon IJ. Feasibility of personal sound amplification products in patients with moderate hearing loss: a pilot study. Clin Exp Otorhinolaryngol. 2022;15(1):60–68. doi: 10.21053/ceo.2020.02313. [DOI] [PMC free article] [PubMed] [Google Scholar]
- 35.Venkitakrishnan S, Urbanski D, Wu YH. Efficacy and effectiveness of evidence-based non-self-fitting presets compared to prescription hearing aid fittings and a personal sound amplification product. Am J Audiol. 2023;33(1):1–24. doi: 10.1044/2023_AJA-23-00121. [DOI] [PMC free article] [PubMed] [Google Scholar]
- 36.Han JS, Kim Y, Park MK, Song JJ, Moon IJ, Lee W, et al. Perception and expectations of personal sound amplification products in Korea: a hospital-based, multi-center, cross-sectional survey. PLoS One. 2022;17(5):e0269123. doi: 10.1371/journal.pone.0269123. [DOI] [PMC free article] [PubMed] [Google Scholar]