Abstract
Introduction
On-treatment excursions of liver laboratory test values in clinical trials involving subjects with underlying liver disease are relevant for the efficacy and safety assessment of drug products and biologics. Existing visualization and analysis tools do not efficiently provide an integrated view of these excursions when baseline liver tests are abnormal.
Objective
The aim of this study was to develop a composite plot that enables visualization of on-treatment changes in liver test results both as multiples of the upper limit of normal defined by each laboratory’s reference population (×ULN) and multiples of the subjects’ baseline (×BLN) values.
Methods
The composite plot approach combines biochemical evaluation for drug-induced severe hepatotoxicity (eDISH) plots sequentially applied to subjects’ baseline and peak on-treatment liver test results normalized by ULN and integrates them into a four-panel shift plot of peak on-treatment values normalized by BLN.
Results
The composite plot enabled efficient assessment of improvement in liver test values during treatment compared with pretreatment in subjects treated with the investigational drug (or the natural history of placebo-treated subjects) and identified outlier subjects for potential drug-induced liver injury.
Conclusion
For studies in subjects with abnormal baseline values, the composite plot has potential application in the assessment of beneficial and concerning on-treatment modifications in liver test values in reference to the individual subject’s baseline and population threshold values.
Key Points
| The plot shows on-treatment migration in liver tests relative to population reference and individual baseline values. |
| It enables quantitative comparisons of benefit or risk across treatments. |
Introduction
A decline in liver enzyme values in patients with liver disease, such as in chronic hepatitis, serves as an important biomarker for treatment success [1, 2]. Conversely, elevations in the same parameters can signal possible drug-induced liver injury (DILI) [3]. Whereas benefit and risk can accrue from the same intervention, the safety and efficacy assessments of a drug or biologic are typically conducted independently, based on the analysis datasets supporting protocol-specified safety and efficacy endpoints. Moreover, while existing drug review tools [4, 5] have focused on the assessment of liver injury, it remains challenging to measure harms and benefits of investigational products for the treatment of liver disease [6]. Analyses using these tools rely on comparison to laboratory-specific population norms (i.e., analyzed as multiples of the upper limit of normal or ULN) but not normalized to the individual’s pretreatment values (i.e., analyzed as multiples of the subject’s baseline or BLN), that can vary widely in patients with underlying liver disease [3].
We propose novel composite plotting that integrates the eDISH plot [7] quadrants with a shift plot of on-treatment peak liver test values based on multiples of baseline values to enable assessments of DILI and beneficial drug effect. Anchoring baseline shift plots within an eDISH approach frames the shift from baseline within known population thresholds of risk. We illustrate the utility of this tool in the analysis of chronic hepatitis C (CHC) clinical trials and in a rare genetic liver disease to demonstrate how the tool can be used to quickly assess trends in population and individual treatment response, identify plot migration that could indicate potential benefit or risk, and assess the magnitude of that change relative to the subjects’ baseline injury.
Materials and Methods
The eDISH Plot
The eDISH plot is a log-log scatter plot where the x-axis is the peak on-treatment alanine aminotransferase (ALT) and the y-axis is the peak on-treatment total bilirubin (BILI), both depicted in multiples of the ULN (Fig. 1) [8–10]. A vertical line at 3×ULN and a horizontal line at 2×ULN indicate eDISH cutoff points and divide the plot area into four quadrants. The upper right quadrant is labeled as Hy’s Law quadrant and includes subjects with ALT elevations greater than 3×ULN and BILI elevations greater than 2×ULN. Subjects in this quadrant have laboratory abnormalities that indicate a drug’s potential for causing serious liver injury. The lower right quadrant is labeled as Temple’s Corollary and includes subjects with ALT elevation greater than 3×ULN and BILI not more than 2×ULN. Subjects in this quadrant are at an increased risk for hepatocellular injury. The upper left quadrant is labeled as Cholestasis quadrant and includes subjects with ALT not more than 3×ULN and BILI elevation greater than 2×ULN. Subjects in this quadrant are at an increased risk for cholestatic liver injury. The lower left quadrant includes subjects with neither ALT greater than 3×ULN nor BILI greater than 2×ULN. Since this quadrant contains subjects with normal and near normal elevations in both ALT and BILI, we labeled it as Normal & NN quadrant. The eDISH plot therefore categorizes a trial population at risk for DILI into these 4 groups: Normal & NN, Cholestasis, Temple’s Corollary and Hy’s Law.
Fig. 1.
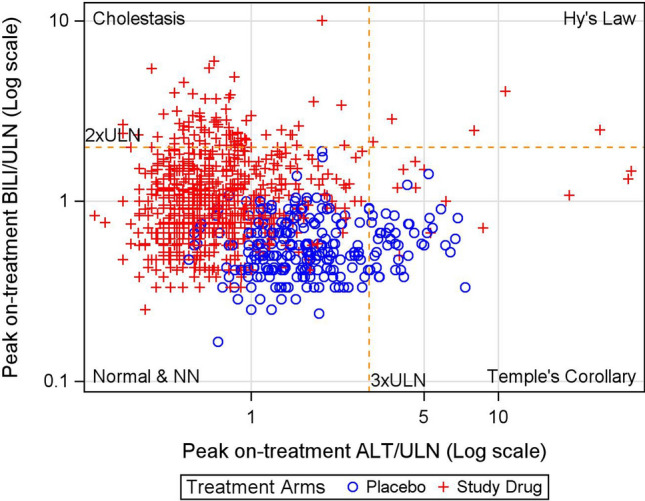
eDISH plot for a placebo-controlled phase III trial submitted to the US FDA in support of a new drug for CHC. ALT alanine aminotransferase, BILI total bilirubin, CHC chronic hepatitis C, eDISH electronic drug-induced serious hepatotoxicity, NN near normal, ULN upper limit of normal
The Composite Plot
The composite plot was generated through three steps (Table 1). To explain the steps and introduce the composite plot, we used a hypothetical dataset of four subjects. In Step 1, to understand the extent of liver injury on study entry, pretreatment liver tests of subjects were analyzed to determine their level of elevation using the eDISH plot thresholds for ALT and BILI (Fig. 2a) [9]. In this and all subsequent steps, subjects were grouped using colored symbols assigned according to their pseudo eDISH quadrants based on their pretreatment tests values, i.e., normal or near normal (Normal & NN) group (green square), Temple’s Corollary group (blue plus), Cholestasis group (yellow circle), and Hy’s Law group (red triangle).
Table 1.
Sequential analytic steps in developing the composite plot, their function and use in review
| Steps | Function | Use in review | |
|---|---|---|---|
|
Step 1: Pretreatment eDISH plot Scatterplot of pretreatment BILI and ALT values in ×ULN. Subjects are represented by colored symbols corresponding to the pretreatment quadrant: |
Identifies subjects based on the degree of existing liver injury in an eDISH plot |
What are the subjects’ test values before treatment? Identifies extent and relative proportions of abnormal liver tests in the population |
|
 Normal & NN Normal & NN |
 Temple’s Corollary Temple’s Corollary |
||
 Cholestasis Cholestasis |
 Hy’s Law Hy’s Law |
||
|
Step 2: Peak on-treatment eDISH plot Subjects were replotted in an on-treatment eDISH scatterplot showing peak on-treatment BILI and ALT values in ×ULN |
Identifies on-treatment migration path between each eDISH quadrant |
Which subjects had more extreme ALT and BILI in the population? What is the subject’s origin and destination between different quadrants on eDISH plot? Identifies extent and relative proportions of subjects that migrate between pretreatment and peak on-treatment values |
|
|
Step 3: Peak on-treatment composite plot (×BLN based) The peak on-treatment BILI and ALT values replotted from ×ULN to ×BLN in each of the eDISH quadrants |
Treatment responses of subjects in each eDISH quadrant from Step 2 presented visually as ×BLN, to quickly assess liver tests’ rise or fall from BLN |
For subjects within the ×ULN quadrant, how do the peak on-treatment values change compared with their individual pretreatment values? Identifies magnitude of increase or decrease of BILI and ALT values for subjects in each eDISH quadrant compared with their baseline Comparison of proportions of subjects that had liver tests worsen or stabilize/improve on treatment |
|
ALT alanine aminotransferase, BILI total bilirubin, BLN baseline liver test value, eDISH electronic drug-induced serious hepatotoxicity, NN near normal, ULN upper limit of normal
Fig. 2.
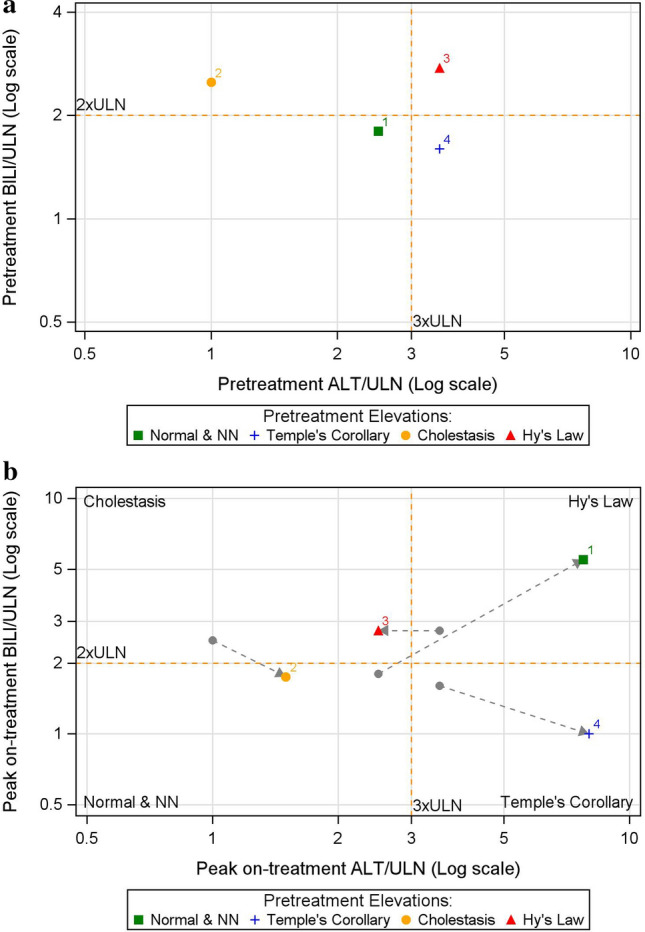
eDISH plot of pretreatment (baseline) liver tests (a) and peak on-treatment liver tests (b) where each subject is identified by a colored symbol corresponding to its pretreatment eDISH quadrant. ALT alanine aminotransferase, BILI total bilirubin, eDISH electronic drug-induced serious hepatotoxicity, NN near normal, ULN upper limit of normal
In Step 2, to characterize response to intervention, a classical eDISH plot was generated to identify subjects’ peak on-treatment liver test quadrants (Fig. 2b). This step captures individual subjects’ migration from baseline to on-treatment peak values by identifying subjects by their quadrant of origin through the colored symbols assigned to them in Step 1. For instance, in Fig. 2b, subject 3 was in the Hy’s Law quadrant where both ALT and BILI were elevated at baseline, and then moved to Cholestasis quadrant on treatment where only BILI is elevated based on the eDISH thresholds as indicated by the arrows in the figure. Identifying such migration is critical to understanding potential DILI and improvement in liver tests from baseline values.
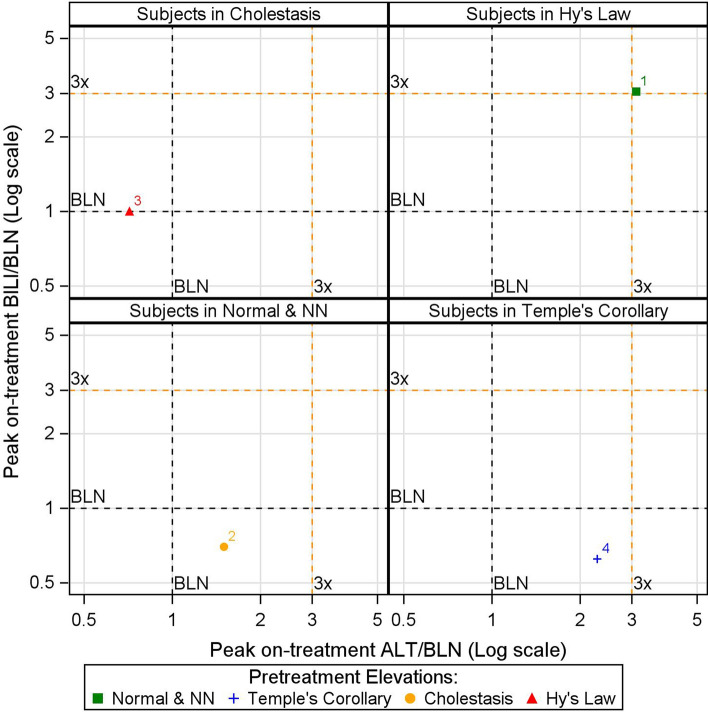
In Step 3, subjects within each quadrant of the eDISH plot in Step 2 are plotted into a scatterplot where each axis represents peak on-treatment liver test in ×BLN. Fig. 3 shows such a scatter plot for the subject in the Hy’s Law quadrant of the eDISH plot in Fig. 2b. This two-dimensional shift plot captures both the magnitude and direction of change in peak on-treatment liver test values of a subject compared with its corresponding baseline values by referencing the horizontal (BILI) and vertical (ALT) lines at 1×BLN. Compared with their baseline, subjects located to the left of the 1×BLN vertical line had reductions in ALT during treatment while subjects to the right had an elevation. Similarly, subjects located below the 1×BLN line had reductions in BILI on-treatment, while those above it had elevations. The additional horizontal and vertical cut-off lines help visualize the extent of the liver test changes. For instance, in Fig. 3, subject 1 experienced an increase in both ALT and BILI by more than three times its respective baseline values.
Fig. 3.
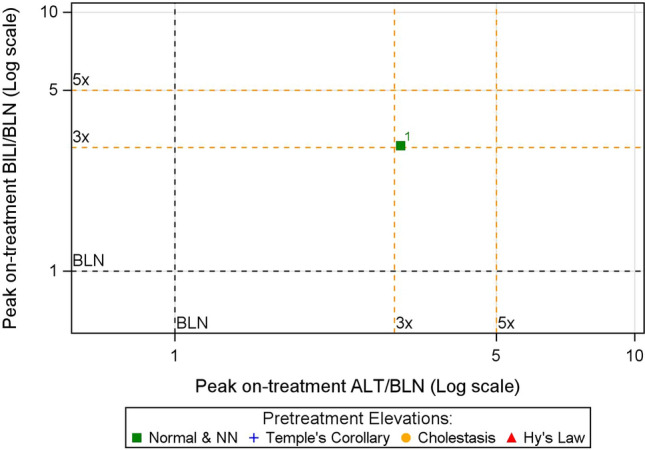
Shift plot from pretreatment to peak on-treatment liver test values for the subject in Hy’s Law quadrant of the eDISH plot depicted in Fig. 2b. ALT alanine aminotransferase, BILI total bilirubin, BLN baseline liver test value, eDISH electronic drug-induced serious hepatotoxicity, NN near normal
Putting these three elements together—the colored symbol that represents a subject’s pretreatment elevation, the panel where the subject belongs, and the location of the subject within the panel—the composite plot enables visualization of migration of subjects from pretreatment to peak on-treatment in terms of eDISH quadrant changes, as well as the magnitude of these changes in terms of their respective baseline test values. For instance, in Fig. 4, subject 1 migrated from Normal & NN quadrant at baseline to Hy’s Law quadrant on treatment and experienced an increase in both ALT and BILI by more than three times its respective baseline values, whereas subject 3 migrated from Hy’s Law quadrant at baseline to Cholestasis quadrant on-treatment and experienced reduction in ALT, but BILI remained the same compared with its respective baseline values.
Fig. 4.
The composite plot for the hypothetical dataset. ALT alanine aminotransferase, BILI total bilirubin, BLN baseline liver test value, NN near normal
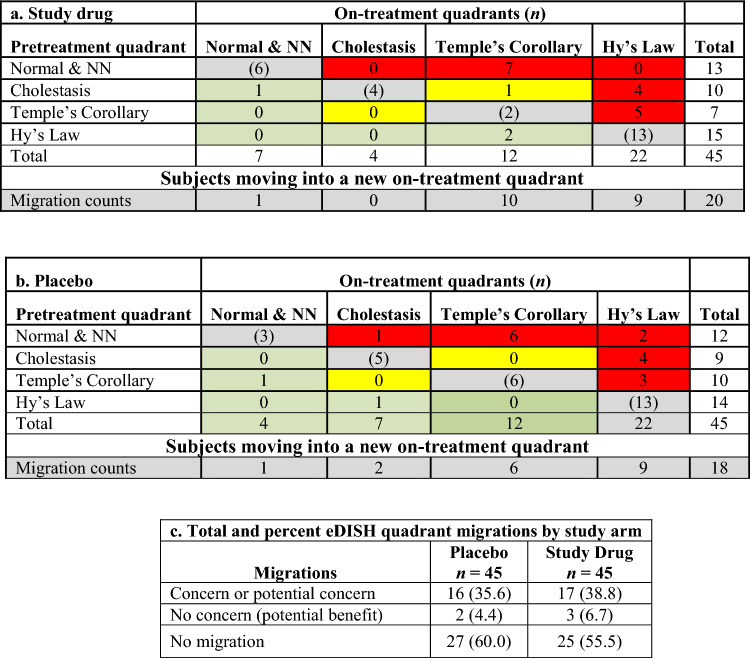
Quadrant tallies from the composite plots provide quantitative estimates of the relative proportion of potentially beneficial or concerning migrations during the trial. The number of subjects that move from the pretreatment quadrants to the on-treatment eDISH quadrants can be summarized in an eDISH migration table such as Table 2. Migrations are color coded for level of concern for potential DILI. The subjects that are retained in their pretreatment quadrants are shown in gray. The differences in migration into a quadrant of concern for DILI risk (red) or a quadrant of benefit or less concern (green) between treatment arms can be assessed by comparing tables derived from the separate composite plots. Interpretation of migration into the yellow boxes can be assessed on a case-by-case basis in the context of the trial, the drug in question, and the underlying disease. For example, a patient enrolled in a trial for primary biliary cholangitis (PBC) might move from the Cholestasis to Temple’s Corollary by resolving their jaundice but then experience DILI with elevation of ALT. Conversely, a subject in a viral hepatitis trial may improve their ALT (migrate out of Temple’s Corollary) but experience a cholestatic DILI with jaundice. Case level assessment of subjects in the yellow boxes may be needed within the context of the disease and trial.
Table 2.
eDISH quadrants migration from pretreatment to peak on-treatment
Color codes: red—migration of concern; yellow—migration of potential concern; green—migration of no concern; gray—no migration
NN near normal
In the final step of the composite plot, the magnitude of change relative to the individual’s pretreatment test values is provided. Summary tallies of the shifts in on-treatment ALT and BILI in reference to the individual subject’s pretreatment levels (×BLN) can be compared by study arm. Differences in the proportion of subjects with an increase or decrease ×BLN between treatment arms for ALT (to the right or left of the vertical ×BLN line) and BILI (above or below the horizontal ×BLN line) may help discern benefit or harm attributable to the intervention. A visual inspection of the distribution of subjects in the shift ×BLN plots may help define multiples of BLN that result in greater separation of effect between study arms.
Results
Implementation of the Composite Plot in a Trial for Chronic Liver Disease
Data was obtained from a 6-month placebo-controlled study of subjects with marked abnormal baseline liver tests to explore the change in liver biochemistry markers by study arm. Baseline liver analytes by study arm are summarized in Table 3.
Table 3.
Baseline liver analytes (mean ± SD)
| Analytes | Placebo n = 45 |
Study drug n = 45 |
|---|---|---|
| AST (IU/L) | 125 ± 96 | 119 ± 100 |
| ALT (IU/L) | 121 ± 99) | 108 ± 90 |
| BILI (mg/dL) | 3.8 ± 4.6 | 4 ± 3.7 |
| ALP (IU/L) | 512 ± 255 | 595 ± 292 |
ALP alkaline phosphatase, ALT alanine aminotransferase, AST aspartate aminotransferase, BILI total bilirubin, SD standard deviation
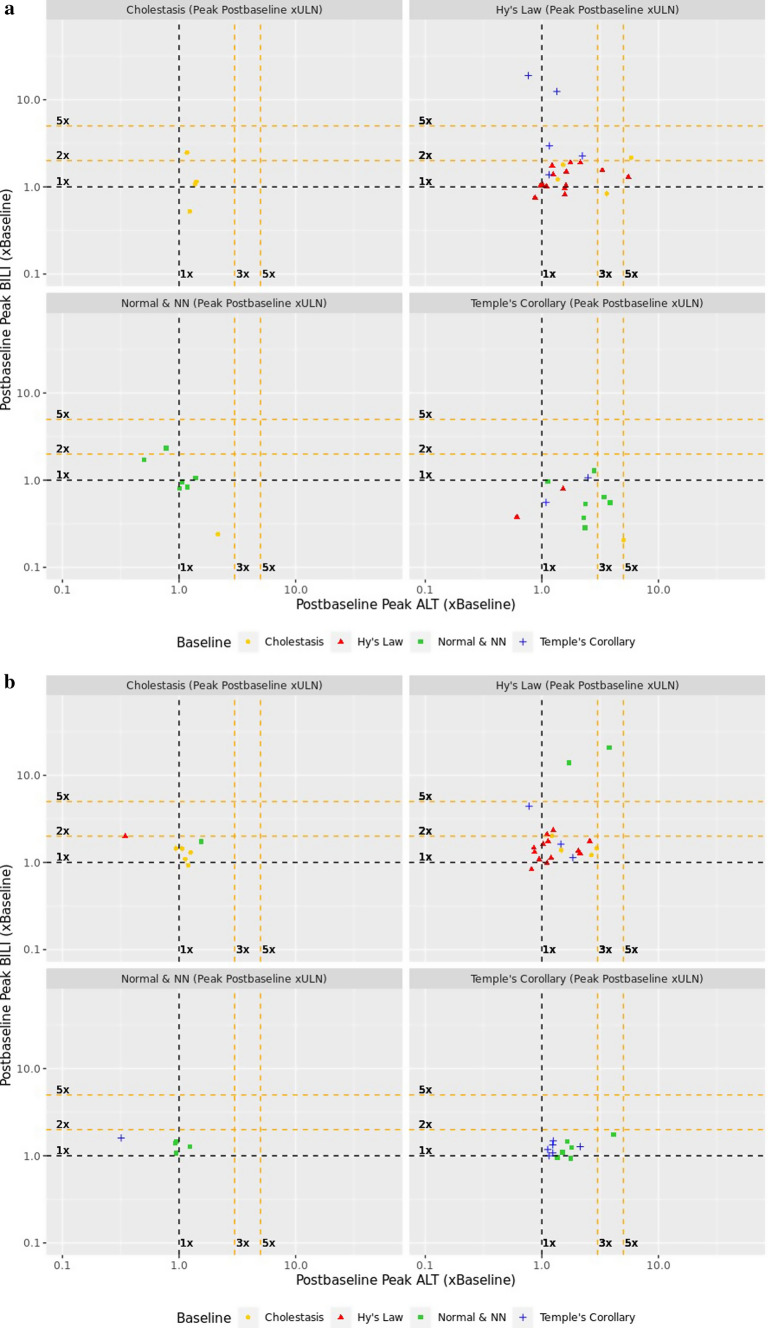
The composite plots (Fig. 5) enable tracing of subject migration for each study arm. All subjects, identified by their quadrant of origin (colored symbol), are represented in the composite BLN plots based on which quadrant they migrated to in the on-treatment eDISH plot. For example, all subjects qualifying to be in the true eDISH Hy’s Law quadrant appear in the right upper ×BLN plot of the composites for each arm. In the study drug arm (Fig. 5a), 13 of the subjects in Hy’s Law quadrant were already present at study start (red triangles) and none of them doubled their baseline BILI. Table 4 depicts all possible quadrant migrations from the composite plots by treatment arm and sums up migrations of concern for potential DILI.
Fig. 5.
Composite plots for study drug (a) and placebo (b) treated subjects in a clinical trial for chronic liver disease. ALT alanine aminotransferase, BILI total bilirubin, NN near normal, ULN upper limit of normal
Table 4.
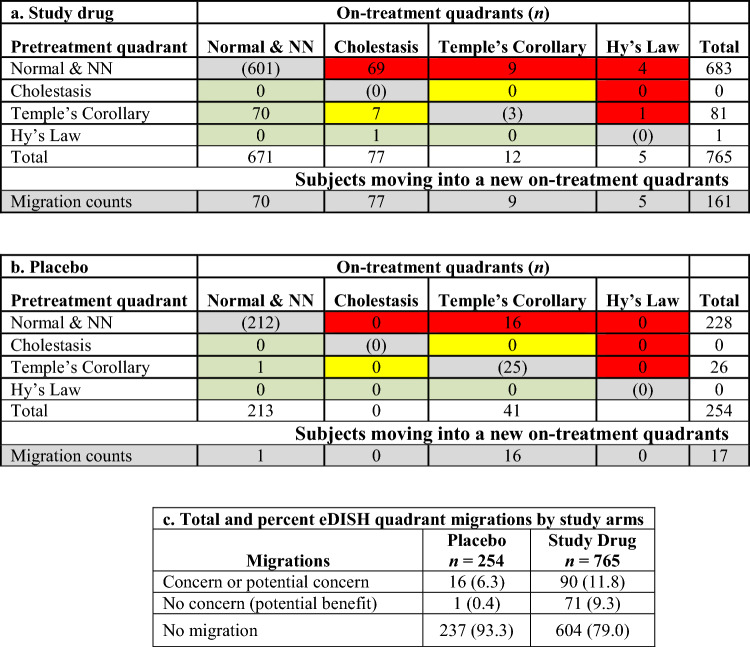
eDISH migration tables for study drug (a) and placebo (b) treated subjects in the clinical trial for chronic liver disease, and total and percent quadrant migrations (c) by study arm
Color codes: red—migration of concern; yellow—migration of potential concern; green—migration of no concern; gray—no migration
NN near normal
Quantitative comparison of migrations of concern or no concern are shown by study arm in Table 4. The number of subjects with migrations of concern or no concern are balanced between the trial arms. The subject who migrated from Cholestasis quadrant into Temple’s Corollary will need case level assessment.
Implementation in a Trial for Chronic Hepatitis C
A study that enrolled patients with chronic hepatitis C randomized non-cirrhotic adults with genotype 1 CHC but no HIV or hepatitis B co-infection to receive study drug plus ribavirin, or placebo for 12 weeks (Table 5). The majority of participants were white, non-obese, treatment-naive, with a high hepatitis C virus (HCV) RNA predictive of poor interferon (IFN) response. One-third of the subjects were injection drug users and if requiring treatment for recreational drug use, were on a stable dose of methadone for at least 6 months. Subjects were excluded if baseline ALT and AST were >5×ULN or if BILI was >2×ULN.
Table 5.
Baseline characteristics of subjects by study arm
| Characteristic | Placebo | Study drug | ||
|---|---|---|---|---|
| Treatment naïve n = 158 |
Treatment experienced n = 97 |
Treatment naïve n = 473 |
Treatment experienced n = 297 |
|
| Age (mean ± SD) | 51 ± 10 | 55 ± 8 | 49 ± 11 | 52 ± 10 |
| Male sexa | 73 (46) | 60 (62) | 271 (57) | 167 (52) |
| White race | 144 (91) | 86 (89) | 428 (91) | 86 (89) |
| BMI > 30 kg/m2 | 31 (20) | 19 (20) | 71 (15) | 59 (20) |
| Diabetes mellitus | 5 (3) | 4 (4) | 19 (4) | 14 (5) |
| HOMA IR 3 mU × mmol/L | 19 (17) | 16 (22) | 58 (16) | 56 (24) |
| Genotype 1a | 105 (66) | 57 (59) | 322 (68) | 173 (58) |
| HCV RNA > 800,000 IU/mL | 132 (82) | 88 (91) | 369 (78) | 255 (86) |
| F0–F1 fibrosis | 116 (73) | 66 (67) | 363 (77) | 202 (68) |
| Baseline ALT (IU/mL) (mean) | 64 | 65 | 68 | 64 |
Source: NDA demographic tabulation
ALT alanine aminotransferase, BMI body mass index, F0–F1 liver fibrosis stage 0–1, HCV RNA hepatitis C virus ribonucleic acid, HOMA IR homeostatic model assessment for insulin resistance, SD standard deviation
aUnless specified in the table, all values are number over column total (n) and percent (% = n/N)
Baseline liver test analytes by study arm are summarized in Table 6.
Table 6.
Baseline liver analytes (mean ± SD)
| Analytes | Placebo n = 254 |
Study drug n = 767 |
|---|---|---|
| AST (IU/L) | 50 ± 28.7 | 50 ± 27.5 |
| ALT (IU/L) | 64 ± 38.9 | 67 ± 40.6 |
| BILI (mg/L) | 10 ± 4.4 | 10 ± 4.8 |
| ALP (IU/L) | 69 ± 21.3 | 70 ± 21.4 |
ALP alkaline phosphatase, ALT alanine aminotransferase, AST aspartate aminotransferase, BILI total bilirubin, SD standard deviation
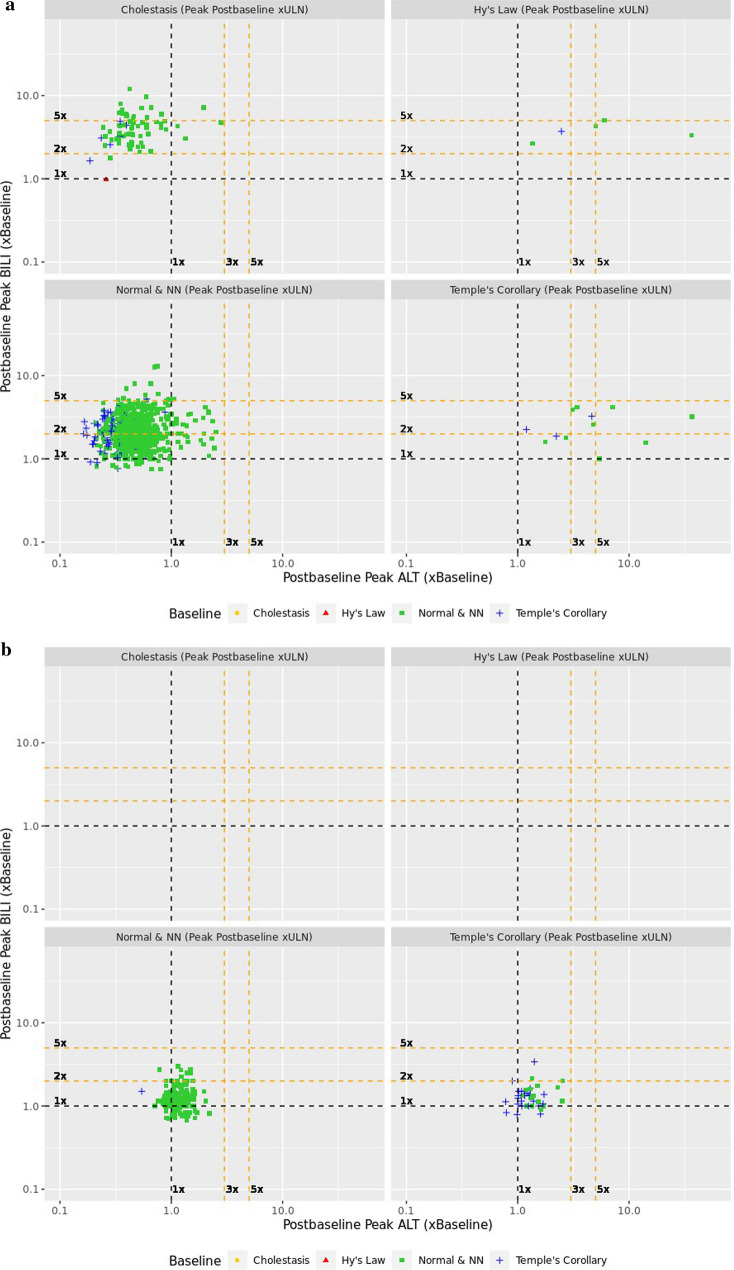
The composite plot visualization for this study is shown in Fig. 6 and the balance of migration to ×ULN and ×BLN from pretreatment (baseline) to on-treatment is shown in Table 7.
Fig. 6.
Composite plots for study drug (a) and placebo (b) treated subjects in a clinical trial for chronic hepatitis C. ALT alanine aminotransferase, BILI total bilirubin, NN near normal, ULN upper limit of normal
Table 7.
eDISH migration tables for study drug (a) and placebo (b) treated subjects in the clinical trial for chronic hepatitis C, and total and percent quadrant migrations (c) by study arm
Color codes: red—migration of concern; yellow—migration of potential concern; green—migration of no concern; gray—no migration
NN near normal
The composite plot (Fig. 6a) reveals five subjects who migrated to Hy’s Law quadrant (1 from Temple’s Corollary and 4 from Normal & NN) who require case level assessment. In addition, there was migration into the Cholestatic quadrant from the Normal & NN quadrant. These migrations of concern are balanced by the proportion of subjects who migrated from Temple’s Corollary quadrant into the Normal & NN quadrant. Migration to the quadrants of no concern (potential benefit) favored the study drug over placebo.
The ×BLN plot further describes the analyte driving the migration from one quadrant to the other. To illustrate, the subject at Hy’s quadrant pretreatment (red triangle), moved to the Cholestasis quadrant on-treatment, as their ALT fell to the left of the vertical 1×BLN plot. While the subject remains in the Cholestasis quadrant (BILI > 2xULN), the ×BLN visualization shows that their peak on-treatment BILI value did not differ from pretreatment (at the 1×BLN horizontal line for BILI).
The majority of subjects had pretreatment ALT values that were in the Normal & NN quadrant. More placebo-exposed subjects developed on-treatment elevations in ALT >1×BLN (Table 8), compared with subjects on study drug. The composite plot also shows a shift to left of the vertical 1×BLN line (ALT) for most subjects in the Normal and NN and cholestatic quadrants, indicating declines in ALT values even when baseline was near normal. Also evident is a shift above the horizontal 1×BLN line (BILI), attributed to ribavirin co-medication in the active arm. Ribavirin is known to induce hemolysis and indirect hyperbilirubinemia without liver injury [11]. The summary table indicates that effect attributable to the study drug is a possible beneficial change in ALT below the baseline value.
Table 8.
Elevations in on-treatment ALT and BILI values in reference to the individual subject’s pretreatment values (BLN) by treatment arm
| Analyte | Placebo n = 249 |
Study drug n = 748 |
RR (95% CI) |
% change |
|---|---|---|---|---|
| ALT > 1×BLN | 220 (88.4) | 51 (6.8) | 0.08 (0.06–0.10) | −81.6 |
| BILI > 1×BLN | 218 (87.6) | 732 (97.9) | 1.10 (1.00–1.10) | 10.3 |
ALT alanine aminotransferase, BILI total bilirubin, BLN baseline liver test value, CI confidence interval, RR risk ratio
Discussion
We devised a composite plot that enables rapid visualization of pretreatment and on-treatment prevalence of ALT and BILI elevations using population-derived ULN thresholds and of the magnitude of shifts from individual subject pretreatment values (×BLN). Comparison of migration in the eDISH plot across treatment arms enables identification of imbalance in harms or benefit. Similar to the quadrant migration table, the change in ×BLN can be quantitated across treatment arms. A baseline plot, however, can be misleading if it is not anchored to the threshold of risk for which the eDISH plot was developed [12]. The significance of a multiple change ×BLN would depend on the actual values of the test bound to the reference normal defined by the eDISH quadrant. These reference values may evolve with better information on the natural history of liver disease.
To streamline closer observation of these subjects as specified in FDA’s DILI Guidance for Industry [3], the composite plot can be implemented in existing analytic or visualization tools with drill-down capabilities that display the time course of all available laboratory test values (liver chemistry, albumin, fractionated bilirubin, coagulation factors, etc.) [9], adverse events, medications, vital signs, and procedures in a graphical patient profile.
DILI is challenging to assess in subjects with underlying disease, and additional data exploration is anticipated as part of the review of therapies for the treatment of liver disease [13, 14]. Moreover, elevated liver test values are increasingly reported in non-liver diseases due to the increase in metabolic syndrome and metabolic dysfunction-associated fatty liver disease (MAFLD) [15–18]. Thus, this varying signal-to-noise ratio in liver test abnormalities by disease phenotype complicates the conduct and analyses of trials in disease indications beyond that of liver disease. Moreover, undiagnosed CHC may be unrecognized, and may confound DILI assessment in trials conducted for other therapeutic conditions [19]. While collaborative consortia clarify optimal approaches to ascertain DILI in these settings [20, 21], visualization tools such as the composite plot could increase trial review efficiency in comparing the proportion of outlier data across study arms and identifying subjects for individual case assessment by consulting hepatologists. Although the plot was developed during regulatory review of applications in CHC, the tool may find application for other hepatic diseases or conditions, and in the ascertainment of dose or disease strata differences, trial-site variation, outlier and cluster analysis, and in characterizing the natural history of laboratory test abnormalities in liver disease progression. A distinct limitation of current tools is limited characterization of cholestatic injury, as neither eDISH nor the composite visualization incorporates alkaline phosphatase values in the analysis of injury. The composite plot does not filter patients with alkaline phosphatase elevations. Submission of standardized clinical trial data [22] in the full range of liver and biliary disease is needed to assess the tool’s performance across relevant demographic and disease subgroups (e.g., sex, age, cirrhosis, portal hypertension) and over the course of treatment duration. This information, along with emerging insights on the natural history and liver test variability in these settings, could further inform the tool's applicability.
Conclusion
The composite plot provides a quick assessment of the change in ALT and bilirubin in response to treatment and fills a gap in the review of clinical trials in subjects with underlying liver disease. This tool is in the beta-testing phase and its utility is being explored in the full range of patients with underlying liver disease. We are unaware of any tool in existence that enables quantitative comparison of change from baseline anchored within thresholds of established risk from liver injury as implemented in eDISH. Prediction of DILI risk based on the eDISH thresholds may be limited in subjects with abnormal baseline values from pre-existing liver disease. Until disease-specific risk thresholds are established, normalization to a subject’s pretreatment values may provide an estimation of beneficial or concerning shifts in liver analytes.
Acknowledgments
We thank Dr. Alan Shapiro for his careful review of the manuscript.
Declarations
Funding
Not applicable.
Conflict of interest
The authors have no competing interests to declare that are relevant to the content of this article.
Availability of data and materials
Not applicable.
Code availability
All code for the Composite eDISH plot (DOI 10.5281/zenodo.10892050) are available at https://github.com/FDA/Composite-eDish-Plot. The software is government data being released in the USA as public domain, and elsewhere, an MIT license applies to all code.
Consent to publish
Not applicable.
Ethics approval
Not applicable.
Consent to participate
Not applicable.
Disclaimer
The views expressed in this article are those of the authors and do not necessarily represent the policy of FDA.
Author contributions
Method conception and data collection: Bereket Tesfaldet, Tejas Patel, Eileen Navarro Almario. Analysis and interpretation of results: Bereket Tesfaldet, Tejas Patel, Eileen Navarro Almario, Minjun Chen, Frank Pucino, Paul Hayashi. Draft manuscript preparation: Bereket Tesfaldet, Eileen Navarro Almario, Paul Hayashi, Minjun Chen, Frank Pucino, Tejas Patel, Lilliam Rosario. All authors reviewed the results and approved the final version of the manuscript.
References
- 1.US FDA. Chronic hepatitis C virus infection: developing direct-acting antiviral drugs for treatment guidance for industry. 2017. [Online]. Available: https://www.fda.gov/regulatory-information/search-fda-guidance-documents/chronic-hepatitis-c-virus-infection-developing-direct-acting-antiviral-drugs-treatment-guidance. Accessed 15 June 2023.
- 2.US FDA. Chronic hepatitis B virus infection: developing drugs for treatment guidance for industry. 2022. [Online]. Available: https://www.fda.gov/regulatory-information/search-fda-guidance-documents/chronic-hepatitis-b-virus-infection-developing-drugs-treatment. Accessed 15 June 2023.
- 3.US FDA. Drug-induced liver injury: premarketing clinical evaluation. 2009. [Online]. Available: https://www.fda.gov/regulatory-information/search-fda-guidance-documents/drug-induced-liver-injury-premarketing-clinical-evaluation. Accessed 15 June 2023.
- 4.Temple R. Hy's law: predicting serious hepatotoxicity. Pharmacoepidemiol Drug Saf. 2006;15(4):241–243. doi: 10.1002/pds.1211. [DOI] [PubMed] [Google Scholar]
- 5.Treem WR, Palmer M, Lonjon-Domanec I, Seekins D, Dimick-Santos L, Avigan MI, Marcinak JF, Dash A, Regev A, Maller E, Patwardhan M, Lewis JH, Rockey DC, Di Bisceglie AM, Freston Consensus guidelines: best practices for detection, assessment and management of suspected acute drug-induced liver injury during clinical trials in adults with chronic viral hepatitis and adults with cirrhosis secondary to hepatitis B, C and nonalcoholic. Drug Saf. 2021;44(2):133–165. doi: 10.1007/s40264-020-01014-2. [DOI] [PMC free article] [PubMed] [Google Scholar]
- 6.Kullak-Ublick GA, Merz M, Griffel L, Kaplowitz N, Watkins PB. Liver safety assessment in special populations (hepatitis B, C, and oncology trials) Drug Saf. 2014;37(Suppl):57–62. doi: 10.1007/s40264-014-0186-3. [DOI] [PMC free article] [PubMed] [Google Scholar]
- 7.Senior J, Guo T. Hy’s law and eDISH for clinical studies. In: Chen M, Will Y, editors. Drug-induced liver toxicity. New York, NY: Springer; 2018. p. 411–429.
- 8.Guo T, Senior J, Gelperin K. How a SAS/IntrNet tool was created at the FDA for the detection of potential druginduced liver injury using data with CDISC standard. In: Proceedings of the Western Users of SAS Software Annual Conference, San Diego, California, 2009.
- 9.Senior J. Evolution of the food and drug administration approach to liver safety assessment for new drugs: current status and challenges. Drug Saf. 2014;37(Suppl 1):9–17. doi: 10.1007/s40264-014-0182-7. [DOI] [PMC free article] [PubMed] [Google Scholar]
- 10.Watkins PB, Desai M, Berkowitz SD, Peters G, Horsmans Y, Larrey D, Maddrey W. Evaluation of drug-induced serious hepatotoxicity (eDISH): application of this data organization approach to phase III clinical trials of rivaroxaban after total hip or knee replacement surgery. Drug-Saf. 2011;34(3):243–252. doi: 10.2165/11586600-000000000-00000. [DOI] [PubMed] [Google Scholar]
- 11.US FDA. https://www.accessdata.fda.gov. 01 03 2022. [Online]. Available: https://www.accessdata.fda.gov/drugsatfda_docs/label/2022/020903s057,021546s013lbl.pdf. Accessed 22 Jan 2024.
- 12.Merz M, Lee KR, Kullak-Ublick GA, Brueckner A, Watkins PB. Methodology to assess clinical liver safety data. Drug Saf. 2014;37(Suppl 1):33–45. doi: 10.1007/s40264-014-0184-5. [DOI] [PMC free article] [PubMed] [Google Scholar]
- 13.Lin X, Parks D, Painter J, Hunt C, Stirnadel-Farrant H, Cheng J, Menius A, Lee K. Validation of multivariate outlier detection analyses used to identify potential drug-induced liver injury in clinical trial populations. Drug Saf. 2012;35:865–875. doi: 10.1007/BF03261982. [DOI] [PubMed] [Google Scholar]
- 14.Parks D, Lin X, Painter J, Cheng J, Hunt C, Spraggs C, Nelson J, Curtis L, Menius A, Lee K. A proposed modification to Hy's law and Edish criteria in oncology clinical trials using aggregated historical data. Pharmacoepidemiol Drug Saf. 2013;22:571–578. doi: 10.1002/pds.3405. [DOI] [PubMed] [Google Scholar]
- 15.Rigatti S, Stout R. Association of liver function tests with mortality in an insurance applicant population. J Insur Med. 2022;49:172–182. doi: 10.17849/insm-49-3-172-182.1. [DOI] [PubMed] [Google Scholar]
- 16.Keerl C, Bernsmeier C. Erhöhte Leberwerte – Zufallsbefund in der Hausarztpraxis [Elevated liver function tests—as incidental finding in general practice] Therapeutische Umschau. Revue therapeutique. 2020;77:371–378. doi: 10.1024/0040-5930/a001206. [DOI] [PubMed] [Google Scholar]
- 17.Ioannou G, Boyko E, Lee S. The prevalence and predictors of elevated serum aminotransferase activity in the United States in 1999–2002. Am J Gastroenterol. 2006;101:76–82. doi: 10.1111/j.1572-0241.2005.00341.x. [DOI] [PubMed] [Google Scholar]
- 18.Cai Z, Christianson A, Ståhle L, Keisu M. Reexamining transaminase elevation in phase I clinical trials: the importance of baseline and change from baseline. Eur J Clin Pharmacol. 2009;65:1025–1035. doi: 10.1007/s00228-009-0684-x. [DOI] [PubMed] [Google Scholar]
- 19.Ahmad J, Reddy R, Tillmann H, Hayashi P, Chalasani N, Fontana R, Navarro V, Stolz A, Barnhart H, Cloherty G, Hoofnagle J. Importance of hepatitis C virus RNA testing in patients with suspected drug-induced liver injury. Digest Dis Sci. 2019;64:2645–2652. doi: 10.1007/s10620-019-05591-w. [DOI] [PMC free article] [PubMed] [Google Scholar]
- 20.Avigan M, Björnsson E, Pasanen M, Cooper C, Andrade R, Watkins P, Lewis J, Merz M. Liver safety assessment: required data elements and best practices for data collection and standardization in clinical trials. Drug Saf. 2014;37(Suppl 1):19–31. doi: 10.1007/s40264-014-0183-6. [DOI] [PMC free article] [PubMed] [Google Scholar]
- 21.Watkins PB. The DILI-sim initiative: insights into hepatotoxicity mechanisms and biomarker interpretation. Clin Transl Sci. 2019;12(2):122–129. doi: 10.1111/cts.12629. [DOI] [PMC free article] [PubMed] [Google Scholar]
- 22.US FDA. Providing regulatory submissions in electronic format—standardized study data. 2014. [Online]. Available: https://www.fda.gov/regulatory-information/search-fda-guidance-documents/providing-regulatory-submissions-electronic-format-standardized-study-data. Accessed 15 Jun 2023.
Associated Data
This section collects any data citations, data availability statements, or supplementary materials included in this article.
Data Availability Statement
Not applicable.


