

Abstract
Little is known about food insecurity and the extent of Supplemental Nutrition Assistance Program (SNAP) participation in the heterogeneous Asian American population. Using California Health Interview Survey data from the period 2011–20, we examined both issues among low-income Asian American adults from six origin groups: Chinese, Filipino, Japanese, Korean, South Asian, and Vietnamese. We found high and varied levels of overall food insecurity, with the highest burden among Filipino adults (40 percent). Food insecurity by severity was also heterogenous; very low food security affected 2 percent of Chinese adults but 9 percent and 10 percent of Filipino and Japanese adults, respectively. Participation in CalFresh (California-implemented SNAP) ranged from 11 percent and 12 percent among Korean and Chinese adults, respectively, to 20 percent among Vietnamese adults. Compared with English-proficient low-income Asian American adults, those with limited English proficiency were no less likely to participate in CalFresh, possibly reflecting language assistance required by California law and provided by community-based organizations. These results underscore the importance of collecting and reporting disaggregated data by Asian origin group that could inform targeted outreach and interventions.
Food security, or consistent, dependable access to enough food for an active, healthy life,1 is a critical determinant of health.2–4 Participation in US nutrition assistance programs (for example, the Supplemental Nutrition Assistance Program, or SNAP) alleviates food insecurity.5–7 However, many eligible individuals and households are not enrolled: SNAP participation among eligible populations was estimated to be 78 percent nationwide during the period October 2019–February 2020.8 In the US, there are racial and ethnic disparities in food insecurity; for example, non-Hispanic Black and Hispanic or Latino households experience higher food insecurity (19.8 percent and 16.2 percent, respectively) compared with non-Hispanic White households (7.0 percent).1 Emerging research has documented the experiences of nutrition assistance programs for food insecurity among Black, Hispanic or Latino, and American Indian and Alaska Native populations.9,10 However, much less is known about these experiences among Asian Americans.
The evidence gaps are partly due to the “model minority” stereotype, which portrays Asian Americans as a homogenous group experiencing high socioeconomic success and little structural racism or disadvantages11–13 and, as a consequence, no or little food insecurity. The COVID-19 pandemic shed light on the inaccuracy of such assumptions,14 given the thousands of reports in the US of anti-Asian stigma and violence15 and recent studies suggesting that Asian Americans experience food acquisition difficulties because of their fear of being racially targeted.16,17 Common approaches to data categorization have hampered the ability to explore food insecurity and program enrollment among Asian Americans.11,14,18 The limited literature presents aggregated statistics for Asian Americans instead of providing data by origin group (for example, Vietnamese, Chinese, and Korean).19,20 However, Asian Americans are a heterogeneous population with diverse origins, languages, socioeconomic status, religious and cultural practices, immigration histories, and patterns of service use.21–24 Importantly, different Asian American groups have been found to have varying levels of English proficiency.25,26 English proficiency has been linked to both food insecurity and SNAP enrollment in immigrant and refugee populations.27–32 Those with limited English proficiency may face challenges in understanding eligibility and recertification requirements and navigating SNAP application processes. For all of these reasons, the use of aggregated data across all Asian origin groups to assess food insecurity and SNAP participation may mask important between-group differences.11,33
Data disaggregation can identify which Asian origin group or groups face the highest burden of food insecurity or challenges in SNAP participation. Most population-based surveys on these topics (for example, the National Health and Nutrition Examination Survey) use only English or Spanish questionnaires and do not sample enough Asian Americans from different groups to enable meaningful analyses. However, the California Health Interview Survey (CHIS) is an exception. It surveys people in the state that has the largest population of Asian Americans: Around one-third of Asian Americans live in California.34,35 CHIS is also conducted in multiple Asian languages and reaches Asian Americans with limited English proficiency.36 Moreover, it reaches samples of Asian Americans from different origin groups that are large enough for analysis.36
To our knowledge, only one previous study has used CHIS to explore food insecurity by Asian origin group. That study found that Vietnamese adults experienced higher food insecurity (16 percent) compared with adults in other Asian American origin groups (less than 9 percent for Chinese, Filipino, Japanese, Korean, and South Asian populations).33 However, it used data from ten to twenty years ago, and it did not present either disaggregated SNAP participation rates or comparisons with other racial and ethnic groups (for example, Hispanic or Latino), thus limiting its timeliness and potential to inform current policy.
Using CHIS data from the period 2011–20, we examined the prevalence of food insecurity and participation in CalFresh, the California-implemented SNAP that is state supervised and county operated. We focused on low-income Asian Americans from six origin groups: Chinese, Filipino, Japanese, Korean, South Asian, and Vietnamese. These groups are the largest Asian American groups according to census data.25 Furthermore, we explored the associations between limited English proficiency and CalFresh participation and assessed whether such associations varied by origin group. The insights gained can help inform—and potentially enhance—program outreach and intervention efforts.
Study Data And Methods
We used a serial cross-sectional design that pooled data from five consecutive waves of the adult CHIS conducted during 2011–20.
SAMPLE AND DATA
CHIS is a population-based survey of California’s residential, noninstitutionalized population.36 It is the nation’s largest state-level health survey. Each iteration or wave covers two years and collects data from a total of approximately 40,000 adult respondents. Data are collected continuously, with approximately half of the interviews conducted in one calendar year and half in the next calendar year.36 The survey has been conducted in English, Spanish, Chinese, Korean, and Vietnamese since 2011 and in Tagalog since 2013.36 To our knowledge, no law requires assistance for CHIS interviews in languages other than those listed above. To ensure the representativeness of its data for racial and ethnic groups (including major Asian origin groups), CHIS employs an address-based sample design and divides counties into geographic sampling strata and substrata for probability sampling. Population weights are applied to produce accurate population estimates and totals.36
FOOD INSECURITY AND CALFRESH PARTICIPATION
For respondents with household incomes less than 200 percent of the federal poverty level, CHIS administers the Department of Agriculture’s (USDA’s) six-item Household Food Security Survey Module to assess food security levels.37 Those with zero to one affirmative responses to the six questions are categorized as food secure, whereas those with two or more affirmative responses are categorized as food insecure, with either low food security (two to four affirmative responses) or very low food security (five to six affirmative responses).37
CHIS measures CalFresh participation using the question, “Are you receiving Food Stamp benefits, also known as CalFresh?” Most CalFresh-receiving households are subject to a gross household income determination test, with the maximum gross household income allowed being 200 percent of poverty.38 From 2011 to 2018 CHIS assessed CalFresh participation among only those respondents indicating a household income of 300 percent of poverty or less. During the 2019–20 cycle, the CHIS threshold for assessing CalFresh participation was lowered to a household income of 200 percent of poverty or less. To ensure comparability across CHIS cycles and with the CalFresh eligibility requirement, we restricted CalFresh-related analyses to respondents with a household income of 200 percent of poverty or less for the entire study period. To align with the design of CHIS, respondents with a household income exactly at 200 percent of poverty (n = 585 unweighted, 73,701 weighted; 0.25 percent of study sample) were included in our analysis of CalFresh participation but not our analysis of food insecurity.
RACE AND ETHNICITY
Respondents were asked whether they described themselves as one or more of the following races: American Indian or Alaska Native, Asian, Black or African American, Native Hawaiian, other Pacific Islander, or White. They were also asked whether they identified as Hispanic or Latino. Respondents self-identifying as Asian were further asked to indicate their specific origin group or groups, with a list of seventeen possible choices and an option to specify other groups not on the list.
For our analysis, we categorized non-Hispanic or Latino Asian respondents from the six largest origin groups as Chinese, Filipino, Japanese, Korean, South Asian (defined by CHIS as being Bangladeshi, Indian, Nepalese, Pakistani, or Sri Lankan), or Vietnamese. Other racial and ethnic groups of CHIS respondents included in our analyses, for purposes of comparison, were African American, Hispanic or Latino, and White. (In this article, all racial groups are non-Hispanic unless otherwise specified.) Those identifying as Asian but who did not belong to one of the largest six origin groups, or who chose more than one Asian origin group, were categorized as “other Asian or multiple Asian origin groups.”
ENGLISH PROFICIENCY
CHIS asked respondents, “What languages do you speak at home?” Those who chose languages in addition to or other than English were asked, “Would you say you speak English…?” and given response options of “very well,” “well,” “not well,” or “not at all.” Based on responses to these questions, we categorized respondents as indicating that they either had limited English proficiency (that is, spoke English not well or not at all) or were English proficient (that is, spoke only English or spoke English very well or well).
SOCIODEMOGRAPHIC COVARIATES
Covariates measured by CHIS and included in our analysis were age, sex, education, employment status, family type, family size, household income (as percent of poverty), and citizenship status. All of these covariates have been linked to SNAP participation in previous research.39–42
STATISTICAL ANALYSES
We pooled 2011–20 data using a CHIS-provided SAS macro. We conducted all subsequent analyses in R. We conducted descriptive analyses to understand unadjusted rates of food insecurity and CalFresh participation by race and ethnicity. We used two-sample t-tests to compare unadjusted rates among racial and ethnic groups. We conducted bivariate logistic regressions to explore the relationships between CalFresh participation and race and ethnicity, English proficiency, and other covariates. To investigate whether limited English proficiency hinders CalFresh participation and whether this issue differentially affects Asian origin groups, we conducted multivariate logistic regressions with CalFresh participation as the outcome and included race and ethnicity, limited English proficiency, and the interaction term between the two (controlling for sociodemographic covariates). All analyses used replicate weights provided by CHIS.43 We calculated predicted probabilities of CalFresh participation by English proficiency and Asian origin groups from regression results.44 Because of COVID-19, the CalFresh program issued certain waivers for eligibility verification and benefits recertification interviews45 and increased regular CalFresh benefit amounts and expanded eligibility criteria for students.46 As these changes could have affected our results, we conducted a sensitivity analysis restricting our data to the survey cycles collected before the pandemic (2011–18). The cutoff for statistical significance was set at p < 0.05.
LIMITATIONS
We acknowledge several limitations. First, self-reported data were used for CalFresh participation, which can be subject to multiple biases. Second, the generalizability of our findings may be limited, given multiple CHIS data constraints. CHIS assessed food security status among only those with household incomes less than 200 percent of poverty, even though a third of US food-insecure households have incomes above 200 percent of poverty.47 CHIS included only California respondents, which may limit generalizability to other states or settings. Third, CHIS does not allow for disaggregation of the category “South Asian.” It is not available in Japanese or any South Asian languages, limiting the participation of those who could participate in surveys in these languages but not English. Finally, CHIS data are cross-sectional; therefore, the statistically significant associations we report do not necessarily imply cause-effect relationships.
Study Results
Race and ethnicity, English proficiency, and other sociodemographic characteristics of respondents with household incomes of 200 percent of poverty or less, overall and by CalFresh participation, are described in exhibit 1 and online appendix A.48 This information is further described for Asian origin groups and other racial and ethnic groups in appendix B.48 Numbers of respondents in the full analytical sample, in each two-year CHIS cycle, and in each racial and ethnic group (unweighted and weighted) are in appendixes C and D.48
EXHIBIT 1.
Low-Income California Health Interview Survey respondents, by characteristics and CalFresh participation, 2011–20
| Characteristics | Total | Not participating in CalFresh | Participating in CalFresh | Unadjusted bivariate odds of CalFresh participation |
|---|---|---|---|---|
| Race and ethnicity (%) | ||||
| Asian origin groups | ||||
| Chinese | 3.5 | 3.8 | 2.1 | 0.54**** |
| Filipino | 2.8 | 2.9 | 2.0 | 0.68** |
| Japanese | 0.4 | 0.4 | 0.3 | 0.74 |
| Korean | 1.3 | 1.4 | 0.7 | 0.49*** |
| South Asian | 1.0 | 1.1 | 0.7 | 0.63** |
| Vietnamese | 2.5 | 2.5 | 2.4 | 0.94 |
| Other Asian or multiple Asian origin groupsa | 1.3 | 1.3 | 1.3 | 1.00 |
| African American or Black | 6.3 | 5.5 | 9.1 | 1.60**** |
| Hispanic or Latino | 55.8 | 55.5 | 56.9 | Ref |
| White | 22.8 | 23.1 | 21.3 | 0.90** |
| Otherb | 2.4 | 2.3 | 3.0 | 1.29 |
| English proficiency (%) | ||||
| Limited English proficiency (speak English not well or not at all) | 30.8 | 30.9 | 30.1 | Ref |
| English proficient (speak only English, speak English well or very well) | 69.2 | 69.1 | 69.9 | 1.04 |
| Age, years (%) | ||||
| 18–34 | 36.0 | 34.8 | 40.9 | Ref |
| 35–49 | 26.1 | 24.6 | 32.2 | 1.11** |
| 50–64 | 21.3 | 22.2 | 17.8 | 0.68**** |
| 65+ | 16.6 | 18.4 | 9.1 | 0.42**** |
| Sex (%) | ||||
| Male | 44.3 | 46.3 | 36.7 | Ref |
| Female | 55.7 | 53.7 | 63.3 | 1.49**** |
| Education (%) | ||||
| Less than a bachelor’s degree | 85.4 | 84.1 | 90.5 | Ref |
| Bachelor’s degree or higher | 14.6 | 15.9 | 9.5 | 0.56**** |
| Employment status (%) | ||||
| Unemployed | 47.3 | 44.8 | 57.2 | Ref |
| Employed (full or part time) | 52.7 | 55.2 | 42.8 | 0.61**** |
| Family type (%) | ||||
| Without children | 87.2 | 88.4 | 82.2 | Ref |
| With children | 12.8 | 11.6 | 17.8 | 1.65**** |
| Mean family size (no.) | 3.76 | 3.70 | 4.02 | 1.08**** |
| Mean household income (% of FPL) | 105 | 111 | 80 | 0.34**** |
| Citizenship status (%) | ||||
| Noncitizen | 28.0 | 28.0 | 28.2 | Ref |
| Citizen | 72.0 | 72.0 | 71.8 | 0.99 |
SOURCE Authors’ analyses of pooled 2011–20 California Health Interview Survey data. NOTES Reference values are 1.00. Unweighted sample sizes were Chinese: 1,936; Filipino: 916; Japanese: 352; Korean: 1,128; South Asian: 409; Vietnamese: 1,730; African American or Black: 3,812; Hispanic or Latino: 24,031; and White: 25,862. Data for this exhibit include those with household incomes of 200 percent or less of the federal poverty level (FPL). All Asian origin and other racial categories are non-Hispanic or Latino. Family size and income are treated as continuous variables in logistic regressions. For race and ethnicity in logistic regressions, Hispanic or Latino respondents were chosen as the reference group, given the small proportion of African American or White respondents identifying as having limited English proficiency.
Includes Burmese, Cambodian, Hmong, Indonesian, Laotian, Malaysian, Taiwanese, Thai, other Asian Americans not listed here or in the major six origin groups, and those indicating that they identify with 2 or more Asian origin groups.
Includes American Indian/Alaska Native, Native Hawaiian/Pacific Islander, other race (one race), and other race (multiple races).
p < 0.05
p < 0.01
p < 0.001
FOOD INSECURITY
Among Asian American respondents with household incomes less than 200 percent of poverty, food insecurity rates were 26.7 percent for Chinese respondents, 39.5 percent for Filipino respondents, 26.5 percent for Japanese respondents, 25.0 percent for Korean respondents, 26.5 percent for South Asian respondents, and 28.9 percent for Vietnamese respondents (exhibit 2). Except for Filipino respondents, all Asian origin groups had a significantly lower prevalence of food insecurity compared with Hispanic or Latino (43.6 percent) and White (38.7 percent) respondents. All Asian origin groups had a significantly lower prevalence of food insecurity when compared with African American or Black (49.1 percent) respondents. The severity of food insecurity across Asian origin groups was heterogenous; for example, one in fifty Chinese respondents experienced very low food security, compared with one in sixteen Vietnamese, one in eleven Filipino, and one in ten Japanese respondents.
EXHIBIT 2.
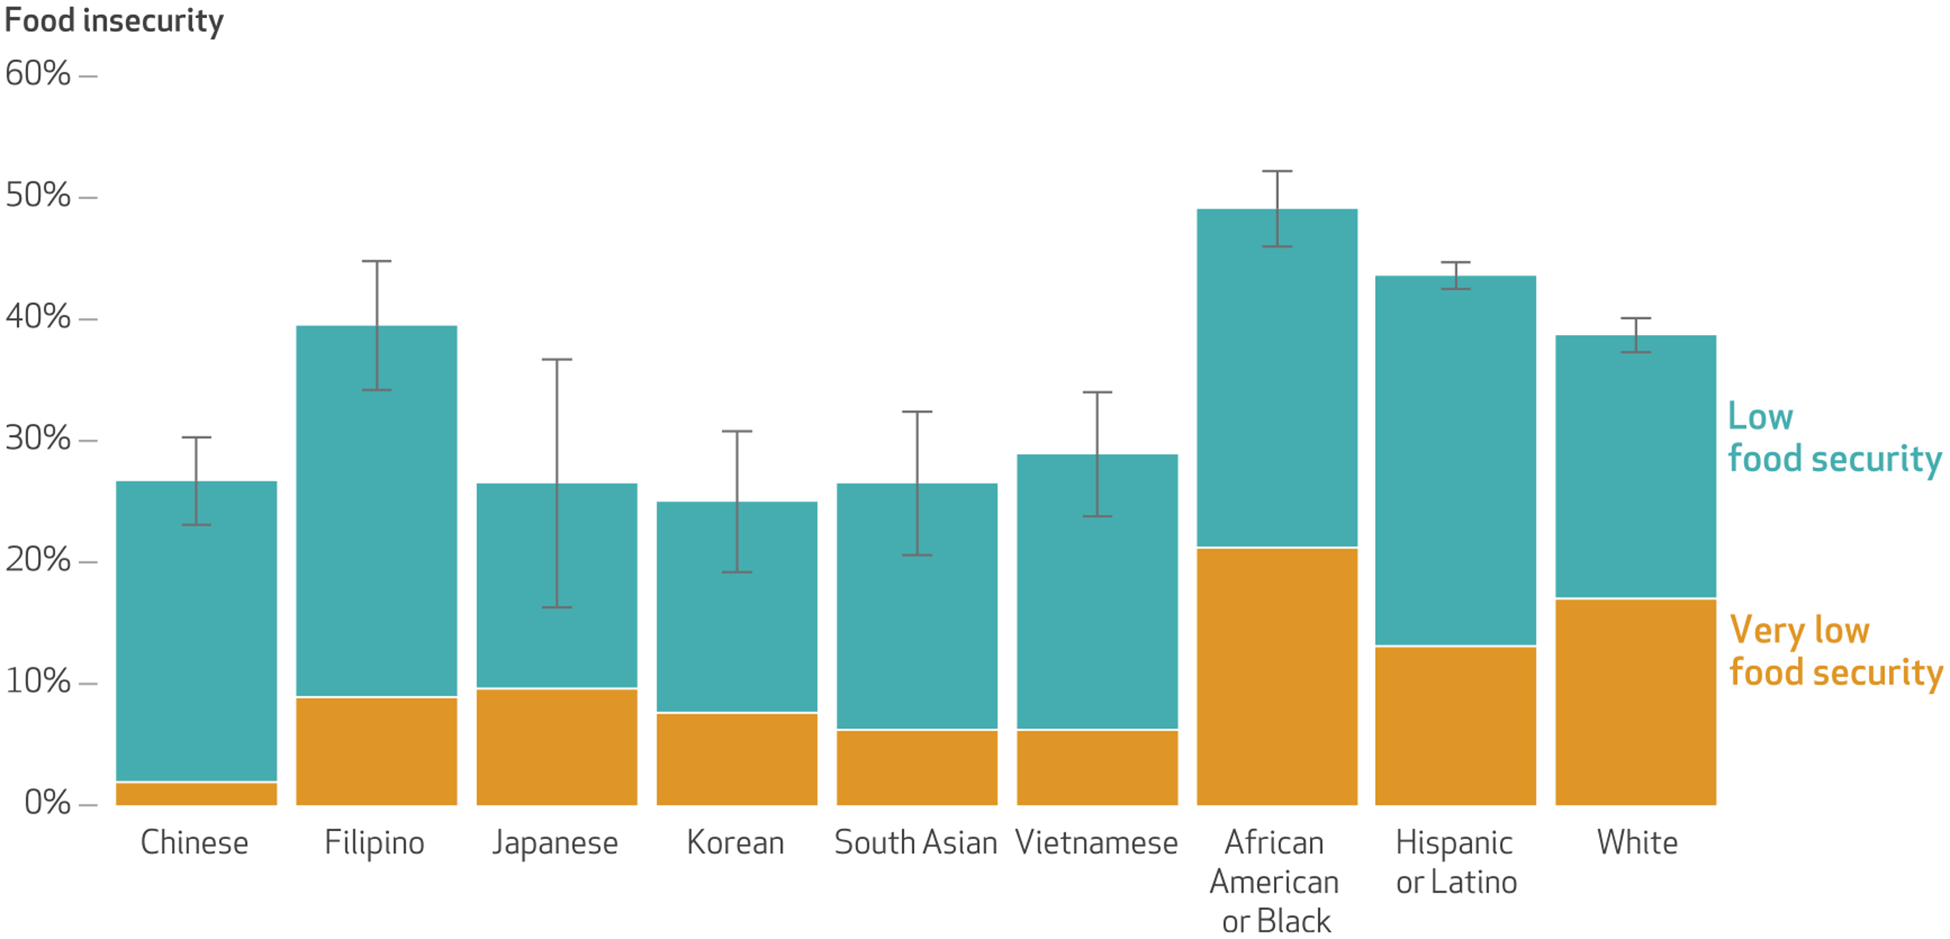
Prevalence and level of food insecurity among low-income California Health Interview Survey respondents, by Asian origin group and other racial and ethnic group, 2011–20
SOURCE Authors’ analyses of pooled 2011–20 California Health Interview Survey data. NOTES Sample sizes are in the exhibit 1 notes. Data for this exhibit include those with household incomes of less than 200 percent of the federal poverty level. The California Health Interview Survey did not assess food security status among the entire sample; rather, it asked only respondents with household income less than 200 percent of poverty about their food security status. Food insecurity among respondents with household income less than 200 percent of poverty was calculated by dividing the number of respondents who were asked about food security status and indicated food insecurity (low or very low food security) by the number of respondents who were asked about food security status. The error bars indicate 95% confidence intervals. The sum of respondents indicating low food security and respondents indicating very low food security is equal to the total of those indicating food insecurity. All Asian origin groups had significantly lower food insecurity prevalence compared with African American or Black respondents (p < 0.05). Except for Filipino respondents, all Asian origin groups had significantly lower food insecurity prevalence compared with Hispanic or Latino and White respondents (p < 0.05). The heterogeneity of the two “other” racial and ethnic groups precluded meaningful interpretation; for completeness, data for these two groups were included in exhibit 1 but not exhibits 2–4.
CALFRESH PARTICIPATION
Among Asian American respondents with household income of 200 percent of poverty or less, CalFresh participation rates were 12.2 percent among Chinese respondents, 14.9 percent among Filipino respondents, 16.0 percent among Japanese respondents, 11.2 percent among Korean respondents, 14.0 percent among South Asian respondents, and 19.5 percent among Vietnamese respondents (exhibit 3). All Asian origin groups had significantly lower CalFresh participation compared with that of African American or Black respondents (29.2 percent). Chinese, Korean, and South Asian respondents had significantly lower CalFresh participation compared with Hispanic or Latino (20.5 percent) and White (18.8 percent) respondents. Even among the subsample of low-income respondents who indicated food insecurity, CalFresh participation among most Asian origin groups was still lower than that indicated by African American or Black, Hispanic or Latino, and White respondents (appendix E).48
EXHIBIT 3.
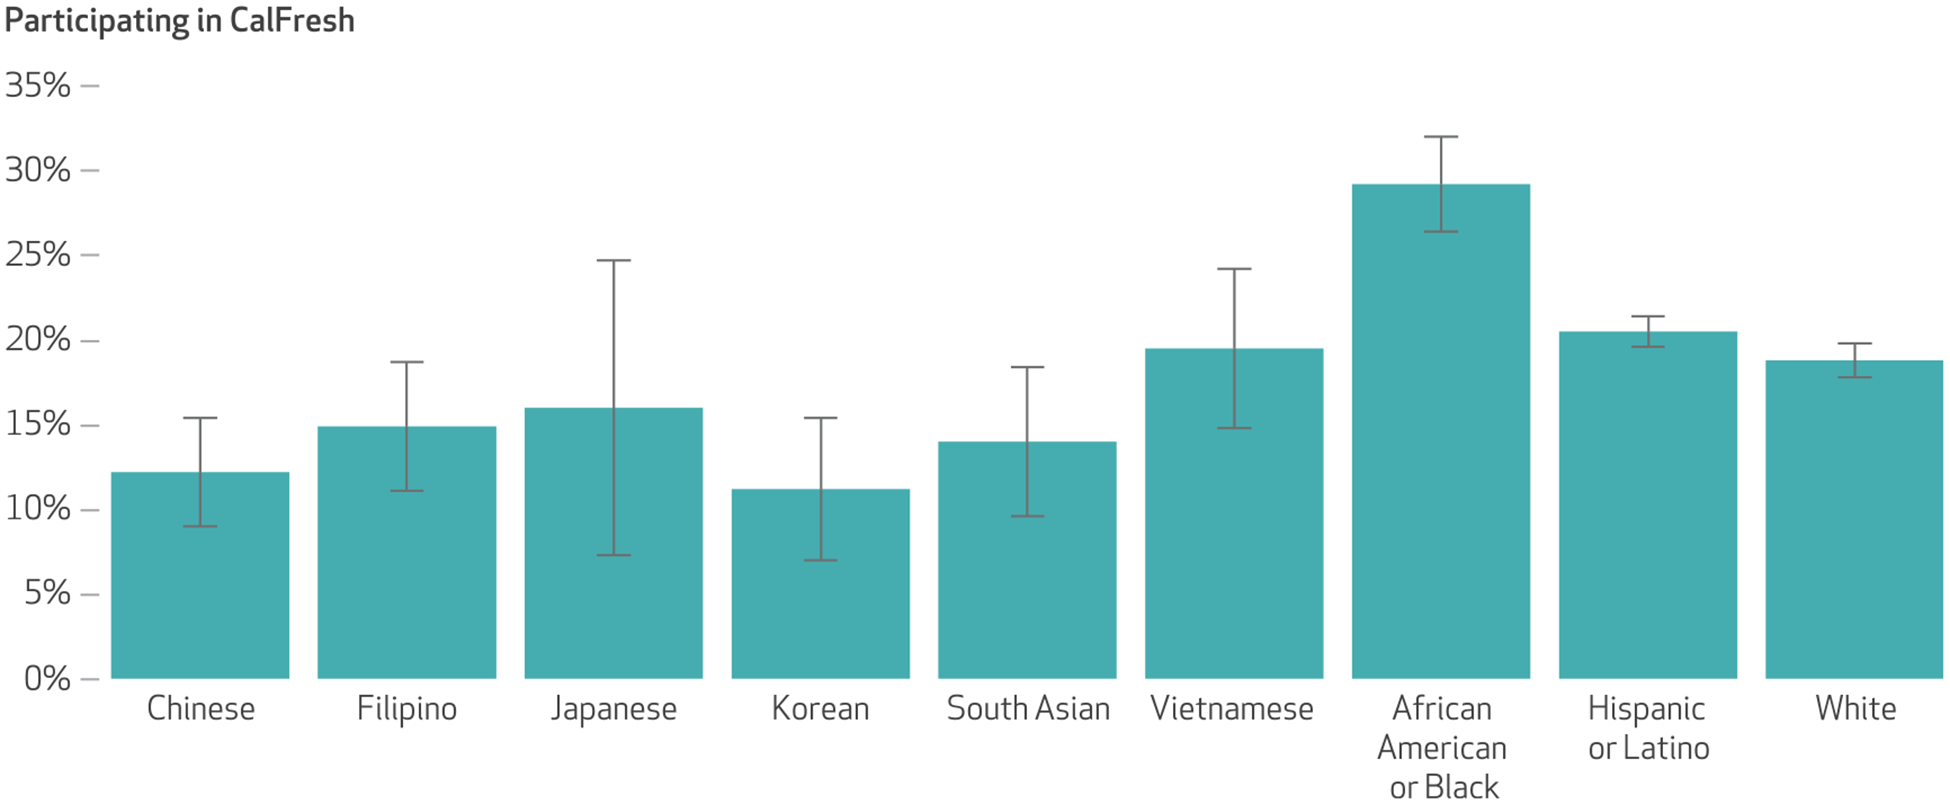
CalFresh participation among low-income California Health Interview Survey respondents, by Asian origin group and other racial and ethnic group, 2011–20
SOURCE Authors’ analyses of pooled 2011–20 California Health Interview Survey data. NOTES Sample sizes are in the exhibit 1 notes. Data for this exhibit include those with household incomes of 200 percent or less of the federal poverty level. Most CalFresh-receiving households are subject to a gross income determination test, with the maximum gross allowed being 200 percent of poverty. For each group, the prevalence of CalFresh participation was calculated by dividing the number of respondents who had household income at or below 200 percent of poverty, were asked about CalFresh participation, and indicated CalFresh participation by the number of respondents who had household income at or below 200 percent of poverty and were asked about CalFresh participation. The error bars indicate 95% confidence intervals. All Asian origin groups had significantly lower CalFresh participation compared with African American or Black respondents. Chinese, Korean, and South Asian respondents had significantly lower CalFresh participation compared with Hispanic or Latino and White respondents (p < 0.05).
PARTICIPATION BY ENGLISH PROFICIENCY AND RACE AND ETHNICITY
In unadjusted descriptive analyses involving Chinese, Filipino, Korean, South Asian, and Vietnamese respondents, respondents with limited English proficiency had higher CalFresh participation rates than English-proficient respondents. The magnitude of those differences varied considerably across Asian origin groups. For example, Chinese respondents with limited English proficiency participated at more than twice the rate of English-proficient Chinese respondents (15.9 percent versus 7.6 percent, respectively), whereas the difference among Vietnamese respondents with limited English proficiency and those who were proficient in English was much smaller (20.3 percent versus 18.0 percent, respectively). This pattern of higher CalFresh participation among respondents with limited English proficiency, however, did not hold for Hispanic and Latino respondents (appendix F).48
Multivariable regressions controlling for other sociodemographic variables (model 1, appendix G)48 showed that Chinese respondents had significantly lower odds of CalFresh participation compared with Hispanic or Latino respondents (adjusted odds ratio: 0.65; 95% confidence interval: 0.48, 0.89). No significant difference was found for other Asian origin groups. We also did not find a significant relationship between English proficiency and CalFresh participation overall.
To explore whether the relationship between English proficiency and CalFresh participation was stronger for certain Asian origin groups than others, we further interacted English proficiency with race and ethnicity (model 2, appendix G).48 In multivariable models stratified by English proficiency, among English-proficient respondents only, Chinese (aOR: 0.36; 95% CI: 0.25, 0.52) and Korean (aOR: 0.36; 95% CI: 0.19, 0.69) respondents had significantly lower odds of CalFresh participation compared with Hispanic or Latino respondents (exhibit 4 and appendix H).48 In models stratified by race and ethnicity, English-proficient respondents from all Asian origin groups had lower odds of CalFresh participation compared to respondents with limited English proficiency from the same origin group, but these differences did not reach statistical significance (appendix I).48
EXHIBIT 4.
Adjusted odds ratios of CalFresh participation among low-income Hispanic or Latino and selected Asian American California Health Interview Survey respondents, stratified by English proficiency, 2011–20
| CalFresh participation (odds ratios) | ||
|---|---|---|
| Limited English proficiency | English proficient | |
| Hispanic or Latino | Ref | Ref |
| Asian origin groups | ||
| Chinese | 0.98 | 0.36**** |
| Filipino | 1.45 | 0.87 |
| Korean | 1.15 | 0.36*** |
| South Asian | 1.58 | 0.65 |
| Vietnamese | 1.37 | 0.92 |
SOURCE Authors’ analyses of pooled 2011–20 California Health Interview Survey data. NOTES Reference values are 1.00. Respondents with limited English proficiency indicated that they speak English not well or not at all. English-proficient respondents indicated that they speak only English, speak English well, or speak English very well. Models were controlled for age, sex, education, employment status, family type, family size, income, and citizenship status. We did not include separate data for Japanese, African American or Black, and White respondents because of the very low proportions indicating both limited English proficiency and CalFresh participation in each of these groups.
p < 0.01
p < 0.001
Differences in the predicted probabilities of CalFresh participation (appendix J)48 further illustrated the differences in CalFresh participation by Asian origin group and English proficiency. Among English-proficient respondents, Korean respondents had the lowest (8.6 percent) and Vietnamese respondents had the highest (20.2 percent) probability of CalFresh participation. However, among respondents with limited English proficiency, Chinese respondents had the lowest (20.7 percent) and Filipino respondents had the highest (28.3 percent) probability of CalFresh participation.
In our sensitivity analysis, restricting our data to the survey cycles collected before the COVID-19 pandemic (2011–18) did not substantively change the results (appendixes K–T).48 Detailed interpretations and comparisons of the two data analyses (2011–20 versus 2011–18) are in the notes section of each appendix.48
Discussion
Using ten years of representative data from 2011 to 2020, we report disaggregated prevalence of food insecurity among low-income CHIS respondents from six Asian origin groups. At least one in four low-income Asian American adults experienced food insecurity during the study period. Low-income Filipino adults faced the highest burden of food insecurity, at 40 percent. Furthermore, we observed heterogeneity in the severity of food insecurity across Asian origin groups. Very low food security affected 2 percent of low-income Chinese adults but 9 percent of low-income Filipino and 10 percent of low-income Japanese adults. These results fill important data gaps that have contributed to a lack of public awareness of Asian Americans’ experiences with food insecurity.14 For example, the annual USDA national food insecurity report, last published in 2022, included separate estimates for White, Black, and Hispanic populations but failed to include either aggregated or disaggregated Asian populations.1
Low-income Filipino adults were disproportionately affected by food insecurity in the study period. In addition, although Japanese adults appeared to have a total prevalence of food insecurity similar to that of several other Asian origin groups, Japanese adults had the highest level of very low food security. Although the literature exploring the experience of food insecurity among Japanese adults is very limited, these results conflict with a previous study that found that Vietnamese adults had the highest prevalence of food insecurity among Asian American adults in California.33 At the same time, our findings indicate that Japanese adults had the second-highest CalFresh participation rate among the six low-income Asian origin groups. The particularly high prevalence of both very low food security and CalFresh participation among Japanese respondents prompts questions about whether CalFresh participation effectively addresses food insecurity in Japanese communities, thereby highlighting the need for research that examines the food security experiences of Japanese SNAP participants and uses survey instruments in Japanese. This would facilitate a higher representation of Japanese adults with limited English proficiency and provide a deeper understanding of the dynamic relationship between food security and CalFresh participation in this group.
Our finding of high food insecurity among Filipino respondents is supported by the results of two prior studies. One study, using health plan data and published in 2020, found higher food insecurity among Filipino middle-age and older adults when compared with Chinese people.49 The second, using data from the National Latino and Asian American Study and published in 2021, showed that Filipino adults had higher food insecurity (41 percent) compared with Vietnamese (26 percent) and Chinese (27 percent) adults.50 Future research should investigate multilevel factors underlying the high food insecurity burden among Filipino communities, attending to their unique experiences and histories with colonialism, structural racism, and immigration.51
CalFresh participation was low among most Asian origin groups during the study period, with the lowest rates observed in Chinese and Korean communities. Additional studies should explore approaches to reducing barriers to CalFresh enrollment among Asian American adults, particularly in Chinese and Korean communities. Barriers may include cultural stigma, lack of knowledge, complicated application and verification processes, insufficient outreach, and federal immigration policies (for example, fear of the “public charge” rule).29,52,53
Contrary to our hypothesis, limited English proficiency was not a barrier to CalFresh participation for Asian American respondents. In fact, in unadjusted analyses, Asian American respondents with limited English proficiency had generally higher participation rates compared with English-proficient Asian American respondents. That the magnitude of difference varied across origin groups underscores the importance of disaggregating data by Asian origin group.
Previous research has linked limited English proficiency in various populations to higher food insecurity,28,29,31,32 but very limited research has examined the relationship between English proficiency and SNAP participation among Asian Americans. Our findings suggest that limited English proficiency is not a barrier to CalFresh enrollment among Asian American respondents. This result may be due to California’s language access laws, which require interpreters and written translations of CalFresh program materials in many Asian languages, including Cambodian, Chinese, Farsi, Hindi, Hmong, Japanese, Korean, Lao, Mien, Punjabi, Tagalog, Thai, and Vietnamese. In addition, this finding may also be explained by the role of community-based organizations. These organizations have extensive reach among Asian Americans with limited English proficiency and often offer CalFresh enrollment navigation assistance.29,54–56 Asian American adults with limited English proficiency may use community-based organizations’ services more often than their English-proficient counterparts and therefore be more likely to enroll in CalFresh. Further research, preferably longitudinal, is warranted to better understand the impacts of language accessibility policies and community-based organizations’ services on SNAP participation among Asian Americans with limited English proficiency—not only in California but also in other jurisdictions.
Our study responds to a recent joint national effort from the National Institutes of Health, Centers for Disease Control and Prevention (CDC), and USDA, which calls for data disaggregation to identify populations most affected by nutrition insecurity or underuse of assistance programs.57 We found that food insecurity and CalFresh participation rates varied among different Asian American communities, with low-income Filipino adults being disproportionately affected by food insecurity and low-income Chinese and Korean adults having the lowest rates of CalFresh participation. Policy makers and practitioners interested in addressing disparities among Asian origin groups or groups within other major, heterogenous populations may consider data disaggregation as a first step toward identifying and addressing unique needs and barriers faced by specific subpopulations. State agencies are ideally positioned to collect and report disaggregated data by Asian origin group for nutrition assistance program participants. One-size-fits-all food insecurity and nutrition program enrollment interventions may have limited utility,29 given the diversity of language and culture, socioeconomic status, immigration histories, and acculturation. Instead, culturally tailored, linguistically appropriate interventions that incorporate targeted outreach, consider unique needs and assets, and involve partnership with trusted community agencies in each population may be more effective.29,56 For example, the CDC’s Racial and Ethnic Approaches to Community Health program funds community-based organizations and other institutions to develop community-based, culturally informed strategies that target health disparities in Asian American and other minoritized populations. Since 1999, this program has yielded positive impacts on nutrition access and quality for millions of people.58
Conclusion
In a large, diverse population of low-income Asian Americans, we observed high levels of food insecurity and low levels of participation in CalFresh, California’s implementation of the SNAP program, both of which varied across Asian origin groups during our study period. Our findings suggest that policies supporting language accessibility and providing language assistance resources to community-based organizations may improve SNAP participation among Asian Americans with limited English proficiency. Collecting and reporting disaggregated data by Asian origin group to refine targeting of outreach and interventions may be an important step toward improving nutrition assistance program impact among Asian Americans.
Supplementary Material
Acknowledgments
Milkie Vu was supported by the National Cancer Institute, National Institutes of Health (Grant No. T32CA193193). The funder had no role in study design, data collection and analysis, decision to publish, or preparation of the manuscript. The authors acknowledge the support that Ellen Bayer, Danny Ta, and Kwang-Youn Kim provided for the manuscript. The California Health Interview Survey data set was made available through the UCLA Center for Health Policy Research.
Footnotes
This article was prepared in partial fulfillment of the requirements of that program. To access the authors’ disclosures, click on the Details tab of the article online.
Contributor Information
Milkie Vu, Northwestern University, Chicago, Illinois..
Duy Trinh, Princeton University, Princeton, New Jersey..
Namratha R. Kandula, Northwestern University.
Nhat-Ha Tran Pham, University of Pennsylvania, Philadelphia, Pennsylvania..
Jennifer Makelarski, independent researcher, Chicago, Illinois..
Hilary K. Seligman, University of California San Francisco, San Francisco, California.
NOTES
- 1.Coleman-Jensen A, Rabbitt MP, Gregory CA, Singh A. Household food security in the United States in 2021 [Internet]. Washington (DC): Department of Agriculture, Economic Research Service; 2022. Sep [cited 2023 Jul 6]. Available from: https://www.ers.usda.gov/webdocs/publications/104656/err-309.pdf?v=6378.5 [Google Scholar]
- 2.Gundersen C, Ziliak JP. Food insecurity and health outcomes. Health Aff (Millwood). 2015;34(11):1830–9. [DOI] [PubMed] [Google Scholar]
- 3.Arenas DJ, Thomas A, Wang J, DeLisser HM. A systematic review and meta-analysis of depression, anxiety, and sleep disorders in US adults with food insecurity. J Gen Intern Med. 2019;34(12):2874–82. [DOI] [PMC free article] [PubMed] [Google Scholar]
- 4.Laraia BA. Food insecurity and chronic disease. Adv Nutr. 2013;4(2):203–12. [DOI] [PMC free article] [PubMed] [Google Scholar]
- 5.Gundersen C, Kreider B, Pepper J. The economics of food insecurity in the United States. Appl Econ Perspect Policy. 2011;33(3):281–303. [Google Scholar]
- 6.Ratcliffe C, McKernan SM, Zhang S. How much does the Supplemental Nutrition Assistance Program reduce food insecurity? Am J Agric Econ. 2011;93(4):1082–98. [DOI] [PMC free article] [PubMed] [Google Scholar]
- 7.Keith-Jennings B, Llobrera J, Dean S. Links of the Supplemental Nutrition Assistance Program with food insecurity, poverty, and health: evidence and potential. Am J Public Health. 2019;109(12):1636–40. [DOI] [PMC free article] [PubMed] [Google Scholar]
- 8.Vigil A. Trends in USDA Supplemental Nutrition Assistance Program participation rates: fiscal year 2016 to fiscal year 2020 (summary) [Internet]. Washington (DC): Department of Agriculture, Food and Nutrition Service; 2022. Dec [cited 2023 Jul 6]. Available from: https://fns-prod.azureedge.us/sites/default/files/resource-files/trends-snap-participation-rates-fy16-20report-summary.pdf [Google Scholar]
- 9.Kamdar N, Rozmus CL, Grimes DE, Meininger JC. Ethnic/racial comparisons in strategies parents use to cope with food insecurity: a systematic review of published research. J Immigr Minor Health. 2019;21(1):175–88. [DOI] [PubMed] [Google Scholar]
- 10.Nikolaus CJ, Johnson S, Benally T, Maudrie T, Henderson A, Nelson K, et al. Food insecurity among American Indian and Alaska Native people: a scoping review to inform future research and policy needs. Adv Nutr. 2022;13(5):1566–83. [DOI] [PMC free article] [PubMed] [Google Scholar]
- 11.Yi SS, Kwon SC, Suss R, Ðoàn LN, John I, Islam NS, et al. The mutually reinforcing cycle of poor data quality and racialized stereotypes that shapes Asian American health. Health Aff (Millwood). 2022;41(2):296–303. [DOI] [PMC free article] [PubMed] [Google Scholar]
- 12.Yi SS. Taking action to improve Asian American health. Am J Public Health. 2020;110(4):435–7. [DOI] [PMC free article] [PubMed] [Google Scholar]
- 13.Kim JHJ, Lu Q, Stanton AL. Overcoming constraints of the model minority stereotype to advance Asian American health. Am Psychol. 2021;76(4):611–26. [DOI] [PMC free article] [PubMed] [Google Scholar]
- 14.Chin MK, Đoàn LN, Chong SK, Wong JA, Kwon SC, Yi SS. Asian American subgroups and the COVID-19 experience: what we know and still don’t know. Health Affairs Blog [blog on the Internet]. 2021. May 24 [cited 2023 Jul 7]. Available from: https://www.healthaffairs.org/content/forefront/asian-american-subgroups-and-covid-19-experience-we-know-and-still-don-t-know [Google Scholar]
- 15.Yellow Horse AJ, Jeung R, Matriano R. Stop AAPI Hate national report [Internet]. San Francisco (CA): Stop AAPI Hate; 2021. [cited 2023 Jul 6]. Available from: https://stopaapihate.org/wp-content/uploads/2022/03/22-SAH-NationalReport-3.1.22-v9.pdf [Google Scholar]
- 16.Rummo PE, Naik R, Thorpe LE, Yi SS. Changes in diet and food shopping behaviors among Asian-American adults due to COVID-19. Obes Sci Pract. 2021;7(3):307–20. [DOI] [PMC free article] [PubMed] [Google Scholar]
- 17.Morales DX, Morales SA, Beltran TF. Racial/ethnic disparities in household food insecurity during the COVID-19 pandemic: a nationally representative study. J Racial Ethn-Health Disparities. 2021;8(5):1300–14. [DOI] [PMC free article] [PubMed] [Google Scholar]
- 18.Shimkhada R, Scheitler AJ, Ponce NA. Capturing racial/ethnic diversity in population-based surveys: data disaggregation of health data for Asian American, Native Hawaiian, and Pacific Islanders (AANHPIs). Popul Res Policy Rev. 2021;40(1):81–102. [Google Scholar]
- 19.Lauren BN, Silver ER, Faye AS, Rogers AM, Woo-Baidal JA, Ozanne EM, et al. Predictors of households at risk for food insecurity in the United States during the COVID-19 pandemic. Public Health Nutr. 2021;24(12):3929–36. [DOI] [PMC free article] [PubMed] [Google Scholar]
- 20.Stupplebeen DA. Housing and food insecurity and chronic disease among three racial groups in Hawai’i. Prev Chronic Dis. 2019;16:E13. [DOI] [PMC free article] [PubMed] [Google Scholar]
- 21.Thompson CA, Gomez SL, Hastings KG, Kapphahn K, Yu P, Shariff-Marco S, et al. The burden of cancer in Asian Americans: a report of national mortality trends by Asian ethnicity. Cancer Epidemiol Biomarkers Prev. 2016;25(10):1371–82. [DOI] [PMC free article] [PubMed] [Google Scholar]
- 22.Hamilton AS, Wu AH, Stram DO. Resources and methods for studying cancer among Asian Americans. In: Wu AH, Stram DO, editors. Cancer epidemiology among Asian Americans. New York (NY): Springer International Publishing; 2016. p. 1–17. [Google Scholar]
- 23.Srinivasan S, Guillermo T. Toward improved health: disaggregating Asian American and Native Hawaiian/Pacific Islander data. Am J Public Health. 2000;90(11):1731–4. [DOI] [PMC free article] [PubMed] [Google Scholar]
- 24.Vu M, Berg CJ, Escoffery C, Jang HM, Nguyen TT, Travis L, et al. A systematic review of practice-, provider-, and patient-level determinants impacting Asian-Americans’ human papillomavirus vaccine intention and uptake. Vaccine. 2020;38(41):6388–401. [DOI] [PMC free article] [PubMed] [Google Scholar]
- 25.Census Bureau. 2015: ACS 5-year estimates total population [Internet]. Washington (DC): Census Bureau. Table B16004, Age by language spoken at home by ability to speak English for the population 5 years and over; [cited 2023 Aug 21]. Available from: https://data.census.gov/table?t=013:016:019:022:023:029&tid=ACSDT5YSPT2021.B16004 [Google Scholar]
- 26.AAPI Data. Infographic—percentage of Asian Americans with limited English proficiency (2017) [Internet]. Riverside (CA): AAPI Data; 2020. May 28 [cited 2023 Jul 6]. Available from: https://aapidata.com/infographic-limited-english-2-2/ [Google Scholar]
- 27.Skinner C. State immigration legislation and SNAP take-up among immigrant families with children. J Econ Issues. 2012;46(3):661–82. [Google Scholar]
- 28.Vu M, Raskind IG, Escoffery C, Srivanjarean Y, Jang HM, Berg CJ. Food insecurity among immigrants and refugees of diverse origins living in metropolitan Atlanta: the roles of acculturation and social connectedness. Transl Behav Med. 2020;10(6):1330–41. [DOI] [PMC free article] [PubMed] [Google Scholar]
- 29.Louie NT, Kim LP, Chan SE. Perceptions and barriers to SNAP utilization among Asian and Pacific Islanders in greater Los Angeles. Am J Health Promot. 2020;34(7):779–90. [DOI] [PubMed] [Google Scholar]
- 30.Batalova J, Fix M. A profile of limited English proficient adult immigrants. Peabody J Educ. 2010;85(4):511–34. [Google Scholar]
- 31.Dharod JM, Croom JE, Sady CG. Food insecurity: its relationship to dietary intake and body weight among Somali refugee women in the United States. J Nutr Educ Behav. 2013;45(1):47–53. [DOI] [PubMed] [Google Scholar]
- 32.Iglesias-Rios L, Bromberg JE, Moser RP, Augustson EM. Food insecurity, cigarette smoking, and acculturation among Latinos: data from NHANES 1999–2008. J Immigr Minor Health. 2015;17(2):349–57. [DOI] [PMC free article] [PubMed] [Google Scholar]
- 33.Becerra MB, Mshigeni SK, Becerra BJ. The overlooked burden of food insecurity among Asian Americans: results from the California Health Interview Survey. Int J Environ Res Public Health. 2018;15(8):1684. [DOI] [PMC free article] [PubMed] [Google Scholar]
- 34.Census Bureau. QuickFacts—California [Internet]. Washington (DC): Census Bureau; [cited 2023 Jul 6]. Available from: https://www.census.gov/quickfacts/CA [Google Scholar]
- 35.Census Bureau. 2020: ACS 5-year estimates detailed tables [Internet]. Washington (DC): Census Bureau. Table B02001, Race [cited 2023 Aug 21]. Available from: https://data.census.gov/table?q=asian&tid=ACSDT5Y2020.B02001 [Google Scholar]
- 36.Sherr S, Goyle A, Langdale K, Engle-Bauer M, Best J. California Health Interview Survey, CHIS 2019–2020 Methodology Report Series, Report 2, Data collection methods [Internet]. Los Angeles (CA): UCLA Center for Health Policy Research; 2021. Sep [cited 2023 Jul 6]. Available from: https://healthpolicy.ucla.edu/chis/design/Documents/CHIS%202019-2020%20Methodology%20Report%20Series/CHIS_2019-2020_MethodologyReport2_DataCollection_Final%20(UCLA)%2009AEP2021.pdf [Google Scholar]
- 37.Department of Agriculture, Economic Research Service. U.S. Household Food Security Survey Module: six-item short form [Internet]. Washington (DC): USDA; 2012. Sep [cited 2023 Jul 6]. Available from: https://www.ers.usda.gov/media/8282/short2012.pdf [Google Scholar]
- 38.California Department of Social Services. CalFresh: eligibility and issuance requirements [Internet]. Sacramento (CA): CDSS; [last updated 2022. Jun 22; cited 2023 Jul 6]. Available from: https://www.cdss.ca.gov/inforesources/cdss-programs/calfresh/eligibility-and-issuance-requirements [Google Scholar]
- 39.Grummon AH, Taillie LS. Supplemental Nutrition Assistance Program participation and racial/ethnic disparities in food and beverage purchases. Public Health Nutr. 2018;21(18):3377–85. [DOI] [PMC free article] [PubMed] [Google Scholar]
- 40.Berkowitz SA, Seligman HK, Rigdon J, Meigs JB, Basu S. Supplemental Nutrition Assistance Program (SNAP) participation and health care expenditures among low-income adults. JAMA Intern Med. 2017;177(11):1642–9. [DOI] [PMC free article] [PubMed] [Google Scholar]
- 41.Nguyen KH, Giron NC, Trivedi AN. Parental immigration status, Medicaid expansion, and Supplemental Nutrition Assistance Program participation. Health Aff (Millwood). 2023;42(1):53–62. [DOI] [PubMed] [Google Scholar]
- 42.Mabli J, Ohls JC. Supplemental Nutrition Assistance Program dynamics and employment transitions: the role of employment instability. Appl Econ Perspect Policy. 2012;34(1):187–213. [Google Scholar]
- 43.Sherr S, Goyle A, Langdale K, Best J. California Health Interview Survey, CHIS 2019–2020 Methodology Report Series, Report 5, Weighting and variance estimation [Internet]. Los Angeles (CA): UCLA Center for Health Policy Research; 2021. Sep [cited 2023 Jul 6]. Available from: https://healthpolicy.ucla.edu/chis/design/Documents/CHIS%202019-2020%20Methodology%20Report%20Series/CHIS_2019_2020_MethodologyReport5_WeightingandVarianceEstimation_Final%20(UCLA)%2010SEP2021.pdf [Google Scholar]
- 44.Muller CJ, MacLehose RF. Estimating predicted probabilities from logistic regression: different methods correspond to different target populations. Int J Epidemiol. 2014; 43(3):962–70. [DOI] [PMC free article] [PubMed] [Google Scholar]
- 45.Legal Services of Northern California. Temporary application changes because of COVID-19 [Internet]. Sacramento (CA): Legal Services of Northern California; c 2023. [cited 2023 Jul 6]. Available from: https://calfresh.guide/temporary-application-changes-because-of-covid-19/ [Google Scholar]
- 46.California Department of Social Services. CalFresh COVID-19 flexibilities [Internet]. Sacramento (CA): Department of Social Services; c 2023. [cited 2023 Jul 6]. Available from: https://www.cdss.ca.gov/calfreshcovid19 [Google Scholar]
- 47.Schanzenbach DW, Bauer L, Nantz G. Twelve facts about food insecurity and SNAP [Internet]. Washington (DC): Hamilton Project, Brookings; 2016. Apr [cited 2023 Jul 6]. Available from: https://www.brookings.edu/wp-content/uploads/2016/07/THP_12Facts_SNAP.pdf [Google Scholar]
- 48.To access the appendix, click on the Details tab of the article online.
- 49.Gordon NP, Banegas MP, Tucker-Seeley RD. Racial-ethnic differences in prevalence of social determinants of health and social risks among middle-aged and older adults in a Northern California health plan. PLoS One. 2020;15(11):e0240822. [DOI] [PMC free article] [PubMed] [Google Scholar]
- 50.Lai S, Huang D, Bardhan I, Park M. Associations between food insecurity and depression among diverse Asian Americans. Asian Pac Isl Nurs J. 2021;5(4):188–98. [DOI] [PMC free article] [PubMed] [Google Scholar]
- 51.Sabado-Liwag MD, Manalo-Pedro E, Taggueg R Jr, Bacong AM, Adia A, Demanarig D, et al. Addressing the interlocking impact of colonialism and racism on Filipinx/a/o American health inequities. Health Aff (Millwood). 2022;41(2):289–95. [DOI] [PubMed] [Google Scholar]
- 52.Pinard CA, Bertmann FMW, Shanks CB, Schober DJ, Smith TM, Carpenter LC, et al. What factors influence SNAP participation? Literature reflecting enrollment in food assistance programs from a social and behavioral science perspective. J Hunger Environ Nutr. 2017;12(2):151–68. [Google Scholar]
- 53.Touw S, McCormack G, Himmelstein DU, Woolhandler S, Zallman L. Immigrant essential workers likely avoided Medicaid and SNAP because of a change to the public charge rule. Health Aff (Millwood). 2021;40(7):1090–8. [DOI] [PMC free article] [PubMed] [Google Scholar]
- 54.Nguyen G, Hsu L, Kue KN, Nguyen T, Yuen EJ. Partnering to collect health services and public health data in hard-to-reach communities: a community-based participatory research approach for collecting community health data. Prog Community Health Partnersh. 2010;4(2):115–9. [DOI] [PubMed] [Google Scholar]
- 55.Cohen N SNAP at the community scale: how neighborhood characteristics affect participation and food access. Am J Public Health. 2019;109(12):1646–51. [DOI] [PMC free article] [PubMed] [Google Scholar]
- 56.Yee A Asian American food aid expands to address hidden hunger during pandemic. NBC News [serial on the Internet]. 2021. Feb 24 [cited 2023 Jul 6]. Available from: https://www.nbcnews.com/news/asian-america/asian-american-food-aid-expands-address-hidden-hunger-during-pandemic-n1258628 [Google Scholar]
- 57.Zenk SN, Tabak LA, Pérez-Stable EJ. Research opportunities to address nutrition insecurity and disparities. JAMA. 2022;327(20):1953–4. [DOI] [PubMed] [Google Scholar]
- 58.Centers for Disease Control and Prevention. REACH program impact [Internet]. Atlanta (GA): CDC; [last reviewed 2023. May 11; cited 2023 Jul 6]. Available from: https://www.cdc.gov/nccdphp/dnpao/state-local-programs/reach/program_impact/index.htm [Google Scholar]
Associated Data
This section collects any data citations, data availability statements, or supplementary materials included in this article.