

Abstract
Practical relevance:
Routinely used markers of renal function in clinical practice include urea and creatinine. However, these are insensitive markers, particularly in the early stages of kidney disease. Measurement of glomerular filtration rate (GFR) is regarded as the most sensitive index of functioning renal mass. It may be useful for feline patients in varying clinical scenarios; for example, where a more accurate measurement of renal function may aid diagnosis, to enable response to therapeutic interventions to be more closely monitored, or to evaluate renal function prior to the use of nephrotoxic or renally cleared drugs.
Clinical challenges:
Traditional methods of measuring GFR, such as renal clearance or multisample plasma clearance techniques, are generally impractical for clinical use. Limited sampling and single sample plasma clearance methods using the filtration marker iohexol have been validated in cats. These have the advantages of reduced stress to cats associated with repeated sampling and reduced costs of analysis, and therefore offer greater clinical utility. Attempts to develop an estimated GFR (eGFR) formula similar to that used in human patients have been made in cats, although currently an accurate and reliable formula is not available.
Audience:
This review presents the basis for the theoretical understanding and practical measurement of GFR for any veterinary practitioner wishing to obtain a more accurate and sensitive assessment of renal function than routinely used markers provide.
Evidence base:
The review draws evidence from peer-reviewed publications, the author’s PhD thesis and also clinical experience.
The nephron – functional unit of the kidney
The kidney can be differentiated into two major regions, the outer cortex and inner medulla. The functional unit of the kidney, the nephron, comprises the glomerulus within the Bowman’s capsule, the proximal tubule, loop of Henle, distal tubule and collecting duct (Figures 1 and 2). The glomerulus and Bowman’s capsule are located in the renal cortex and the tubules run between the cortex and medulla. Each human kidney contains approximately 1 million nephrons. 1 The feline kidney and canine kidney are reported to contain approximately 200,000 and 400,000 nephrons, respectively. 2
Figure 1.
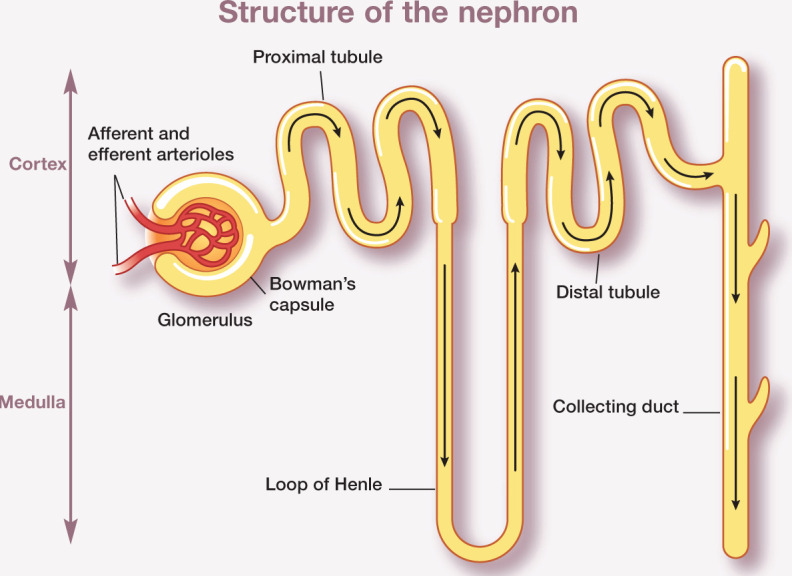
Ultrafiltrate filtered from the glomerulus of the nephron enters the Bowman’s space within the Bowman’s capsule, then passes through the proximal tubule, loop of Henle, distal tubule and collecting duct to form urine
Figure 2.
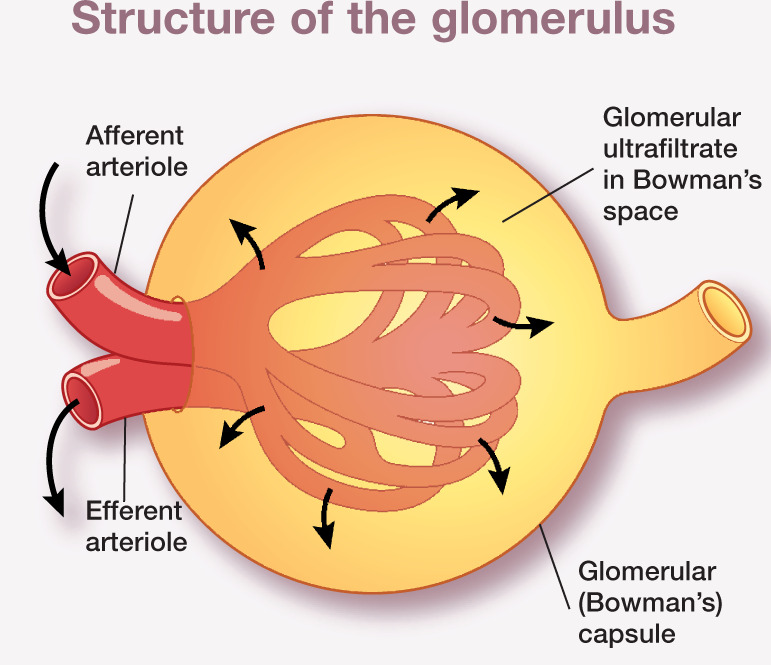
The glomerulus – a network of capillaries interposed between the afferent and efferent arterioles – is enclosed within an epithelial capsule (Bowman’s capsule) and separated by the Bowman’s space. Glomerular filtration is a pressure-driven process governed by hydrostatic and oncotic pressures in the glomerular capillaries and Bowman’s capsule, and by glomerular conductivity and the capillary surface area
The glomerulus consists of a tuft of glomerular capillaries interposed between the afferent and efferent arterioles, and is enclosed within an epithelial capsule (Bowman’s capsule) and separated from the capsule by the Bowman’s space. Fluid is filtered from plasma through the glomerulus and into the Bowman’s space. Glomerular capillary walls are composed layers: the endothelial cells, glomerular basement membrane and epithelial cells. Endothelial cells are fenestrated and epithelial cells are attached to the glomerular basement membrane by foot processes, between which are slit pores which allow passage of small solutes.
Physiology of glomerular filtration
Glomerular filtration is a selective pressure-driven filtration process across the glomerular capillary wall, determined by the size and molecular charge of a solute. Fluid that is filtered through the glomerular capillaries is known as ultrafiltrate. The filtration fraction, the proportion of plasma flowing through the capillaries forming the ultrafiltrate, has been reported to be between 27 and 31% in cats.3,4 Ultrafiltrate enters the proximal tubule from the Bowman’s space and passes to the loop of Henle, which has both an ascending and descending limb, and the length of which varies between nephrons. The ultrafiltrate subsequently flows through the distal tubule and finally the collecting duct to form urine.
Measurement of GFR (see above) is regarded as the most sensitive index of functioning renal mass. Single nephron GFR (snGFR) is the product of the effective ultrafiltration pressure and ultrafiltration coefficient. The effective ultrafiltration pressure is governed by hydraulic and oncotic pressures in the glomerular capillaries and Bowman’s capsule. Therefore, marked hypotension may decrease GFR due to reduced hydraulic pressure in the glomerular capillaries, for which renal haemodynamic regulatory mechanisms cannot compensate. A lower urinary tract obstruction will increase hydraulic pressure in the Bowman’s space and decrease GFR. The ultrafiltration coefficient is determined by glomerular conductivity and capillary surface area.
A functional change that is recognised with reducing renal mass is an increase in snGFR, which is considered to be an adaptive response to maintain overall GFR. This adaptive response is beneficial in the short-term. However, in the long-term glomerular hyper-filtration and intraglomerular hypertension will lead to glomerulosclerosis and progressive nephron loss. The net effect of increases in snGFR is that significant loss of functioning renal mass can occur without an initial decline in whole kidney GFR. Studies in cats have shown GFR to increase following surgical reduction of renal mass, with histopathological evidence of hypertrophy.3,5 Finding evidence of renal hypertrophy, suggesting hyperfiltration is occurring, would be difficult in clinical patients without the collection of renal biopsies for histopathological examination, which is generally not performed. Therefore, detection of decreasing GFR at the earliest possible point and implementation of appropriate management for chronic kidney disease (CKD) may help to slow disease progression and preserve functioning renal mass.
Why measure GFR?
Limitations of routinely used markers
In clinical practice, plasma or serum creatinine, urea concentration or urine specific gravity (USG) are routinely used markers of renal function.
USG is considered an insensitive marker of renal function. Cats that have undergone renal ablation have been shown to retain significant urine concentrating ability, and this capacity to concentrate urine appears to be greater than that of dogs or humans. 5 Moreover, USG can vary in cats with CKD and it does not predict progression of disease. 6 USG should not be considered a marker of GFR. Although GFR is important in formation of the ultrafiltrate, this will undergo selective reabsorption and secretion processes within the renal tubules through tubular transport mechanisms. The final USG reflects the ability of the renal tubules to concentrate or dilute urine according to the body’s needs to balance water intake and excretion. While renal mass does influence maximal urine concentrating ability, non-renal factors such as certain drugs (diuretics, corticosteroids), diet or fluid intake are major influencers of USG. Both urea and creatinine concentrations can also be influenced by non-renal factors such as dehydration and a high protein diet. Urea is passively absorbed in the renal tubules. Therefore, plasma concentrations can increase at slow tubular flow rates such as may occur in a dehydrated or hypovolaemic patient.
Creatinine is perhaps the most widely used surrogate marker of renal function. The clinical utility of creatinine is based on its relationship to GFR. Creatinine is formed at a stable rate (directly related to muscle mass) in healthy individuals from non-enzymatic dehydration of creatine phosphate in skeletal muscle. 7 As it is not protein bound, it is freely filtered by the glomerulus and, since creatinine is neither reabsorbed nor secreted to any significant extent in the tubules of cats, its plasma concentration correlates inversely with GFR. However, there are a number of factors affecting the sensitivity of creatinine as a marker of renal function that need to be considered:
Creatinine is not only a marker of GFR but also a marker of muscle mass, and plasma concentrations can therefore depend on muscle mass.
Creatinine concentrations can vary depending on the sample collected (plasma vs serum) and method of analysis (Jaffe’s reaction vs enzymatic). Jaffe chemistry detects non-creatinine chromogens, causing false elevations in creatinine. In addition, creatinine concentrations vary when measured in different veterinary practices, especially when using bench-top analysers. 8
Analytical results are more consistent when samples are submitted to reference laboratories, but there is variation in reference intervals between laboratories. This can lead to cats and dogs being classified differently as normal or abnormal depending on the laboratory performing the analysis. 9
In cats and dogs the first step of creatinine biosynthesis takes place in the kidneys; 10 hence creatinine generation may be reduced in patients with kidney disease. Endogenous creatinine production per kg of body weight has been shown to be lower in dogs with reduced renal function. 11
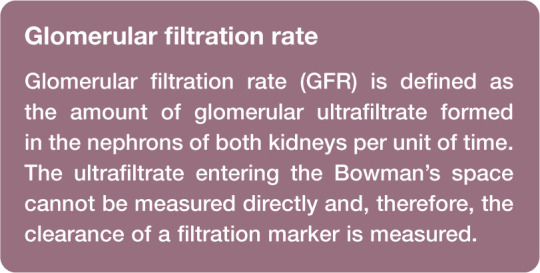
Thus, the relationships between GFR, and urea and creatinine, are not strong (Figure 3). Urea and the reciprocal of creatinine explain only 25% and 43% of the variability in GFR, respectively. Combining the markers does improve the prediction of GFR but not to any significant degree (1/creatinine and urea combined explain 48% variability in GFR). due to the non-linear relationship between GFR and creatinine, a significant reduction in GFR is required before corresponding increases in creatinine concentration are seen. indeed, a reduction in GFR from 3.5 to 1.5 ml/min/kg resulted in a corresponding increase in plasma creatinine of only approximately 100 to 150 µmol/l (see Figure 3).
Figure 3.
Relationship between creatinine and urea concentration and 1/creatinine with glomerular filtration rate (GFR). The relationships were determined by a process of curve fitting. The reciprocal of creatinine demonstrates a linear relationship with GFR, whereas the relationship between creatinine and GFR is non-linear (which explains the absence of an R2 value). The relationships between GFR and urea and 1/creatinine are not strong. Figures from Finch 12
Furthermore, the sensitivity and specificity of creatinine and urea are dependent on the GFR cut-off point that is used for determining abnormal renal function and this remains poorly defined. They will also be dependent on the reference interval used to determine whether a patient has increased creatinine or urea concentration. Table 1 presents the sensitivity and specificity of the markers alone and in combination. Urea has higher sensitivity than creatinine. This means there is less risk of false-negative results, but a greater risk of false-positive results. This probably reflects what is seen in the clinical situation, with this marker being affected frequently by non-renal factors including circulation, diet and gastro-intestinal haemorrhage. Creatinine has higher specificity than urea and, therefore, produces fewer false-positive results but more false-negative results. Again, this probably reflects what is seen in the clinical situation, with poorly muscled cats having creatinine concentrations within the laboratory reference interval despite a strong suspicion of CKD.
Table 1.
Sensitivity and specificity of routinely used renal markers (urea and creatinine) alone and in combination for detection of decreased glomerular filtration rate (GFR)
| GFR <0.92 ml/min/kg | GFR <1.02 ml/min/kg | GFR <1.30 ml/min/kg | ||||
|---|---|---|---|---|---|---|
|
|
||||||
| Sensitivity | Specificity | Sensitivity | Specificity | Sensitivity | Specificity | |
| Creatinine | 82% | 86% | 71% | 86% | 61% | 91% |
| Urea | 91% | 34% | 95% | 36% | 91% | 40% |
| Creatinine + urea | 82% | 87% | 71% | 87% | 61% | 93% |
Elevated creatinine and urea were defined using the upper limit of the laboratory reference interval (177 µmol/l and 9.9 mmol/l, respectively). Urea has higher sensitivity than creatinine and conversely creatinine has higher specificity. Optimal sensitivity and specificity is probably achieved by using a combination of the two markers. Data from Finch 13
Optimal sensitivity and specificity is probably achieved by using a combination of the two markers. in cases of discrepancy between urea and creatinine, creatinine is considered the more accurate given the higher likelihood of false positives with urea associated with non-renal factors.
The positive and negative predictive value should also be determined when considering the diagnostic use of markers. Figure 4 presents the positive and negative predictive value of urea and creatinine combined for three different GFR cut-off points. As can be seen from the graphs, the positive predictive value increases with the prevalence of the disease whereas the negative predictive value decreases. Therefore, a urea and creatinine concentration above the laboratory reference interval in an older cat in which there is suspicion of CKD will be more reliable than in a younger healthy cat.
Figure 4.

Positive (blue, solid) and negative (green, dotted) predictive value of urea and creatinine combined for varying glomerular filtration rate (GFR) cut-off points. The positive and negative predictive value of the combination of markers for predicting low GFR will be affected by the prevalence of disease in a population. The positive predictive value increases with the prevalence of disease whereas the negative predictive value decreases. Data from Finch 13
GFR – a more sensitive assessment of renal function
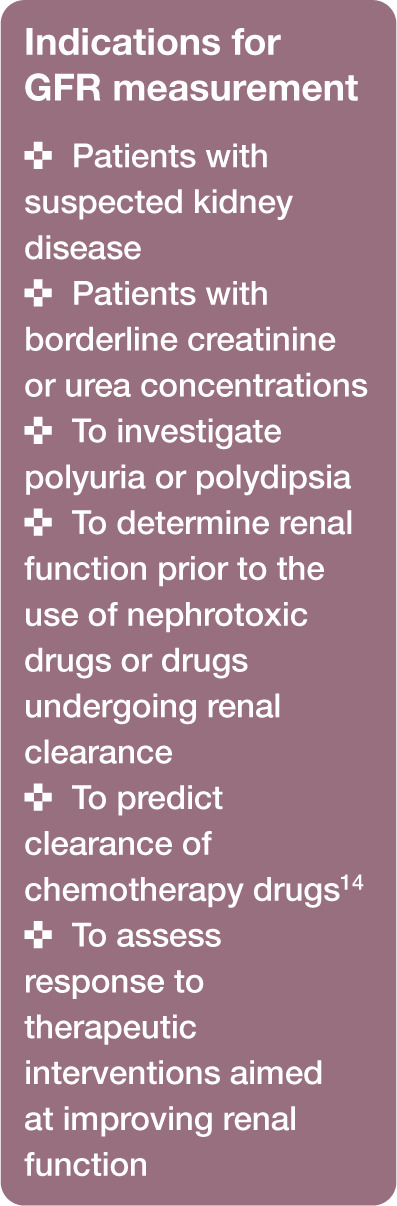
Recognition of the limitations of plasma creatinine, urea and USG as markers of functioning renal mass and their lack of sensitivity in detecting early kidney disease has led to demand for more precise methods. Measurement of GFR is considered to provide the most accurate and sensitive assessment of functioning renal mass, and is useful in a variety of clinical scenarios (see left).
GFR may additionally be determined in a research setting to provide an accurate measurement of renal function. It may also be beneficial for monitoring renal function following toxin exposure or recovery from acute kidney injury, although its use in these clinical settings remains to be fully evaluated.
Methods of measuring GFR
GFR can be measured based on plasma or renal clearance of an endogenous or exogenously administered filtration marker (see right). The terms clearance and GFR are, therefore, often used interchangeably.
Renal clearance methods
Renal (sometimes referred to as urinary) clearance is defined as the rate at which a filtration marker is completely removed from a hypothetical volume of plasma by the kidneys to provide the amount of marker appearing in urine per unit of time. The fructose polymer inulin is considered the gold standard filtration marker for this clearance method. Measurement of renal clearance requires infusion of a marker at a constant rate to achieve steady state concentration, as well as accurate timing and complete urine collection. This necessitates urinary catheterisation and bladder emptying. Consequently, these methods are impractical for clinical use and remain largely a research tool.
Plasma clearance methods
Plasma clearance methods are more commonly used since they involve administration of a bolus dose of filtration marker and collection of blood samples.
Radiolabelled markers Plasma clearance of radiolabelled markers such as 99mTc-DTPA and 51Cr-EDTA offers the advantage of allowing assessment of each individual kidney through renal scintigraphy as well as GFR determination. The disadvantage of radiolabelled markers is the requirement for nuclear medicine facilities. Several studies in cats have used radiolabelled markers to determine GFR.14 –22
Exogenous creatinine Exogenously administered creatinine has been used in cats as a filtration marker.22 –26 The lack of a medical grade formulation is a disadvantage of this method. Also, due to the larger volume of distribution compared with other filtration markers, this is a much lengthier test to perform.11,27 The increased sampling time required can additionally result in a much larger extrapolated component of the area under the plasma concentration vs time curve (AUC) than for other markers, 28 particularly in patients with reduced renal function, and this may lead to inaccuracies in GFR measurement. in dogs, extra-renal clearance of creatinine has been identified, which is important in patients with low GFR, 29 meaning GFR may be overestimated. Extrarenal clearance has not been explored in cats.
Iohexol Radiographic contrast agents, such as iohexol (see below), meet the requirements of a useful filtration marker. despite concerns regarding contrast-induced nephropathies in human patients, no adverse effects have been reported in plasma clearance studies using iohexol in cats.14,22 –25,28,30 –36
Inulin GFR has been determined using plasma clearance of inulin in cats.17,26,30,37,38 Although renal clearance of inulin is considered the gold standard GFR measurement technique, plasma clearance of inulin is not recommended. in a canine study approximately 40% of administered inulin was unaccounted for. 11 This was considered to be the result of extra-renal biliary clearance. Extra-renal clearance of inulin has not been studied in cats.

Iohexol as a filtration marker
Iohexol is readily available for clinical use as the radiographic contrast marker omnipaque. iohexol demonstrates endo- and exo-isomerism. 39 Analysis of iohexol concentrations in samples using high performance liquid chromatography (HPLC) allows detection of endo- and exo-isomers. The predominant isomer quantitatively is known to be exo-iohexol. Some studies have reported a difference in clearance of the two isomers in cats,22 –25 suggesting that measurement of total iohexol only may lead to inaccuracies when determining GFR. However, a more recent study demonstrated no difference in clearance between the two isomers and found that following administration there is no significant conversion of one isomer to the other. 40 This is supported by findings in dogs,41,42 rats 41 and human patients.43,44 Biologically this seems more plausible than the glomerular filtration barrier reacting differently depending on the isomer presented to it.
The author recommends that the isomers are considered as one pharmacological entity (ie, measure total iohexol concentration) when calculating clearance. High performance capillary electrophoresis (HPCE) measures total iohexol only.
Pharmacokinetic models to calculate GFR using plasma clearance methods
Accurate plasma clearance methods rely on collection of blood samples at multiple time points to create a plasma concentration vs time curve. The clearance (Cl) is then calculated as: Cl = dose/AUC, where AUC is the area under the plasma concentration vs time curve. The concentration of the filtration marker must first be log transformed to create the plasma cconcentration vs time curve before calculating the AUC. despite the fact that the concentration of most filtration markers is determined in serum, the term plasma concentration vs time curve is used, as GFR is dependent on renal plasma flow. Filtration markers distribute throughout a number of compartments within the body. This allows a pharmacokinetic model to be constructed which can be used to calculate AUC. Such compartments can be considered more as mathematical tools than as defined physiological spaces.
One-compartment model A one-compartment model assumes that the body is a single compartment and that, following administration of the filtration marker, there is immediate mixing and distribution within the body and that the marker is excreted from that compartment only. A single linear slope is fitted to the plasma concentration vs time curve (Figure 5). in theory, a minimum of only two samples is required to generate a one-compartment model. However, the assumption of immediate mixing and distribution within the body does not occur for most filtration markers, which can lead to inaccuracies when using the model without correcting for the assumption.
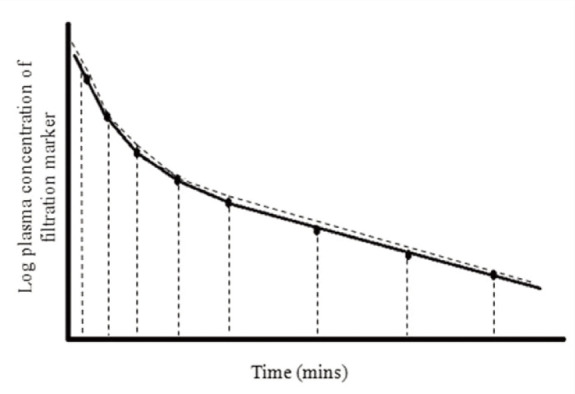
Two-compartment model A two-compartment model is regarded as the most appropriate pharmacokinetic model for most filtration markers. This is because the majority of markers are considered to have a volume of distribution within the extracellular fluid volume (ECFV). This model is based on the concept that following distribution of marker from plasma (central compartment) to ECFV (peripheral compartment), equilibration is reached. The marker is eliminated by renal clearance which allows slow redistribution of marker back into the plasma from the interstitial fluid, from which it is cleared. Therefore, there is an initial distribution phase of the marker within the body followed by elimination from the body. By a process of curve stripping, the plasma concentration vs time curve can be resolved into two linear slopes. The first represents the initial distribution of marker (α) from plasma to ECFV and the second is the terminal elimination (renal clearance) phase (β) (Figure 6).
Non-compartmental models Non-compartmental models can also be applied to calculate AUC. A non-compartmental model is attractive as, unlike compartmental models, it is free of assumptions regarding redistribution and exchange. 45 AUC is determined by fitting multiple trapezoids to the curve (Figure 7). The sum of the trapezoids is used to calculate AUC. It is important that a non-compartmental model is only applied to data when sufficient samples have been collected. 40
Figure 5.
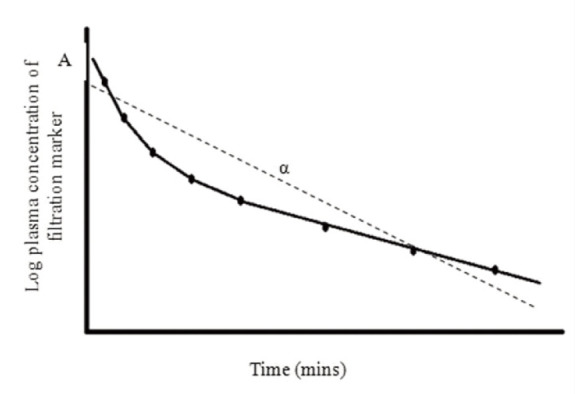
One-compartment model In this example the circles represent the concentration of filtration marker determined from a plasma sample collected at different time points. By plotting the log concentration of marker, a plasma concentration vs time curve is created. The area under the curve (AUC) is determined by fitting a single slope (dashed line) representing a single compartment from which marker is cleared. AUC is calculated by dividing the zero time intercept (A) by the slope of the exponential (α). Clearance is determined by dividing the dose of marker administered by AUC
Figure 6.
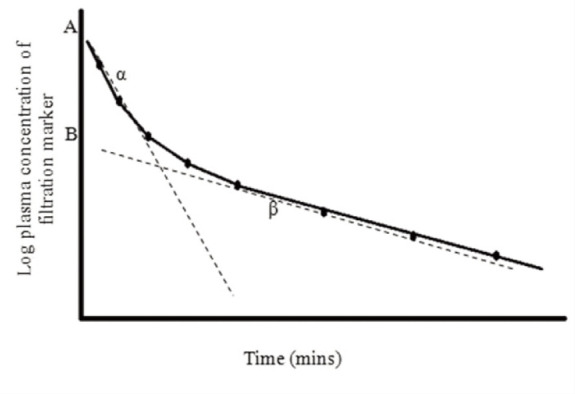
Two-compartment model In this example the circles represent the concentration of filtration marker determined from a plasma sample collected at different time points. By plotting the log concentration of marker, a plasma concentration vs time curve is created. AUC is determined by fitting two slopes (dashed lines) which represent the initial distribution phase of the filtration marker between plasma and extracellular fluid volume (ECFV) (α) and the terminal elimination phase which represents the renal clearance of filtration marker from plasma (β). AUC is determined as A/α + B/β, where A is the zero time intercept of the first (distribution) exponential, α is the slope of this exponential, B is the zero time intercept of the second (elimination) exponential and β is the slope of this exponential. Clearance is determined by dividing the dose of marker administered by AUC
Figure 7.
Non-compartmental model This example uses the trapezoidal rule. The circles represent the concentration of filtration marker determined from a plasma sample collected at different time points. By plotting the log concentration of marker, a plasma concentration vs time curve is created. AUC is determined by fitting multiple trapezoids and calculating the sum of the trapezoids. Clearance is determined by dividing the dose of marker administered by AUC

The commercial pharmacokinetic programs utilised to create compartmental models may not be available to all clinicians and researchers measuring GFR. However, it has been demonstrated that clearance calculated by hand (using graphical plots of plasma concentration vs time curve) for both two-compartment and corrected one-compartment models gives results in agreement with multi-sample clearance calculated using a pharma-cokinetic computer program. 40 Graphical plots of the plasma concentration vs time can be created using standard computer software programs such as Excel or manually using graph paper. The log transformed filtration marker concentration must be used to create the graphical plot of the plasma concentration vs time curve. The two stage curve-stripping process to obtain the intercepts of the distribution and elimination exponentials (A and B) and slope (α and β) for multisample data are described in a previous study. 40 The slope-intercept method (see later), which would be of more use in the clinical setting, requires only a single line of best fit to be applied to the data and negates the need for the curve stripping process.
Limited sampling methods for clinical practice
From inspection of the two-compartment model it is clear that at least four samples are required to generate the biexponential curve. Techniques which require collection of only a limited number of samples have become an important goal for clinicians when measuring clearance; not only with respect to making GFR measurement more practical in the clinical situation, but also for reducing stress in a patient associated with repeated sampling and reducing costs associated with analysis.
Slope-intercept technique
Based on data in human medicine, it is assumed that the initial rate of the distribution phase of a marker is independent of renal clearance (GFR) and an estimate of GFR may, without significant loss of accuracy, be based on the second elimination exponential (collection of samples after 60 mins). 46 Exclusion of the distribution exponential leads to an overestimation of GFR as the AUC is underestimated (Figure 8). 47 The error becomes particularly important in patients with normal or near-normal renal function in which the initial rapid distribution exponential contributes to a relatively larger proportion of the AUC than in patients with a low GFR.
Figure 8.

Plasma concentration vs time curve indicating the missing area under the curve associated with the slope-intercept method. The slope-intercept method of determining plasma clearance relies on the collection of a limited number of samples (generally three) during the elimination phase of the clearance curve (generally 60 mins following administration of the filtration marker). As the initial distribution exponential is ignored, this creates a ‘missing area under the curve’ (blue circle), leading to an underestimation in the calculated area under the curve (AUC) and hence overestimation in glomerular filtration rate (GFR) (as GFR is calculated as dose/AUC)
Clearance calculated from a limited number of samples collected during the elimination phase is referred to as the slope-intercept technique. The AUC, and subsequently clearance, are calculated as discussed above. A correction formula is applied to the result to obtain corrected slope-intercept clearance.
Formulae that correct for the missing area under the curve when using a slope-intercept method have been developed for human patients,46,48,49 dogs 50 and more recently cats. 40 The cat correction formula 40 (Table 2) was developed using the filtration marker iohexol. Iohexol and nuclear medicine markers such as 51Cr-EDTA are considered to distribute through ECFV, 51 and will require similar corrections for the missing area under the curve. Therefore, the cat correction formula, although unvalidated, may be accurate for use with nuclear medicine markers. It is unlikely that the formula will be appropriate for use with the clearance marker exogenous creatinine because of its much larger volume of distribution, which is considered to approximate total body water rather than ECFV,11,27 therefore requiring a three-compartment model.
Table 2.
Formulae for determining GFR using limited sampling plasma clearance methods in cats
| Correction/prediction formula | |
|---|---|
| Slope-intercept GFR (ml/min/kg) | 1.036 x GFRuncorrected – 0.062 x GFRuncorrected 2 |
| Single sample formula for GFR(ml/min/kg) | ([1.027 x β1] x ECFV) / BW
β1 = ([1/t] x ln[Vt/ECFV]) x 0.93 |
| ECFV (ml) | 313.68 + (119.81 x BW) |
The slope-intercept formula corrects for the missing area under the curve when collecting only a limited number of samples (generally three samples) from the elimination phase of the clearance curve (samples collected at 120, 180 and 240 mins). The uncorrected clearance (GFRuncorrected), which is standardised to body weight (BW), is inserted into the formula to obtain the corrected clearance, the unit of which is ml/min/kg
Single sample GFR is determined from a single sample collected at time t (180 mins) and the volume of distribution of iohexol at time t (Vt) which is calculated as dose of iohexol administered/serum concentration of iohexol at time t. An estimate of ECFV is also required which can be obtained from body weight (kg) using a second formula
GFR = glomerular filtration rate; ECFV = extracellular fluid volume
The slope-intercept method involves calculation of the the AUC using a one-compartment model. As discussed above this can be created using standard computer software programs such as Excel or manually using graph paper. The intercept (A) is determined by extrapolating the line back to the time 0 intercept and the slope (α) is determined using a standard mathematical approach (y2 – y1/x2 – x1). Clinicians and researchers can therefore calculate clearance accurately using the corrected slope-intercept technique without the need for expensive pharmacokinetic programs (see ‘Case Notes’ on page 745 for a worked example). This method is also considered acceptable by the British Nuclear Medicine Society for determining GFR using radiopharmaceutical markers. 52
Single sample method for cats
A further simplification of the limited sampling technique is to determine GFR from a single plasma sample. Previous approaches in dogs and cats have applied linear or non-linear regression analysis to derive equations for single sample methods from multisample methods and to select the best sampling time.15,20,31,32 These empirical methods have limitations as both clearance determined from a single sample and clearance determined from multiple samples are not independent measurements. Theoretically, this approach would be valid in a patient where the distribution volume is equal to the average distribution volume of patients studied, and renal function is similar to that of the population used to generate the formula. In normal healthy patients this error may be small; however, in patients with abnormal renal function, the range of volume of distribution may be greater and, therefore, the error larger.
There are two prerequisites for single sample methods. The first is knowledge of the volume of distribution of the filtration marker. The volume of distribution of iohexol is considered to be approximately that of the ECFV. 53 The second is that the sample is collected at a time point when GFR is transiently independent of ECFV. 54 This is considered to be when there is complete mixing of marker through the ECFV (ie, the distribution phase can be considered to have reached completion). As renal function declines, this time point is further from the time of administration of the marker.55,56 This is because of the influence of renal function on ECFV and clearance (elimination phase) of the marker at this time. This is in contrast to the initial phase of the distribution exponential which is relatively independent of clearance.
A single sample method of determining GFR based on these theoretical methods has been developed for cats. 57 The formula required for this is presented in Table 2. A measurement of ECFV is required and a formula based on body weight (BW) can be used for this (see Table 2). 57 Optimal sampling time to be 180 mins. 57 It is recommended that in patients with very low GFR, sampling time is delayed. Studies from human patients have suggested delays of up to 8–9 h 55 and up to 24 h. 56 If sampling is performed too early in patients with very low GFR, single sample clearance will overestimate true clearance. The single sample formula remains poorly validated for cats with very low GFR. However, given that the clinical indication for GFR determination is often in patients with normal or near-normal renal function, this method can be considered to be appropriate for most cats.
Standardisation of GFR measurements
The most commonly used method to standardise GFR measurements in cats and dogs is to scale to BW in kg. This assumes that the relationship between GFR and weight is linear. in human patients, GFR measurements are standardised to body surface area (BSA), which is considered to reflect basal metabolic rate and kidney size more closely than BW. A further method for standardising GFR measurements is scaling to ECFV.58,59 it is a logical concept to scale GFR to ECFV since ECFV is closely related to regulation of GFR. Furthermore, the kidney has an important role in maintaining body fluid composition. To assess appropriateness of scaling, the parameter (eg, BW) should correlate with unscaled GFR and when the parameter is correlated with GFR standardised to the parameter (eg, GFR/kg) the correlations should not be significant.
As can be seen from Table 3, BW (kg), BSA (m2) and ECFV (ml) appear to be appropriate methods of standardising GFR in cats. A previous study reported all three methods to be satisfactory for cats; however, only BSA was appropriate in dogs. 36 A further canine paper reported discrepancies between estimated levels of renal function standardised to BW, BSA and ECFV based on ranked measurements of GFR. 50 Some authors have preferred to normalise measurements to BSA in cats.30 –32 However, in obese patients, the increase in BSA will lead to a decrease in GFR/BSA, underestimating GFR. This may explain reports of obesity-related reduction in renal function in human patients. Furthermore, the use of formulae to determine BSA is of questionable accuracy. 60
Table 3.
Standardisation of GFR measurements
| Relationship with GFR (R2)* | P value | |
|---|---|---|
| BW (kg) | 0.73 | <0.001 |
| ECFV (ml) | 0.51 | 0.001 |
| BSA (m2) | 0.73 | <0.001 |
| GFR/kg | 0.006 | 0.760 |
| GFR/ml | 0.001 | 0.885 |
| GFR/m2 | 0.006 | 0.760 |
Relationship evaluated in 18 cats
There is a significant relationship between body weight (BW), extracellular fluid volume (ECFV), body surface area (BSA) and glomerular filtration rate (GFR), and a non-significant relationship between GFR standardised to the parameter and GFR, indicating all three methods of standardisation are appropriate in cats. Data from Finch 12
The cat correction formula 40 for slope-intercept clearance requires standardisation to BW.
Reference intervals for GFR in cats
Despite several published studies determining GFR in cats, reference intervals remain poorly defined. Variations in filtration marker used, method followed and study population are likely to influence GFR measurement. Therefore, it is important that for each clearance protocol a separate reference interval is established. The derived reference interval for GFR determined using slope-intercept iohexol clearance in 25 healthy, non-azotaemic (plasma creatinine <140 µmol/l) cats was 0.92–2.88 ml/min/kg. 12 An earlier study reported a reference interval of 1.02–3.50 ml/min/kg 28 for iohexol clearance in cats. The reference interval that can be determined from the mean and standard deviation reported in a further study in healthy cats was 1.30–4.2 ml/min/kg. 36
Establishment of a single reference interval may be inappropriate as filtration rate may be affected by sex, breed and age. Kittens are reported to have a higher GFR than adult cats. 61 Sex differences in GFR are reported in dogs 62 and suggested in cats. 12 Breed effects on creatinine concentration have also been reported;63,64 however, whether this related to GFR remains to be studied. Therefore, a decline in GFR over time in an individual patient may be important in detecting kidney disease. The decline must represent a clinically relevant change rather than physiological variation. The coefficient of variation in healthy cats is reported to be <20% 65 and, therefore, a decline >20% is likely to be clinically significant. However, studies to fully evaluate this are required.

Estimated GFR formulae
GFR is routinely estimated from creatinine concentrations in human patients using prediction equations which take account of factors such as age, gender, race and body size that are considered to influence muscle mass.66 –68 Estimated GFR (eGFR) formulae offer the advantage of more accurately reflecting actual GFR than serum creatinine in human patients. it is now mandatory for eGFR to be reported with every creatinine measurement performed in human patients in several states in the USA, as well as in the UK and Australia, 69 highlighting the importance of such formulae. These eGFR formulae appear to offer some advantage over serum creatinine alone in assessment of renal function. Following introduction of reporting of eGFR alongside creatinine concentration, recognition of CKD by doctors increased from 27% to 85% of cases. 70
However, the precision and accuracy of the formulae is questionable, particularly in elderly patients or patients with extremes of muscle mass and in patients with unstable renal function. Furthermore, the earlier formulae66,68 may underestimate true GFR, leading to misclassification of some patients as having CKD. Clinical concerns regarding accuracy of the formulae in all patient populations, sensitivity and specificity of the formulae and their use to adjust drug dosages have been expressed. Nevertheless, they appear to be a better screening test than plasma creatinine concentration. 71
Attempts to validate an eGFR formula in cats have been made; however, it was not found to offer any improvement in predicting GFR than creatinine alone. 72 As the formula does not provide a reliable estimate of GFR in cats, its routine use cannot be recommended. Further studies to validate an eGFR for cats are required.
Key Points
The inherent difficulties associated with performing renal clearance and multisample plasma clearance measurements, and also calculation of clearance using different pharmacokinetic analyses, may pose conceptual as well as practical difficulties for veterinary practitioners. Therefore, GFR measurement may typically only be considered by clinicians and researchers with specialist knowledge of the area.
This review, however, describes a single sample approach that accurately determines GFR. It involves the administration of a bolus dose of iohexol, collection of a single plasma sample at 180 mins and estimation of ECFV based on BW.
The technique offers a simple, attractive and cost-effective approach, which could feasibly be employed by veterinary practitioners for assessing renal function in cats.
In addition, the corrected slope-intercept method, although requiring the collection of three blood samples, can be achieved in practice without the use of pharmaco modelling programs.
Given the recognised limitations of urea and creatinine concentration and USG for evaluating renal function, determination of GFR will remain important in early identification and accurate assessment of stage of CKD in ca
Supplemental Material
Details of laboratories and methods of analysis for measuring iohexol employed by the laboratory
Acknowledgments
The author would like to thank Professor Jonathan Elliott and Professor Harriet Syme for their supervision during the studies which formed part of the author’s PhD at the Royal Veterinary College, London. The author would also like to thank Reidun Heiene and Professor AM Peters for advice regarding GFR measurement.
Footnotes
Funding: The author received no specific grant from any funding agency in the public, commercial or not-for-profit sectors for the preparation of this article.
The author declares that there is no conflict of interest.
References
- 1. Rose D, Post T. Introduction to renal function. in: Rose D, Post T. (eds). Clinical physiology of acid-base and electrolyte disorders. 5th ed. New York, McGraw-Hill, 2001, pp 3–20. [Google Scholar]
- 2. Dibartola SP. Applied renal physiology. in: Dibartola SP. (ed). Fluid, electrolyte and acid-base disorders in small animal practice. 3rd ed. St Louis, MO: Saunders Elsevier, 2006, pp 26–44. [Google Scholar]
- 3. Brown SA, Brown CA. Single-nephron adaptations to partial renal ablation in cats. Am J Physiol 1995; 38: R1002–R1008. [DOI] [PubMed] [Google Scholar]
- 4. Brown SA. Determinants of glomerular ultrafiltration in cats. Am J Vet Res 1993; 54: 970–975. [PubMed] [Google Scholar]
- 5. Ross LA, Finco DR. Relationship of selected clinical renal-function tests to glomerular-filtration rate and renal blood-flow in cats. Am J Vet Res 1981; 42: 1704–1710. [PubMed] [Google Scholar]
- 6. Chakrabarti S, Syme HM, Elliott J. Clinicopathological variables predicting progression of azotemia in cats with chronic kidney disease. J Vet Intern Med 2012; 26: 275–281. [DOI] [PubMed] [Google Scholar]
- 7. Perrone RD, Madias NE, Levey AS. Serum creatinine as an index of renal function: new insights into old concepts. Clin Chem 1992; 38: 1933–1953. [PubMed] [Google Scholar]
- 8. Braun JP, Cabe E, Geffre A, et al. Comparison of plasma creatinine values measured by different veterinary practices. Vet Rec 2008; 162: 215–216. [DOI] [PubMed] [Google Scholar]
- 9. Ulleberg T, Robben J, Nordahl KM, et al. Plasma creatinine in dogs: intra- and inter-laboratory variation in 10 European veterinary laboratories. Acta Vet Scand 2011; 53: 25. [DOI] [PMC free article] [PubMed] [Google Scholar]
- 10. Walker JB. Creatine: biosynthesis, regulation, and function. Adv Enzymol Relat Areas Mol Biol 1979; 50: 177–242. [DOI] [PubMed] [Google Scholar]
- 11. Watson AD, Lefebvre HP, Concordet D, et al. Plasma exogenous creatinine clearance test in dogs: comparison with other methods and proposed limited sampling strategy. J Vet Intern Med 2002; 16: 22–33. [DOI] [PubMed] [Google Scholar]
- 12. Finch NC. Predicting the development of azotaemia in geriatric cats. PhD Thesis, Royal Veterinary College, 2011. [Google Scholar]
- 13. Finch NC, Syme HM, Elliott J. The diagnostic utility of routine renal markers for predicting glomerular filtration rate (GFR). Proceedings of the BSAVA congress; 2013 April 4–7; Birmingham, England. p 569. [Google Scholar]
- 14. Bailey DB, Rassnick KM, Prey JD, et al. Evaluation of serum iohexol clearance for use in predicting carboplatin clearance in cats. Am J Vet Res 2009; 70: 1135–1140. [DOI] [PubMed] [Google Scholar]
- 15. Barthez PY, Chew DJ, diBartola SP. Simplified methods for estimation of Tc-99m-pentetate and I-131-orthoiodohippurate plasma clearance in dogs and cats. J Vet Intern Med 2001; 15: 200–208. [DOI] [PubMed] [Google Scholar]
- 16. Barthez PY, Chew DJ, diBartola SP. Effect of sample number and time on determination of plasma clearance of technetium Tc 99m pentetate and orthoiodohippurate sodium I 131 in dogs and cats. Am J Vet Res 2000; 61: 280–285. [DOI] [PubMed] [Google Scholar]
- 17. Rogers KS, Komkov A, Brown SA, et al. Comparison of four methods of estimating glomerular filtration rate in cats. Am J Vet Res 1991; 52: 961–964. [PubMed] [Google Scholar]
- 18. Russo EA, Lees GE, Hightower D. Evaluation of renal function in cats, using quantitative urinalysis. Am J Vet Res 1986; 47: 1308–1312. [PubMed] [Google Scholar]
- 19. McClellan JM, Goldstein RE, Erb HN, et al. Effects of administration of fluids and diuretics on glomerular filtration rate, renal blood flow, and urine output in healthy awake cats. Am J Vet Res 2006; 67: 715–722. [DOI] [PubMed] [Google Scholar]
- 20. Vandermeulen E, van Hoek i, De Sadeleer C, et al. A single sample method for evaluating (51)chromium-ethylene diaminic tetraacetic acid clearance in normal and hyperthyroid cats. J Vet Intern Med 2008; 22: 266–272. [DOI] [PubMed] [Google Scholar]
- 21. Uribe D, Krawiec DR, Twardock AR, et al. Quantitative renal scintigraphic determination of the glomerular-filtration rate in cats with normal and abnormal kidney-function, using Tc-99m-diethylenetriaminepentaacetic acid. Am J Vet Res 1992; 53: 1101–1107. [PubMed] [Google Scholar]
- 22. van Hoek I, Vandermeulen E, Duchateau L, et al. Comparison and reproducibility of plasma clearance of exogenous creatinine, exo-iohexol, endo-iohexol, and 51Cr-EDTA in young adult and aged healthy cats. J Vet Intern Med 2007; 21: 950–958. [DOI] [PubMed] [Google Scholar]
- 23. van Hoek I, Lefebvre HP, Kooistra HS, et al. Plasma clearance of exogenous creatinine, exo-iohexol, and endo-iohexol in hyperthyroid cats before and after treatment with radio-iodine. J Vet Intern Med 2008; 22: 879–885. [DOI] [PubMed] [Google Scholar]
- 24. van Hoek IM, Lefebvre HP, Paepe D, et al. Comparison of plasma clearance of exogenous creatinine, exo-iohexol, and endo-iohexol over a range of glomerular filtration rates expected in cats. J Feline Med Surg 2009; 11: 1028–1030. [DOI] [PMC free article] [PubMed] [Google Scholar]
- 25. Le Garreres A, Laroute V, De La Farge F, et al. Disposition of plasma creatinine in non-azotaemic and moderately azotaemic cats. J Feline Med Surg 2007; 9: 89–96. [DOI] [PMC free article] [PubMed] [Google Scholar]
- 26. Miyamoto K. Evaluation of single-injection method of inulin and creatinine as a renal function test in normal cats. J Vet Med Sci 1998; 60: 327–332. [DOI] [PubMed] [Google Scholar]
- 27. Sapirstein LA, Vidt DG, Mandel MJ, et al. Volumes of distribution and clearances of intravenously injected creatinine in the dog. Am J Physiol 1955; 181: 330–336. [DOI] [PubMed] [Google Scholar]
- 28. Heiene R, Reynolds BS, Bexfield NH, et al. Estimation of glomerular filtration rate via 2- and 4-sample plasma clearance of iohexol and creatinine in clinically normal cats. Am J Vet Res 2009; 70: 176–185. [DOI] [PubMed] [Google Scholar]
- 29. Steinbach S, Binkert B, Schweighauser A, et al. Quantitative assessment of urea generation and elimination in healthy dogs and in dogs with chronic kidney disease. J Vet Intern Med 2010; 24: 1283–1289. [DOI] [PubMed] [Google Scholar]
- 30. Haller M, Rohner K, Muller W, et al. Single-injection inulin clearance for routine measurement of glomerular filtration rate in cats. J Feline Med Surg 2003; 5: 175–181. [DOI] [PMC free article] [PubMed] [Google Scholar]
- 31. Miyagawa Y, Takemura N, Hirose H. Evaluation of a single sampling method for estimation of plasma iohexol clearance in dogs and cats with various kidney functions. J Vet Med Sci 2010; 72: 271–278. [DOI] [PubMed] [Google Scholar]
- 32. Goy-Thollot I, Besse S, Garnier F, et al. Simplified methods for estimation of plasma clearance of iohexol in dogs and cats. J Vet Intern Med 2006; 20: 52–56. [DOI] [PubMed] [Google Scholar]
- 33. Miyamoto K. Clinical application of plasma clearance of iohexol on feline patients. J Feline Med Surg 2001; 3: 143–147. [DOI] [PMC free article] [PubMed] [Google Scholar]
- 34. Miyamoto K. Use of plasma clearance of iohexol for estimating glomerular filtration rate in cats. Am J Vet Res 2001; 62: 572–575. [DOI] [PubMed] [Google Scholar]
- 35. Goodman LA, Brown SA, Torres BT, et al. Effects of meloxicam on plasma iohexol clearance as a marker of glomerular filtration rate in conscious healthy cats. Am J Vet Res 2009; 70: 826–830. [DOI] [PubMed] [Google Scholar]
- 36. Goy-Thollot I, Chafotte C, Besse S, et al. Iohexol plasma clearance in healthy dogs and cats. Vet Radiol Ultrasound 2006; 47: 168–173. [DOI] [PubMed] [Google Scholar]
- 37. Boag AK, Neiger R, Slater L, et al. Changes in the glomerular filtration rate of 27 cats with hyperthyroidism after treatment with radioactive iodine. Vet Rec 2007; 161: 711–715. [DOI] [PubMed] [Google Scholar]
- 38. Miyamoto K. Evaluation of plasma clearance of inulin in clinically normal and partially nephrectomized cats. Am J Vet Res 2001; 62: 1332–1335. [DOI] [PubMed] [Google Scholar]
- 39. Foster SJ, Sovak M. Isomerism in iohexol and ioxilan. Analysis and implications. Invest Radiol 1988; 23 Suppl 1: S106–S109. [DOI] [PubMed] [Google Scholar]
- 40. Finch NC, Syme HM, Elliott J, et al. Glomerular filtration rate estimation by use of a correction formula for slope-intercept plasma iohexol clearance in cats. Am J Vet Res 2011; 72: 1652–1659. [DOI] [PubMed] [Google Scholar]
- 41. Mutzel W, Speck U. Pharmacokinetics and biotransformation of iohexol in the rat and the dog. Acta Radiol Suppl 1980; 362: 87–92. [PubMed] [Google Scholar]
- 42. Laroute V, Lefebvre HP, Costes G, et al. Measurement of glomerular filtration rate and effective renal plasma flow in the conscious beagle dog by single intravenous bolus of iohexol and p-aminohippuric acid. J Pharmacol Toxicol Methods 1999; 41: 17–25. [DOI] [PubMed] [Google Scholar]
- 43. Krutzen E, Back SE, Nilsson-Ehle I, et al. Plasma clearance of a new contrast agent, iohexol: a method for the assessment of glomerular filtration rate. J Lab Clin Med 1984; 104: 955–961. [PubMed] [Google Scholar]
- 44. Soman RS, Zahir H, Akhlaghi F. Development and validation of an HPLC-UV method for determination of iohexol in human plasma. J Chromatogr B Analyt Technol Biomed Life Sci 2005; 816: 339–343. [DOI] [PubMed] [Google Scholar]
- 45. DiStefano JJ, 3rd., Noncompartmental vs. compartmental analysis: some bases for choice. Am J Physiol 1982; 243: R1–R6. [DOI] [PubMed] [Google Scholar]
- 46. Brochner-Mortensen J. A simple method for the determination of glomerular filtration rate. Scand J Clin Lab Invest 1972; 30: 271–274. [DOI] [PubMed] [Google Scholar]
- 47. Heiene R, Moe L. Pharmacokinetic aspects of measurement of glomerular filtration rate in the dog: a review. J Vet Intern Med 1998; 12: 401–414. [DOI] [PubMed] [Google Scholar]
- 48. Chantler C, Barratt TM. Estimation of glomerular filtration rate from plasma clearance of 51-chromium edetic acid. Arch Dis Child 1972; 47: 613–617. [DOI] [PMC free article] [PubMed] [Google Scholar]
- 49. Brochner-Mortensen J, Haahr J, Christoffersen J. A simple method for accurate assessment of the glomerular filtration rate in children. Scand J Clin Lab Invest 1974; 33: 140–143. [PubMed] [Google Scholar]
- 50. Heiene R, Moe L. The relationship between some plasma clearance methods for estimation of glomerular filtration rate in dogs with pyometra. J Vet Intern Med 1999; 13: 587–596. [DOI] [PubMed] [Google Scholar]
- 51. Bird NJ, Michell AR, Peters AM. Accurate measurement of extracellular fluid volume from the slope/intercept technique after bolus injection of a filtration marker. Physiol Meas 2009; 30: 1371–1379. [DOI] [PubMed] [Google Scholar]
- 52. Fleming JS, Zivanovic MA, Blake GM, et al. Guidelines for the measurement of glomerular filtration rate using plasma sampling. Nucl Med Commun 2004; 25: 759–769. [DOI] [PubMed] [Google Scholar]
- 53. Olsson B, Aulie A, Sveen K, et al. Human pharmacokinetics of iohexol. A new nonionic contrast medium. Invest Radiol 1983; 18: 177–182. [DOI] [PubMed] [Google Scholar]
- 54. Bird NJ, Peters C, Michell AR, et al. Effect of extracellular fluid volume on single-sample measurement of glomerular filtration rate. Nephrol Dial Transplant 2009; 24: 104–108. [DOI] [PubMed] [Google Scholar]
- 55. Jacobsson L. A method for the calculation of renal clearance based on a single plasma sample. Clin Physiol 1983; 3: 297–305. [DOI] [PubMed] [Google Scholar]
- 56. Sterner G, Frennby B, Hultberg B, et al. Iohexol clearance for GFR-determination in renal failure – single or multiple plasma sampling? Nephrol Dial Transplant 1996; 11: 521–525. [PubMed] [Google Scholar]
- 57. Finch NC, Heiene R, Elliott J, et al. A single sample method for estimating glomerular filtration rate in cats. J Vet Intern Med 2013; 27: 782–790. [DOI] [PubMed] [Google Scholar]
- 58. Peters AM. Expressing glomerular filtration rate in terms of extracellular fluid volume. Nephrol Dial Transplant 1992; 7: 205–210. [DOI] [PubMed] [Google Scholar]
- 59. Bird NJ, Peters C, Michell AR, et al. Suitability of a simplified technique based on iohexol for decentralized measurement of glomerular filtration rate. Scand J Urol Nephrol 2008; 42: 472–480. [DOI] [PubMed] [Google Scholar]
- 60. Price GS, Frazier DL. Use of body surface area (BSA)-based dosages to calculate chemotherapeutic drug dose in dogs: I. Potential problems with current BSA formulae. J Vet Intern Med 1998; 12: 267–271. [DOI] [PubMed] [Google Scholar]
- 61. Hoskins JD, Turnwald GH, Kearney MT, et al. Quantitative urinalysis in kittens from four to thirty weeks after birth. Am J Vet Res 1991; 52: 1295–1299. [PubMed] [Google Scholar]
- 62. Izzat NN, Rosborough JP. Renal function in conscious dogs: potential effect of gender on measurement. Res Exp Med 1989; 189: 371–379. [DOI] [PubMed] [Google Scholar]
- 63. Reynolds BS, Concordet D, Germain CA, et al. Breed dependency of reference intervals for plasma biochemical values in cats. J Vet Intern Med 2010; 24: 809–818. [DOI] [PubMed] [Google Scholar]
- 64. Paltrinieri S, Ibba F, Rossi G. Haematological and bio-chemical reference intervals of four feline breeds. J Feline Med Surg 2014; 16: 125–136. [DOI] [PMC free article] [PubMed] [Google Scholar]
- 65. Pelligand L, Lees P, Elliott J. Development and validation of a timed urinary collection system for use in the cat. Lab Anim 2011; 45: 196–203. [DOI] [PubMed] [Google Scholar]
- 66. Cockcroft DW, Gault MH. Prediction of creatinine clearance from serum creatinine. Nephron 1976; 16: 31–41. [DOI] [PubMed] [Google Scholar]
- 67. Levey AS, Stevens LA, Schmid CH, et al. A new equation to estimate glomerular filtration rate. Ann Intern Med 2009; 150: 604–612. [DOI] [PMC free article] [PubMed] [Google Scholar]
- 68. Levey AS, Bosch JP, Lewis JB, et al. A more accurate method to estimate glomerular filtration rate from serum creatinine: a new prediction equation. Modification of Diet in Renal Disease Study Group. Ann Intern Med 1999; 130: 461–470. [DOI] [PubMed] [Google Scholar]
- 69. Glassock RJ, Winearls C. Ageing and the glomerular filtration rate: truths and consequences. Trans Am Clin Climatol Assoc 2009; 120: 419–428. [PMC free article] [PubMed] [Google Scholar]
- 70. James MT, Hemmelgarn BR, Tonelli M. Early recognition and prevention of chronic kidney disease. Lancet 2010; 375: 1296–1309. [DOI] [PubMed] [Google Scholar]
- 71. Martin JH, Fay MF, Ungerer JP. eGFR – use beyond the evidence. Med J Aust 2009; 190: 197–199. [DOI] [PubMed] [Google Scholar]
- 72. Finch NC, Brodbelt DS, Syme HM, et al. Prediction formulae for fat free mass (FFM) and estimated glomerular filtration rate (eGFR) in cats [abstract]. J Vet Intern Med 2010; 24: 1548. [Google Scholar]
Associated Data
This section collects any data citations, data availability statements, or supplementary materials included in this article.
Supplementary Materials
Details of laboratories and methods of analysis for measuring iohexol employed by the laboratory