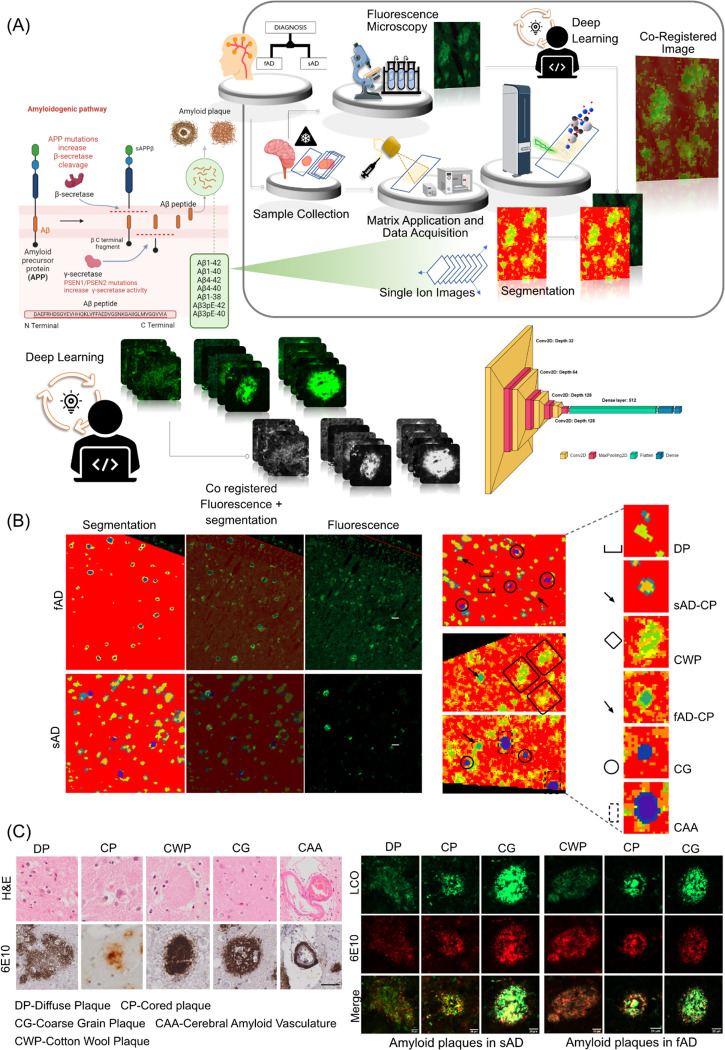
Figure 1: Spatial segmentation of the matrix assisted laser desorption/ionization mass spectrometry (MALDI-MS) imaging data from individuals with sporadic Alzheimer’s disease (sAD) and familial AD patients (fAD).
(B) Regions of interest marking qhFTAA based fluorescent amyloid staining of sections from sAD and fAD brain tissues. Registration of fluorescent images with pseudoclusters obtained through spatial segmentation of MALDI MS imaging data. Alignment of amyloid plaques with the pseudoclusters indicates the presence of different plaque morphologies. Spatial segmentation of MALDI MS imaging data and. (C) Visualization of diffuse plaque, cored plaque and coarse grain plaque in sAD and cotton wool plaque, cored plaque and coarse grain plaque in fAD cases through LCO/antiAβ(6E10) co staining. Scale bar: 20μm. Visualizations of diffuse plaque, cored plaque, cotton wool plaque, coarse grain plaque and amyloid vasculature through H&E and antiAβ(6E10) staining. Scale bar: 40μm

