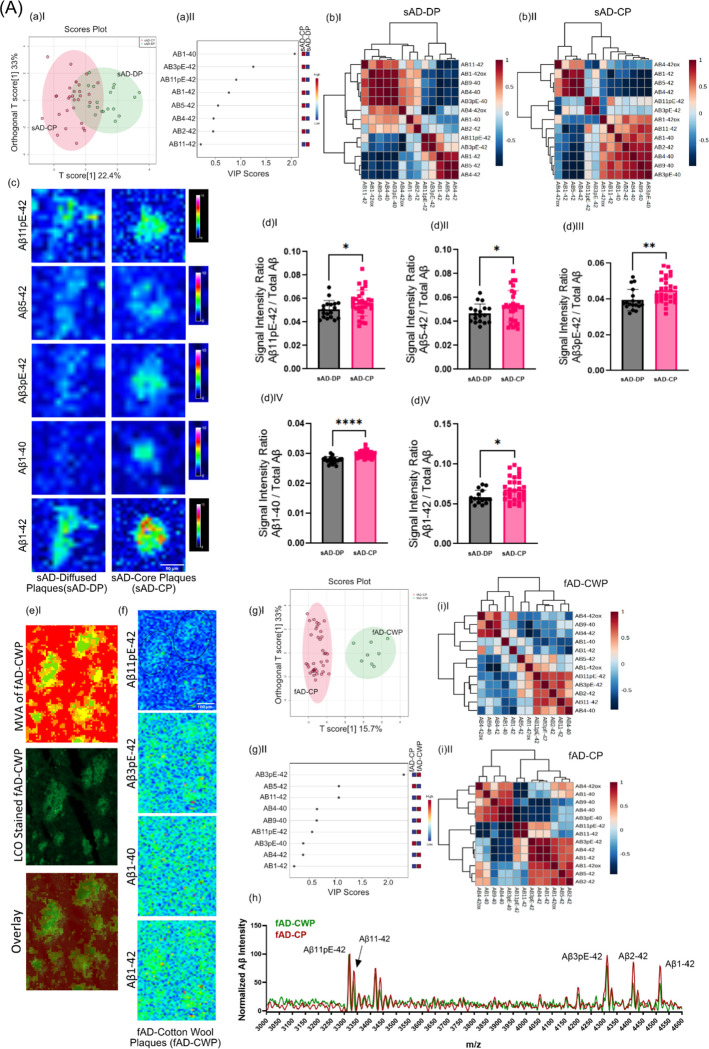
Figure 3: (A) Differences in between fibrillar and non-fibrillar plaques in sAD and fAD.
(a I) OPLS-DA separating sAD-DP and sAD-CP (a II) VIP scores indicating peptides which separates sAD-DP from sAD-CP plaques. (b) Clustered intensity heatmap from the individual plaques indicate overlapping separation of sAD-DP and sAD-CP population (OPLS model characteristics: R2X-0.224; R2Y-0.471; Q2–0.44)(c) MALDI MSI single ion images of amyloidβ (Aβ) peptides. Scalebar: 50μm. (d)I-V univariate group statistics for signal intensity of Aβ species normalized to total Aβ (number of patients: n=9 (sAD), number of plaques per type and patient N=4–6). Characterization of Cotton Wool Plaques. (e) HCA based image analysis of fAD brain tissue (red) together with LCO imaging (green) identifies CWP associated MSI profiles and (f) Single ion images. g(I-II) Clustered intensity heatmap from the individual plaques indicate overlapping separation of fAD-CWP and fAD-CP population (OPLS model characteristics: R2X-0.157; R2Y-0.737; Q2–0.604) (h) average mass spectra show relatively higher degrees of pyroglutamated species as compared to Aβ1–42. Pearson’s correlation matrix of Aβ peptides in (i)I fAD-CWP, (i)II fAD-CP

