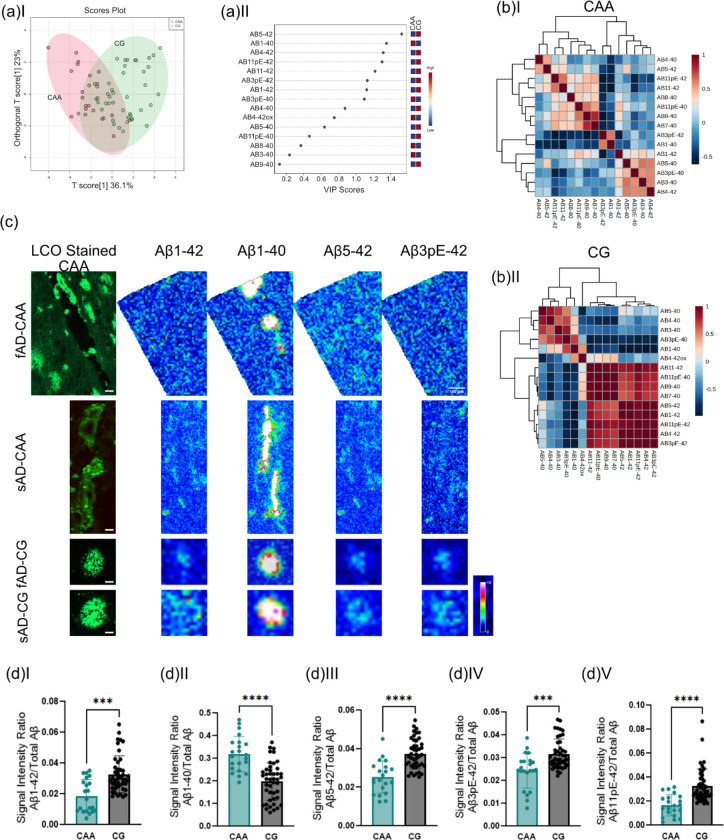
Figure 6. Coarse grain plaques display amyloid signatures designative to CAA.
(a) OPLS-DA of CAA and CG plaques show partial separation (OPLS model characteristics: R2X-0.329; R2Y-0.439; Q2–0.402) and (b) VIP scores. (c) Single ion maps of different Aβ species. Scalebar = 50μm. (D) Univariate comparison between CAA and CG. *p<0.05, **p<0.01, ***p<0.001, ****p<0.0001 Number of patients n=8 (sAD), n=5 (fAD); number of plaques N=21 (CAA), N=43 (CG)

