

Abstract
Goal: To establish Pulse2AI as a reproducible data preprocessing framework for pulsatile signals that generate high-quality machine-learning-ready datasets from raw wearable recordings. Methods: We proposed an end-to-end data preprocessing framework that adapts multiple pulsatile signal modalities and generates machine-learning-ready datasets agnostic to downstream medical tasks. Results: a dataset preprocessed by Pulse2AI improved systolic blood pressure estimation by 29.58%, from 11.41 to 8.03 mmHg in root-mean-square-error (RMSE) and its diastolic counterpart by 26.01%, from 7.93 to 5.87 mmHg in RMSE. For respiration rate (RR) estimation, Pulse2AI boosted performance by 19.69%, from 1.47 to 1.18 breaths per minute (BrPM) in mean-absolute-error (MAE). Conclusion: Pulse2AI turns pulsatile signals into machine learning (ML) ready datasets for arbitrary remote health monitoring tasks. We tested Pulse2AI on multiple pulsatile modalities and demonstrated its efficacy in two medical applications. This work bridges valuable assets in remote sensing and internet of medical things to ML-ready datasets for medical modeling.
Keywords: IoMT, ML for Healthcare, Bridge2AI, wearable pulsatile signals, signal processing
I. Introduction
Machine learning (ML) and artificial intelligence (AI) have been extensively applied in medical researches, particularly in remote and wearable healthcare [1]. The prevalence of wearable sensors and the Internet of Medical Things (IoMT) has provided abundant pulsatile biomarker recordings to enhance remote ML for health applications (e.g., physiological parameter estimations and continuous health monitoring). With the deployment of these sensors in free-living environments, however, come challenges in maintaining clean data stream. Sensor misplacement, motion artifacts, and electromagnetic disturbance introduce extensive noises and additional challenges such as context identification [2], [3]. Noise-infused biomarkers can significantly impact the quality of ML models and lead to poor estimation outcomes [1], [4]. The National Institutes of Health in the United States has identified this as a significant area for needed growth, creating the Bridge2AI program for seeking solutions for the capture and validation of IoMT data in free-living environments for medical modeling and preparing ML-ready dataset in FAIR (findable, accessible, interoperable, and reusable) fashion [5].
A. Related Works
Denoising biomedical recordings from IoMT devices is a vital preprocessing step toward ML-ready dataset. Adaptive filters [6] and wavelet-based signal transformation [7], [8] remove embedded noise, but inevitably distort the signal morphologies [4], [9]. To minimize signal transformation, signal quality index (SQI) was introduced to measure and reject noises based on defined quality thresholds [10]. Various SQI metrics were proposed: some researchers utilized the similarity of a pulse segment versus its consecutive neighbors to compose signal quality-driven SQI [11]. Many believed cardiac morphologies represent cardiac pulse quality and proposed the morphology-driven SQI metric by rejecting signals with implausible (outlier) morphologies with empirically defined thresholds [12], [13], [14]. Some proposed deep learning (DL)-driven SQI assessments by detecting outliers [15] or classifying noisy segments [1], [2], [3]. All three approaches measured SQIs and reject noisy segments without distorting clean signal.
In contrast, many ML for healthcare applications preprocessed pulsatile recordings for models by applying light frequency filtering to remove noise from implausible frequencies, and constructed complex ML architectures to handle noise by automatic feature extraction [6], [7], [8], [9], [16]. Despite success in improving performance, ML models trained with excessive noise often led to decreased generalizability and overfitting [1], [4], [10], [11]. Although the above denoising methods were proposed to improve the signal quality of wearable pulsatile recordings captured in free-living environments, they raised limited awareness of the downstream applications.
B. Downstream Contribution
One downstream medical application is hypertension monitoring through continuous blood pressure (BP) capture. Periods of sustained, elevated BP lead to cardiovascular disease and risk of premature death [12], [13]. Although ambulatory BP measurements are found to be more clinically accurate and predictive of adverse events and diagnosing difficult-to-detect cases of adverse hypertension [17], they are often limited to infrequent measurements, expensive and uncomfortable, limiting their longitudinal use [18]. To overcome these limitations, new IoMT sensing paradigms capture BP in a remote and ambulatory fashion without the limitations of cuff-based ambulatory BP devices [19]. Cuffless wearable sensors that record blood pulsatile activity [20] combined with ML-based BP estimations provide a potential solution to continuous BP monitoring with comfort and affordability to users and longer sequences and frequent recordings for clinicians [2], [21].
Respiration rate (RR) estimation is another important medical application as it antecedes possible physiological deterioration [22], [23]. Invasive RR estimation methods such as capnography and flow thermography were widely deployed in ICUs and other emergency care settings but were too cumbersome and expensive for general rehabilitation centers and ambulatory monitoring [24]. Noninvasive RR estimations such as manual counting are prone to errors and impossible for nocturnal studies [25]. IoMT sensors have drawn attention to noninvasive and mobile RR estimation by providing abundant correlated pulsatile vitals [22]. Therefore, various automatic RR estimation algorithms were proposed to elevate accuracy and reliability [24], [25], [26]. Recently, Shuzan et al. demonstrated the efficacy of ML models by elevating the SOTA performance for RR estimation over various algorithms [27].
However, there is a lack of a standardized preprocessing framework that incorporates the above filtering strategies to prepare a reproducible AI/ML-ready dataset for various pulsatile signal modalities, especially for medical modeling applications. Towards building a standardized preprocessing paradigm and supplying clean IoMT data for medical biomarker estimation, we introduce Pulse2AI as an end-to-end preprocessing framework that extracts clean cardiac cycles (heart beats) from pulsatile signals of IoMT cardio-sensors in a time-series fashion and supplies ML-ready feature modalities agnostic to downstream medical applications. We explain the architecture of PulseAI in Section II, then evaluate it in Section III on two datasets and quantify its performance amplifications on two medical applications.
Our contributions are as followed:
-
•
Investigating the challenges in preprocessing wearable data captured in free-living environments for downstream ML for Healthcare models.
-
•
Introducing an end-to-end parametric framework that provides ML-ready dataset for a specified downstream ML model via automatic grid searching on noise rejection parameters.
-
•
Presenting an ablation study on the effectiveness of grid searching noise rejection parameters and its impact on the downstream applications of BP estimation and RR estimation.
II. Materials and Methods
We present Pulse2AI as a ML-ready dataset maker that validates remote health and IoMT signals and extract biomarkers in Fig. 1. We first segmented signals into a list of cardiac cycles and implemented a two-pass signal alignment to synchronize pulsatile signals with respective references. We then formulated three filters based on different SQI methodologies. This section reviews our designed framework, consisting of cardiac cycle segmentation, two-pass signal alignment and three SQI-based noise filtering, parameterized for fine-tuning, and validation of signal quality detection.
Fig. 1.
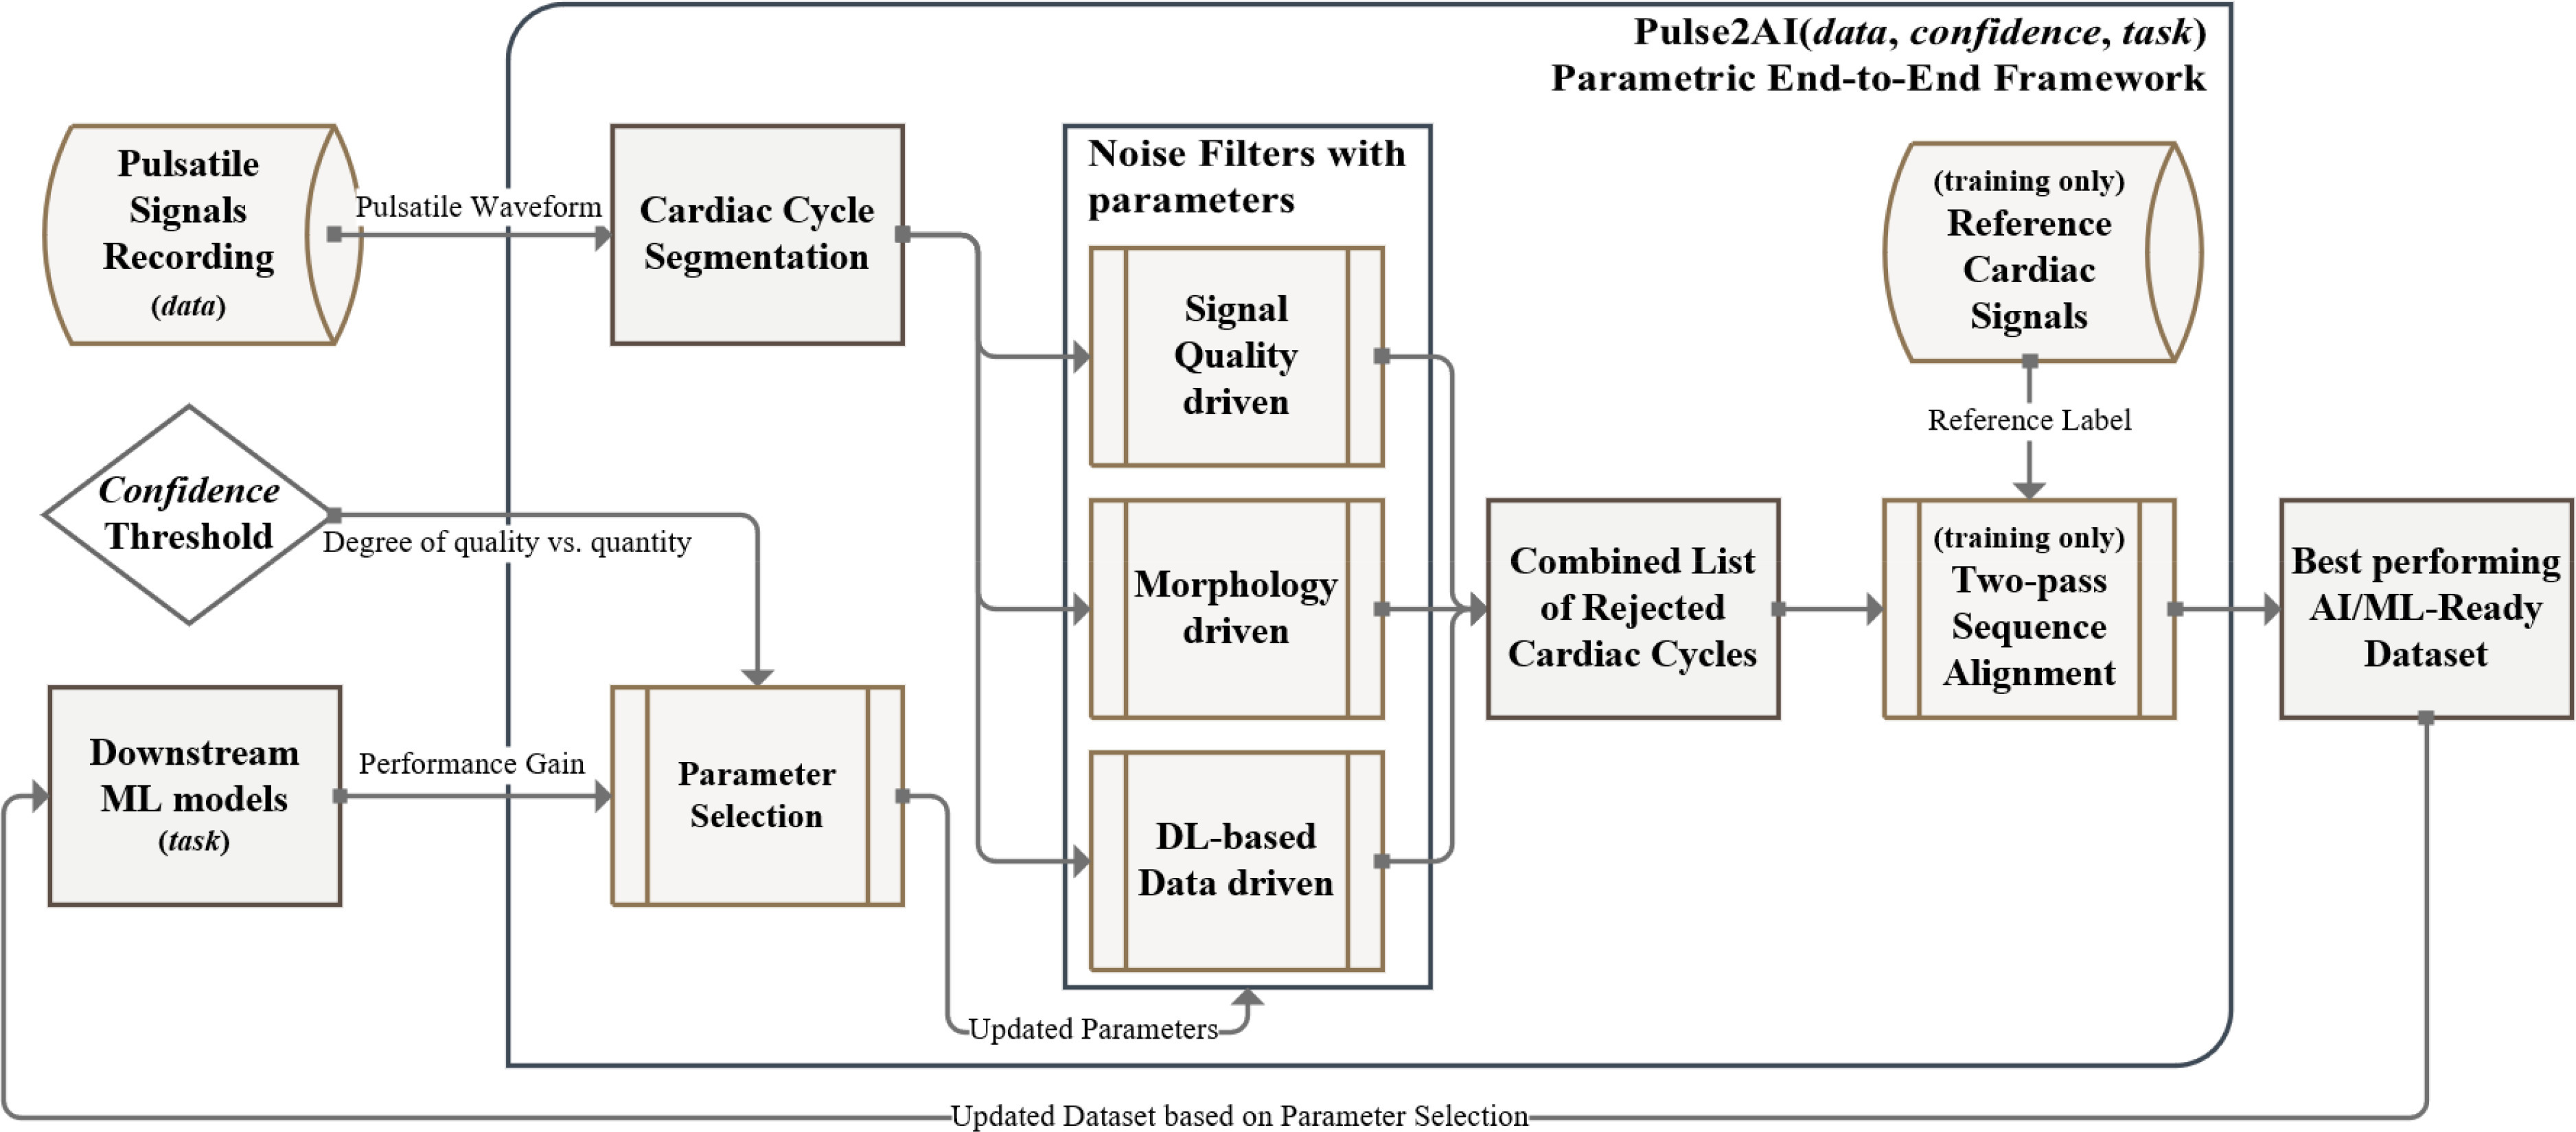
Overview of the Pulse2AI framework: the framework optimizes preprocessing specific to the dataset, confidence, and medical task. Each filter assesses data qualities individually, a cardiac cycle will be rejected if failed to pass the threshold.
A. Cardiac Cycle Segmentation
We started with applying a minimum-order, zero-phase, infinite impulse response (IIR) bandpass filter of (0.6–3 Hz) with forward-backward filtering technique to preserve phase relationships while filtering out noises and harmonics. The selected principal frequency range corresponds to cardiac cycle range of 40–180 beats per minute (BPM) and aligns with normal range of sustained pulse rates found in previous literature [28], [29].
Then we performed signal abstraction and segmented the cardiac cycles based on fiducial points identified in Fig. 2 [30]. We segmented the signals into sliding windows of 0.8 seconds with 0.2 second overlap and identified peaks/feet from local maxima/minima; we identified maximum slopes (shown in Fig. 3) and inflection points via first gradients and third gradients. For bio-impedance, the approach was similar but inverse.
Fig. 2.
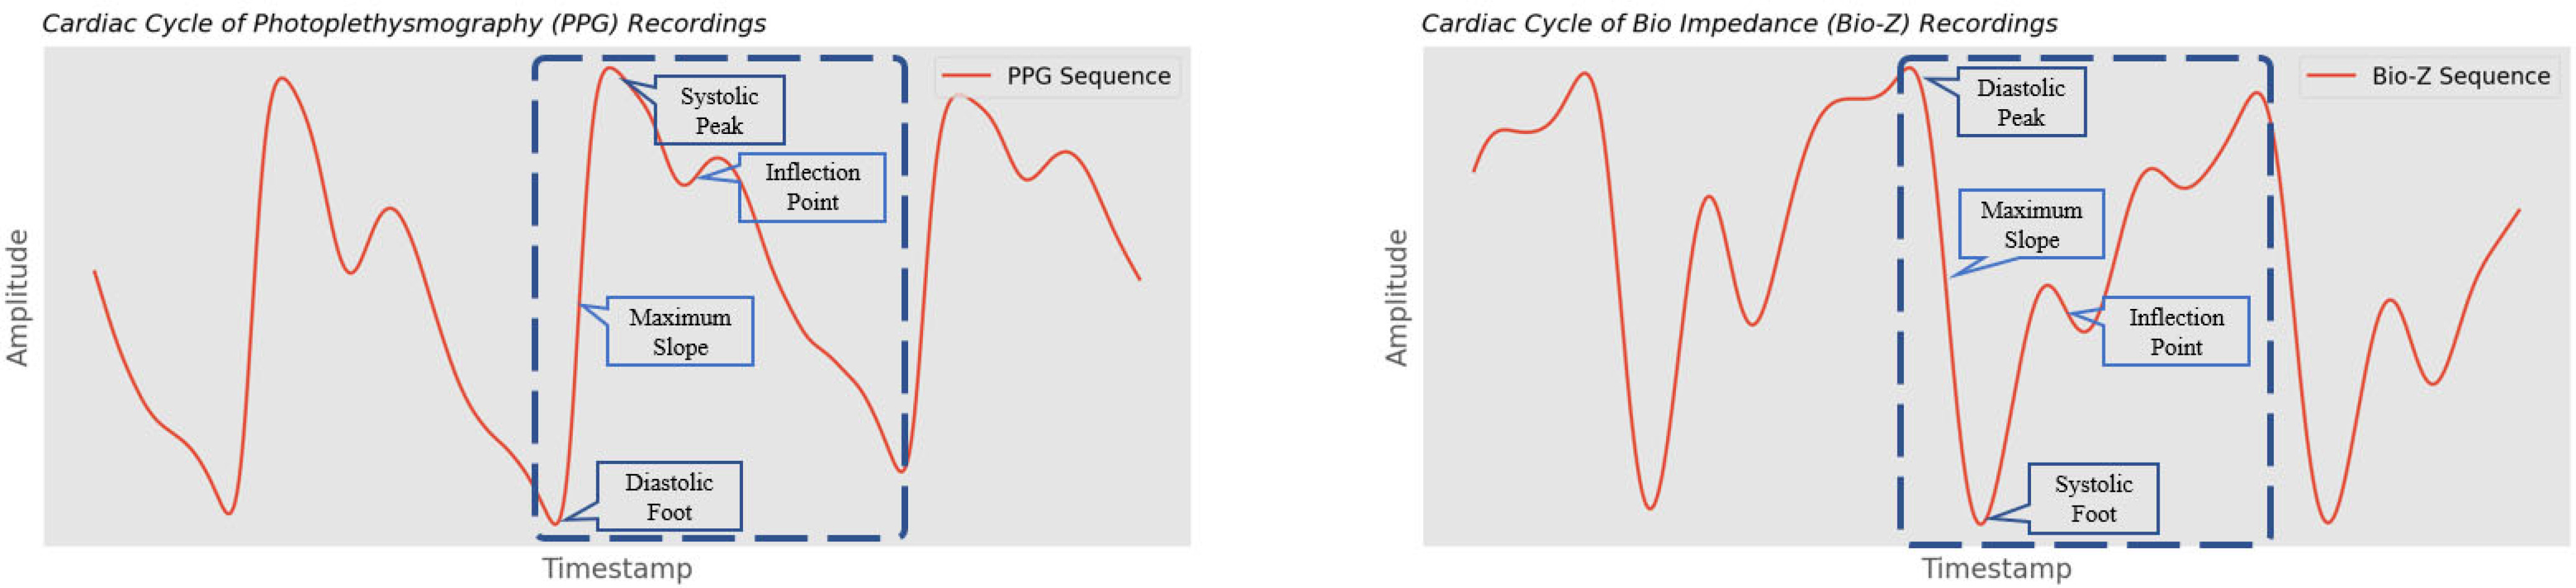
Example of pulsatile signals with annotated fiducial points; morphologies are derived from the amplitudes and longitudes of fiducial points.
Fig. 3.
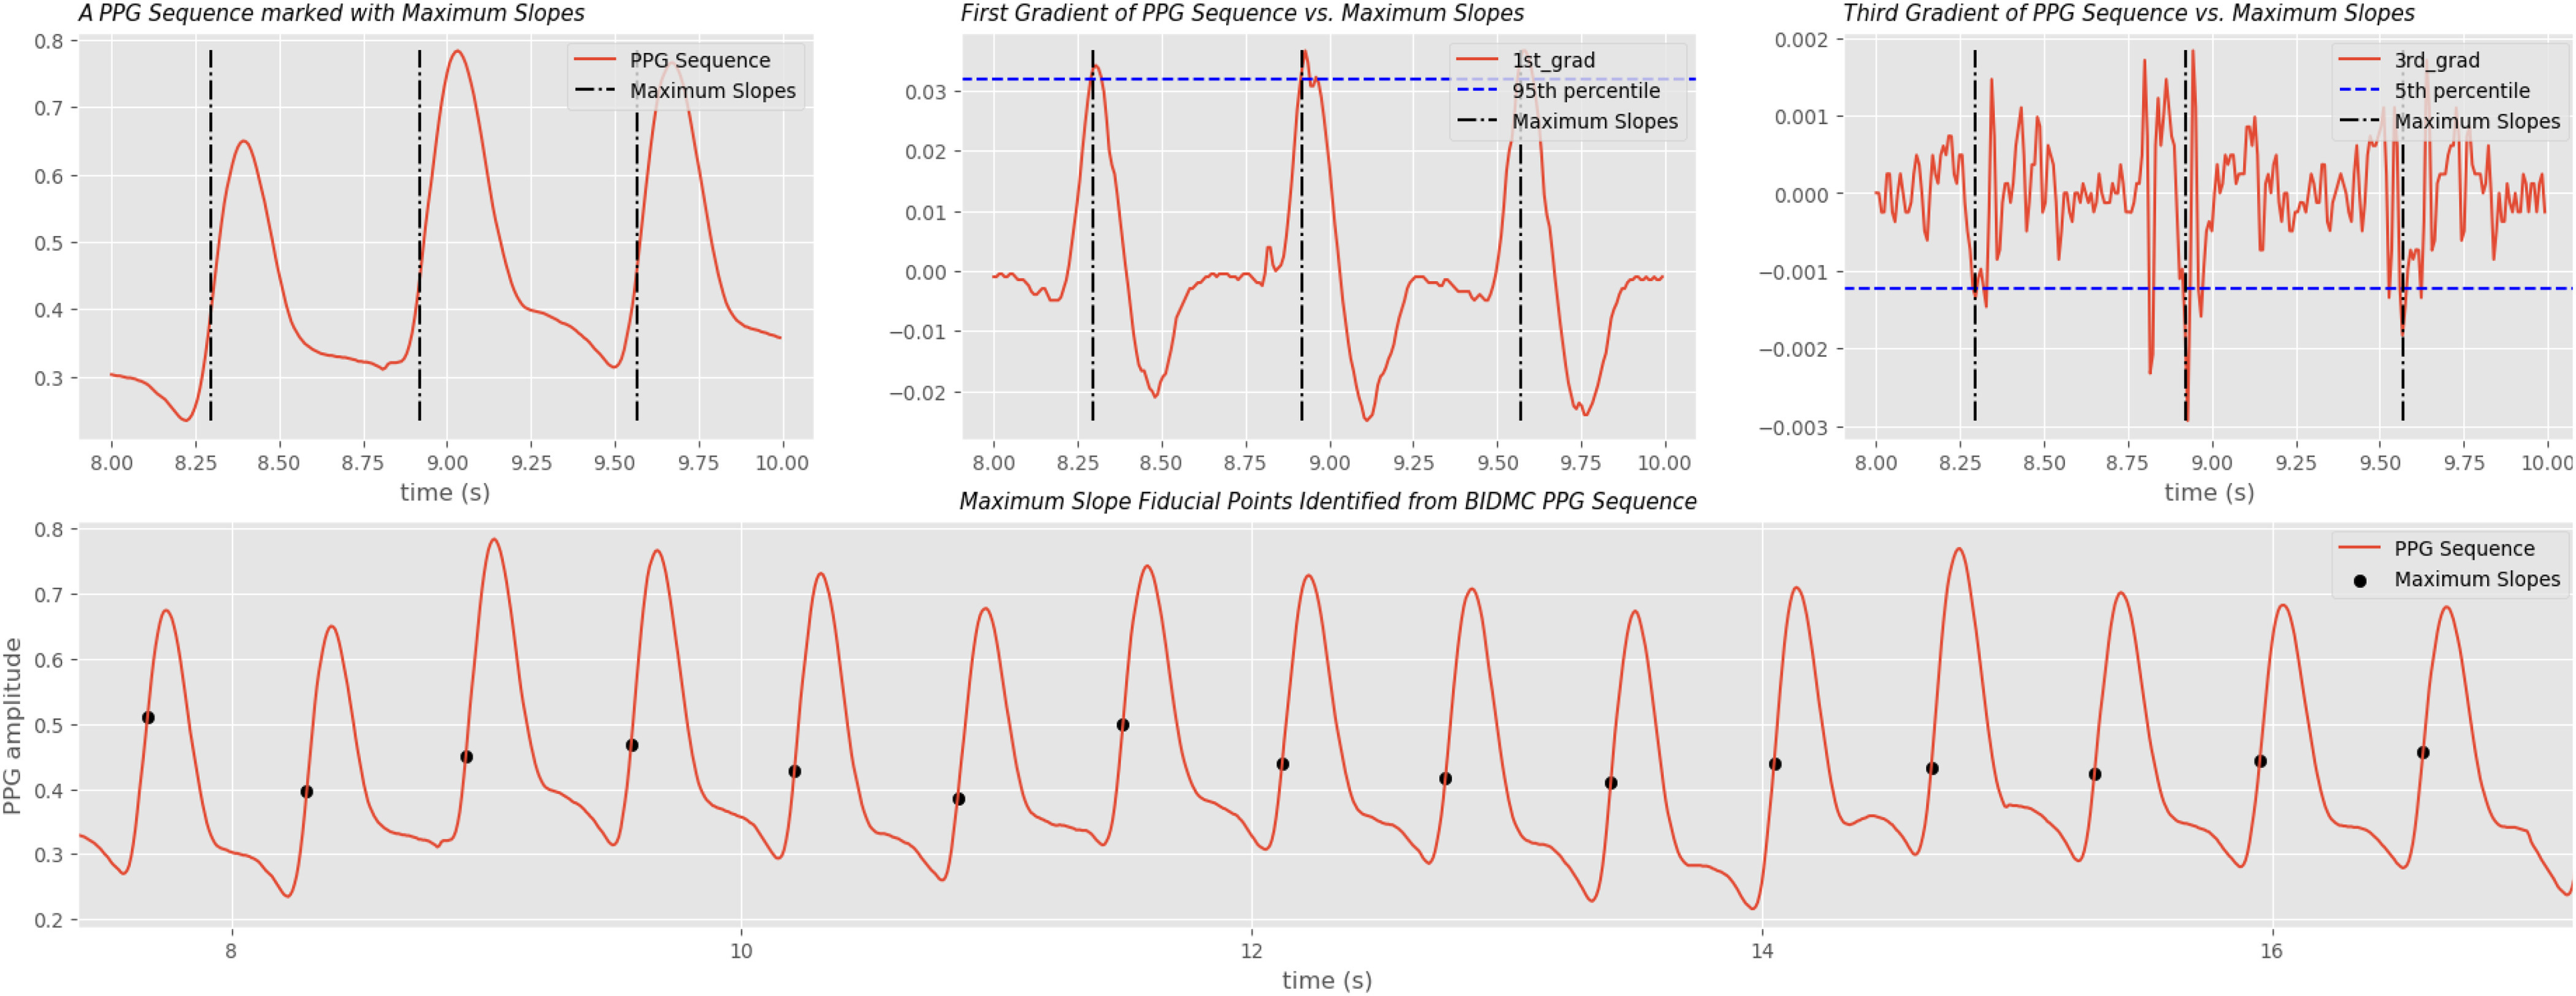
Maximum slope extraction on BIDMC PPG signals. Maximum slope is one of the more complex fiducial point used for inter-beat-interval (IBI) calculation. A data point with its first gradient higher than 95th percentile and its third gradient lower than 5th percentile of the sliding window is considered a maximum slope candidate. A candidate is dropped if it's less than 0.2 seconds to its previous candidate.
With the time series sequence of segmented cardiac cycles, we first introduced how we robustly aligned pulsatile signals with their respective ground truth labels recorded from a reference medical device of interest; we then proposed three SQI denoising techniques that can be applied individually or together.
B. Two-Pass Robust Signal Alignment
ML-ready datasets require reference labels for supervised training. Thus, a separate reference medical device collecting physiological parameters of interest (reference labels) was required. Therefore, we presented an elevated signal alignment method to synchronize the separately recorded reference signals to our pulsatile vital signals. When the model was deployed and reference labels were not needed, this step could be bypassed.
The first pass is inter-beat interval (IBI) matching. Since pulsatile signals (features) and the reference cardiac signals (label) were usually collected on separate devices. Synchronization between the features and references was required to label reference values for cardiac cycles. We computed IBI values from both signal sequences to identify and remove any delays between the two data collection.
However, IBI was calculated on “sample domain” where the sequence was ordered purely by their temporal precedence. A sequence is in the “time domain” when ordered by the actual temporal distances within its members. Although an IBI sequence in the sample domain maintains the temporal precedence, it's susceptible to outliers.
Assume a person has a constant cardiac cycle of 1 Hz for 60 seconds, resulting in the ideal IBI sequence with 60 values of 1. If 10% of cardiac fiducial points were confounded, we instead receive a shorter sequence total of 6 values of 2 and 48 values of 1. This could be corrected by a second shift of cross-correlation [36] in time domain. Fig. 4 illustrated a free-living environment example that a pair IBI synchronized sequences still carried 1 second lag. Table I demonstrated the time-domain IBI misalignment without the second-pass realignment.
Fig. 4.
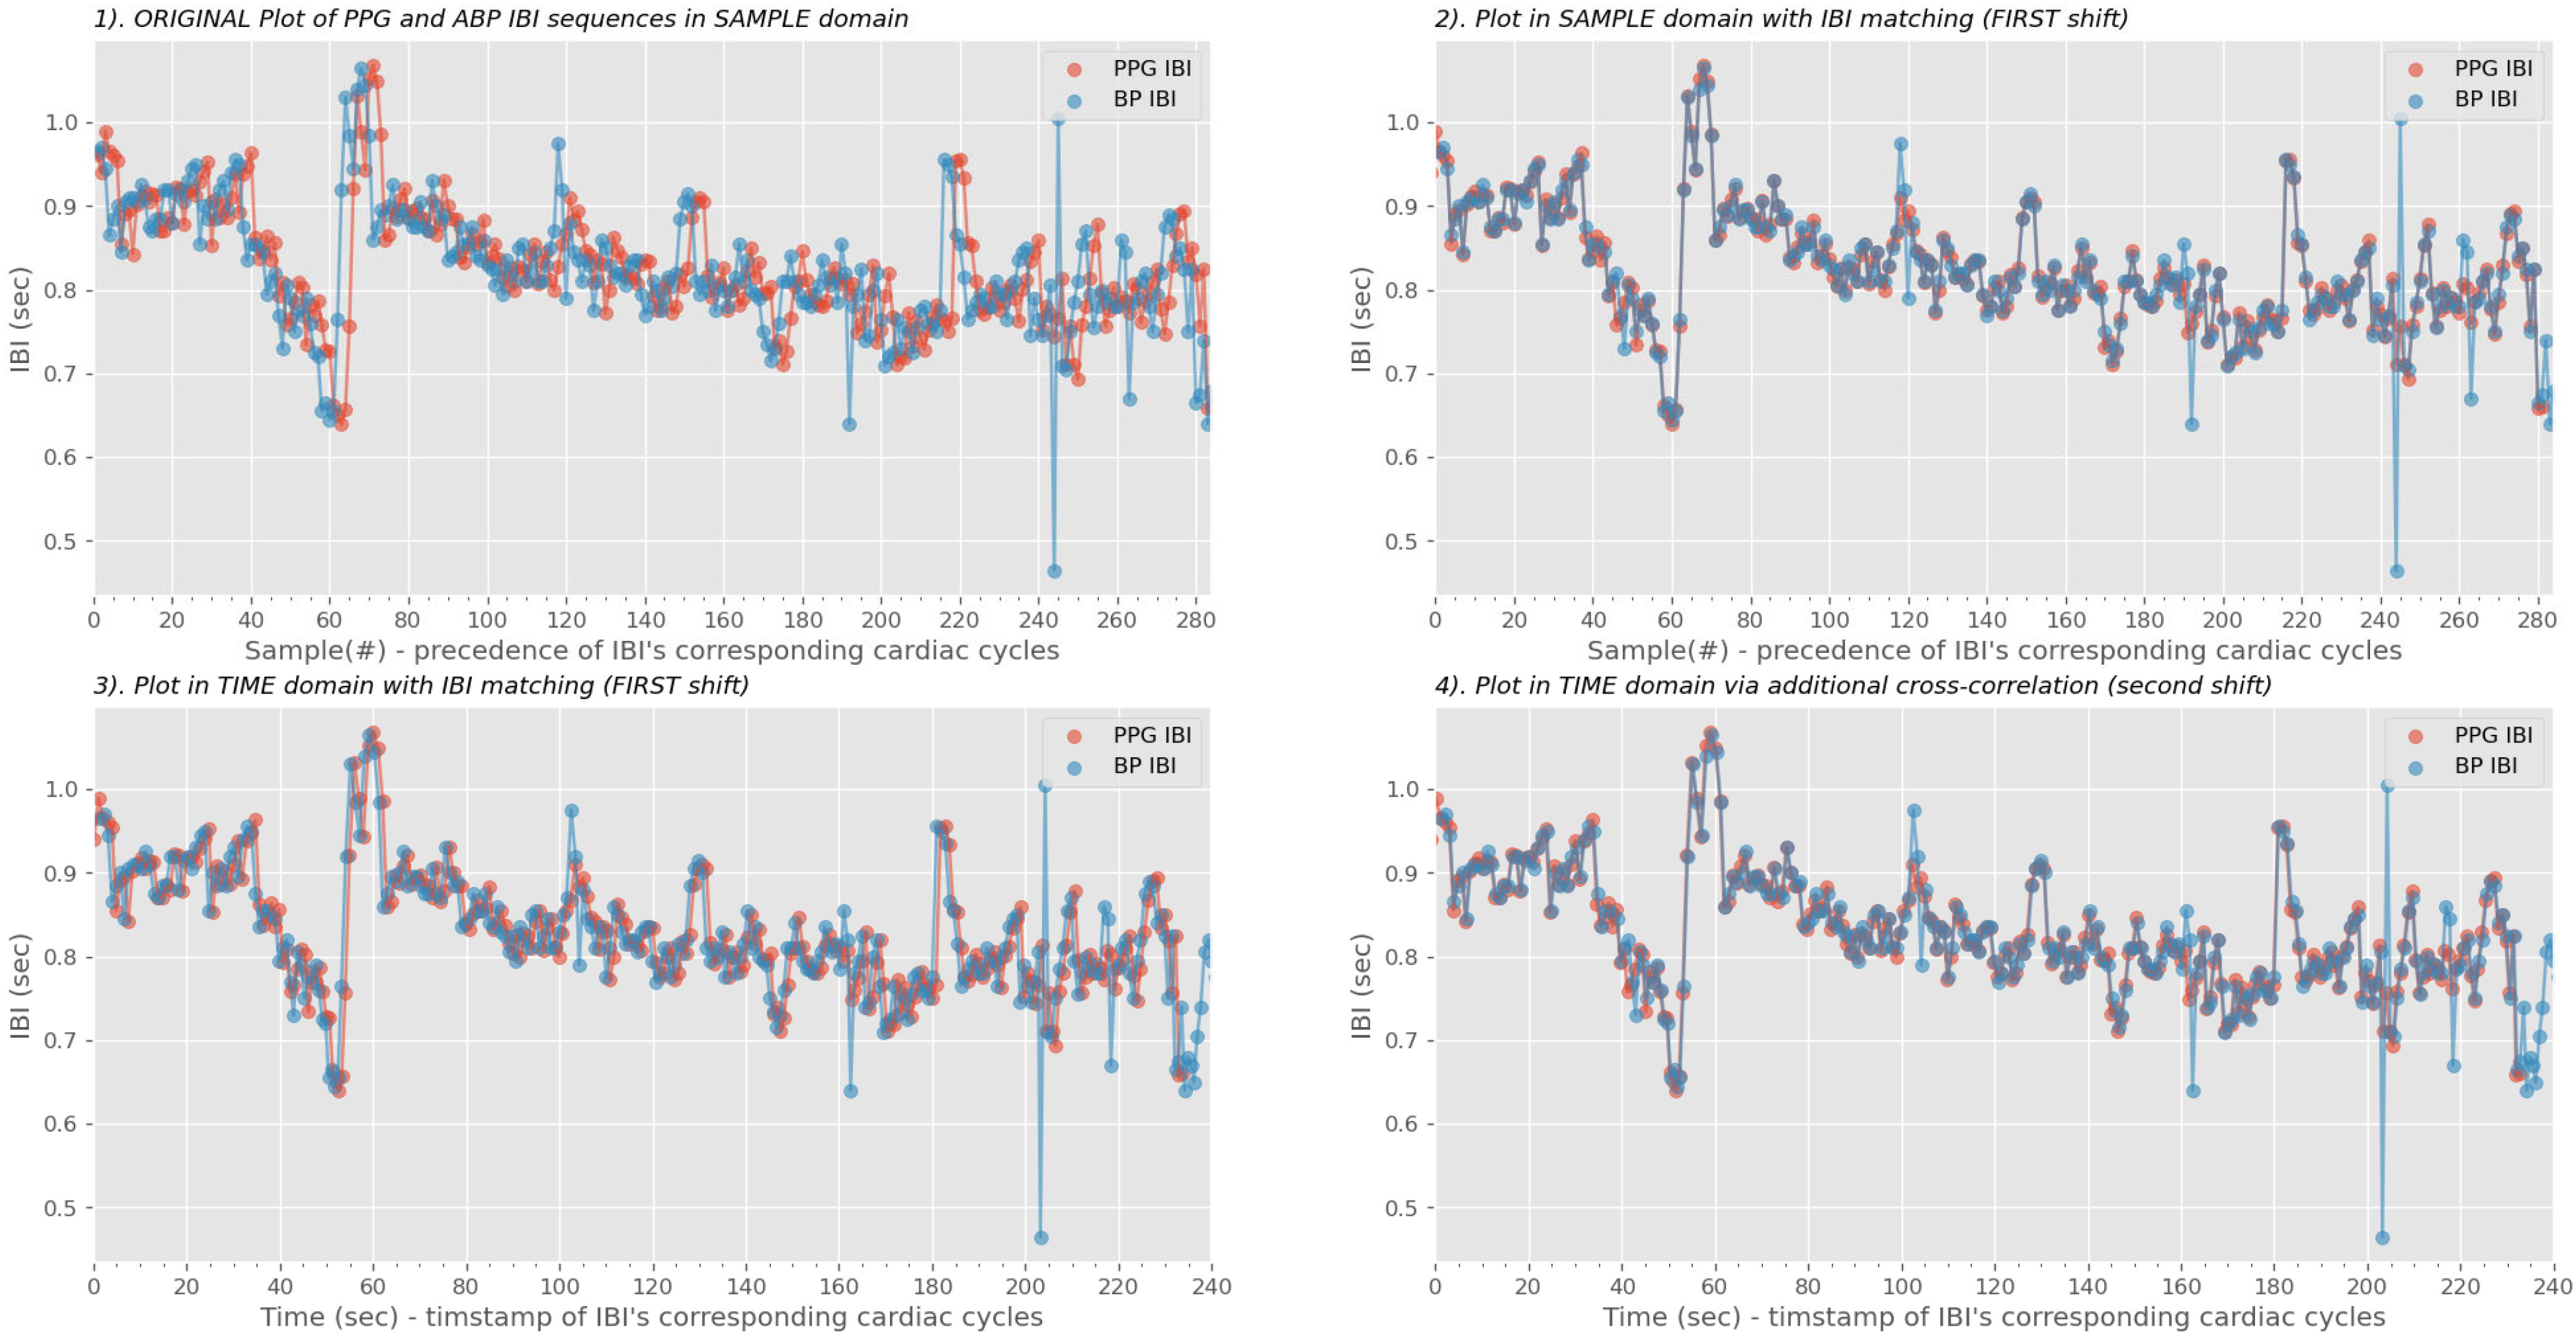
Real-world example of limitations on IBI matching. A 240-second PPG sequence found the correct segment on the arterial blood pressure (ABP) continuous stream. Although the two IBIs were closely aligned in the sample domain (upper right plot), the PPG IBI was still behind for 1 second in the time domain as shown in the lower left plot. At last, we performed the second shift via the cross-correlation phase to correct the misalignments [41].
TABLE I. A Real-World Example Demonstrating the Variable “lags” After IBI Matching Within the Same Test Subject.
| IBI difference (seconds) | Bio-Z Dataset Subject 75H | |||
|---|---|---|---|---|
| Collection 1 | Collection 2 | Collection 3 | Collection 4 | |
| Session 01 | 0.796 | 1.941 | 0.952 | 1.001 |
| Session 02 | 10.044 | 2.047 | 11.490 | 0.991 |
| Session 03 | 0.957 | 3.685 | 1.013 | 1.71 |
| Session 04 | 8.059 | 0.872 | 1.947 | 0.834 |
| Session 05 | 1.674 | 1.711 | 1.036 | 7.932 |
The Randomness of Noise-Confounded Outliers Introduced Large Uncertainties in Feature Labeling. However, a Second Pass of IBI Realigning Was Previously Overlooked. Details of This Dataset Can Be Found in Section III-A-I.
With the two-pass alignment approach, each pulsatile cardiac cycle was more correlated to the corresponding reference cardiac signal and robust reference labels (fiducial points and sequences) could then be annotated depending on the modeling task.
C. Parametric SQI-Based Filtering
Once waveforms were aligned, noise rejection methods were invoked. We designed the three following filtering techniques and pass the cardiac cycles. The order of filtering was arbitrary since only data marked clean by all three filters would remain in the dataset. We passed the pulsatile signals through three filtering processes.
Signal Quality-driven filtering: We used Signal-to-noise ratio (SNR) in decibels (dB) as SQI criteria for cardiac cycles [31] with the higher SNR denotes the higher SQI hence better signal quality. A sliding window of size t cardiac cycles is constructed to measure the SNR value assigned to the center cardiac cycle. A threshold of x dB, that is tunable by the user, is then defined to reject cardiac cycles whose SNR value lower than a defined threshold.
Morphology-driven filtering: Waveform fiducial points derived from signal abstraction represent the key phases of the cardiac cycle and contain abundant information correlated to the cardiac function. Fig. 2 illustrated the abundant cyclical information encapsulated in various forms of pulsatile signals recorded from wearable sensors. Morphological features extracted from fiducial points represented key physiological events reflected by pulsatile activities. 20 morphologies were computed from each cardiac cycle, including: time and amplitude difference between fiducial points of the current peak and previous peak, current peak, and current foot, etc.
Empirically defined plausibility thresholds thus rejected waveforms containing outlying morphologies such as IBI, rise time, the area under the curve, amplitude, etc [32].
DL-based Data-driven filtering: Considering noises as out-of-distribution data. A trained Variational Autoencoder (VAE) detected abnormal data accurately with reconstruction similarity and we utilized the encoder of a pre-trained VAE to compute latent features from pulsatile signals [33]. Subsequently, we used temporal clustering to cluster cardiac cycles based on associated latent features with Gaussian mixture model (GMM) [34]. With an empirically selected “gold standard” template denoting an ideal and clean cardiac cycle [35], we considered clusters whose centroids have lower normalized Dynamic Time Warping (DTW) distance to be cleaner. Whereas clusters whose centroids with normalized DTW distance surpassing a defined threshold d are rejected.
Each filtering metric independently annotated SQIs of cardiac cycles, and Pulse2AI rejected cardiac cycles based on thresholds converted from confidence. Disabling all filters would still provide a bandpass-filtered, robustly aligned dataset comparable to downstream modeling tasks [36], [37].
Accessible, interoperable, and reusable datasets are now prepared by Pulsa2AI and ready to use for the downstream AI/ML-infused medical modeling.
III. Results
We examined the effectiveness of our framework to generate data readiness by demonstrating improvement in cuffless BP estimation. We describe the datasets used, and how the data readiness framework is fed into a downstream BP model. We conducted ablation studies to demonstrate performance gains.
A. Data Collection
1). Blood Pressure Data Collection
We used a BioZ_XL device to collect both (photoplethysmography) PPG and Bio Impedance (Bio-Z) [30] pulsatile signals, and a Finapres NOVA to collect reference arterial BP waveforms. The reference physiological parameters of interest were beat-to-beat systolic BP (SBP) and diastolic BP (DBP), automatically reported by the Finapres NOVA device. 20 healthy subjects (45% male), aged from 18 to 40 years old, with normal body temperature, oxygen saturation, and no diagnosed disease were voluntarily recruited by the IRB through advertising for data collection (IRB2020-0090F, Texas A&M University, approved on 05/06/2020).
To simulate the contextual and physiological variabilities of the free-living environments, a subject completed a collection by following an 8 minute protocol: resting for 0.5 minutes, hand-gripping for 3 minutes to raise BP, placing a foot in ice water for 1 minute to keep BP elevated, and resting for 3.5 minutes to recover blood pressure [38]. Each subject completed 7 sessions and each session contained 4 collections. Because BP would drop suddenly for healthy subjects after hand-gripping exercise, we used “placing a foot in ice water”, a cold pressor test, to keep BP elevated while slowly declining, as observed in Fig. 5.
Fig. 5.
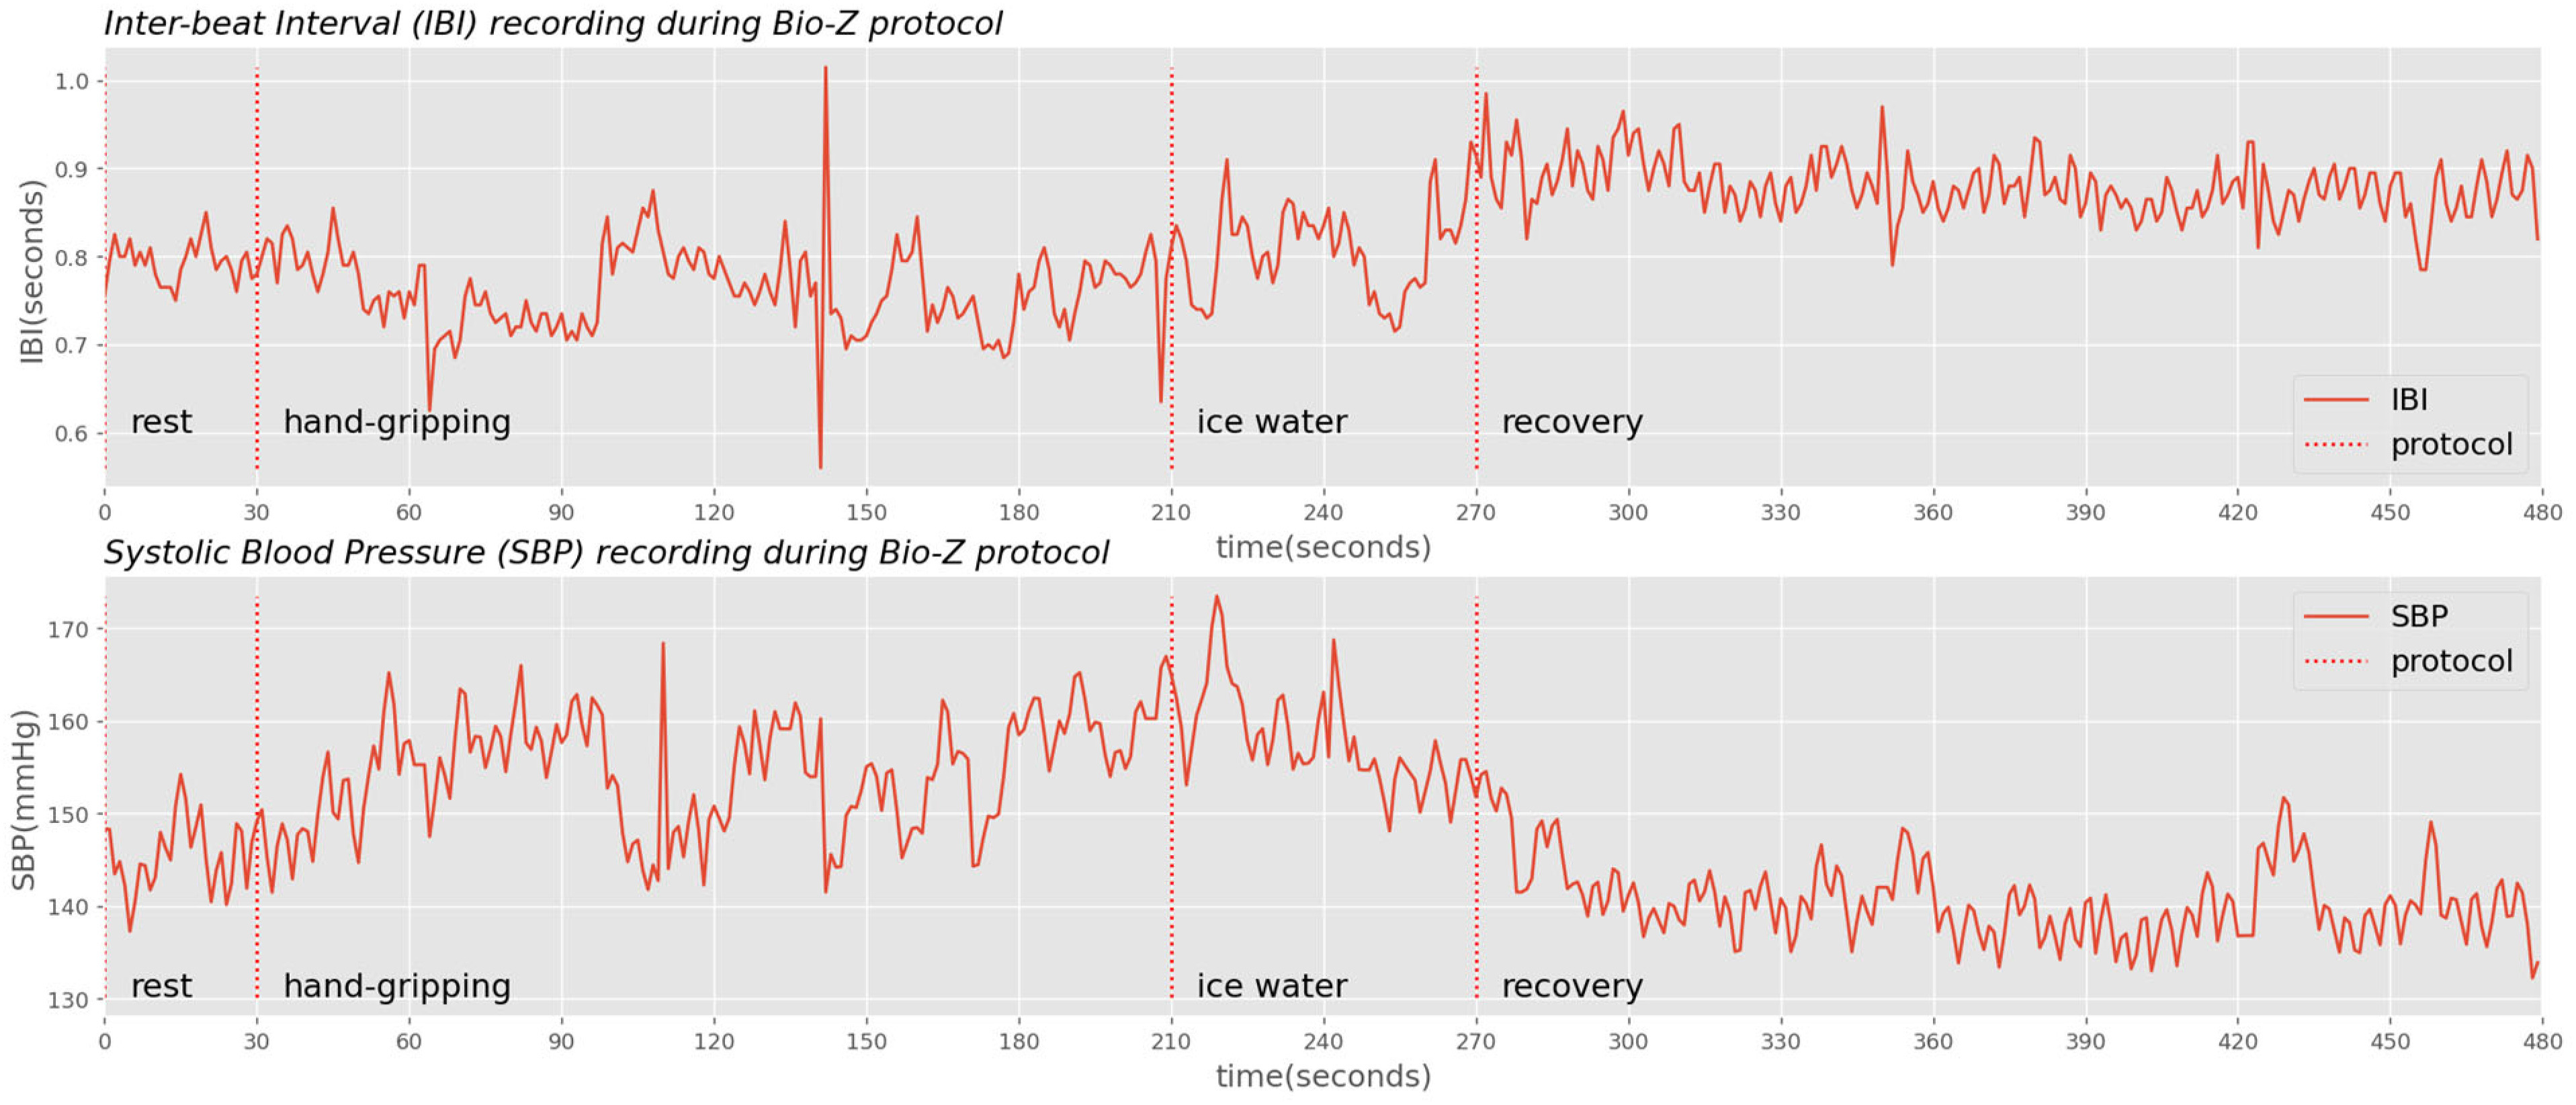
IBI and blood pressure recordings with Bio-Z protocols highlighted. While ice water (cold pressor) keeps BP elevated, the absolute SBP declines over time while the IBI increases.
While the protocol for Bio-Z data collection did not specify them, random motion artifacts occurred during the simulation free-living activities. Hand-gripping generates motion artifacts from muscular movements of wrists and arms; and performing cold pressor generates similar motion artifacts through body maneuvers and alters the cardiovascular physiology, too. Fig. 6 demonstrated an example of the Bio-Z dataset. In this figure, Bio-Z1, the first Bio-Z sensor, illustrates an instance of sensor misplacement. Conversely, motion artifacts were detected on other sensors between 135 to 140 seconds, during the hand-gripping maneuver.
Fig. 6.
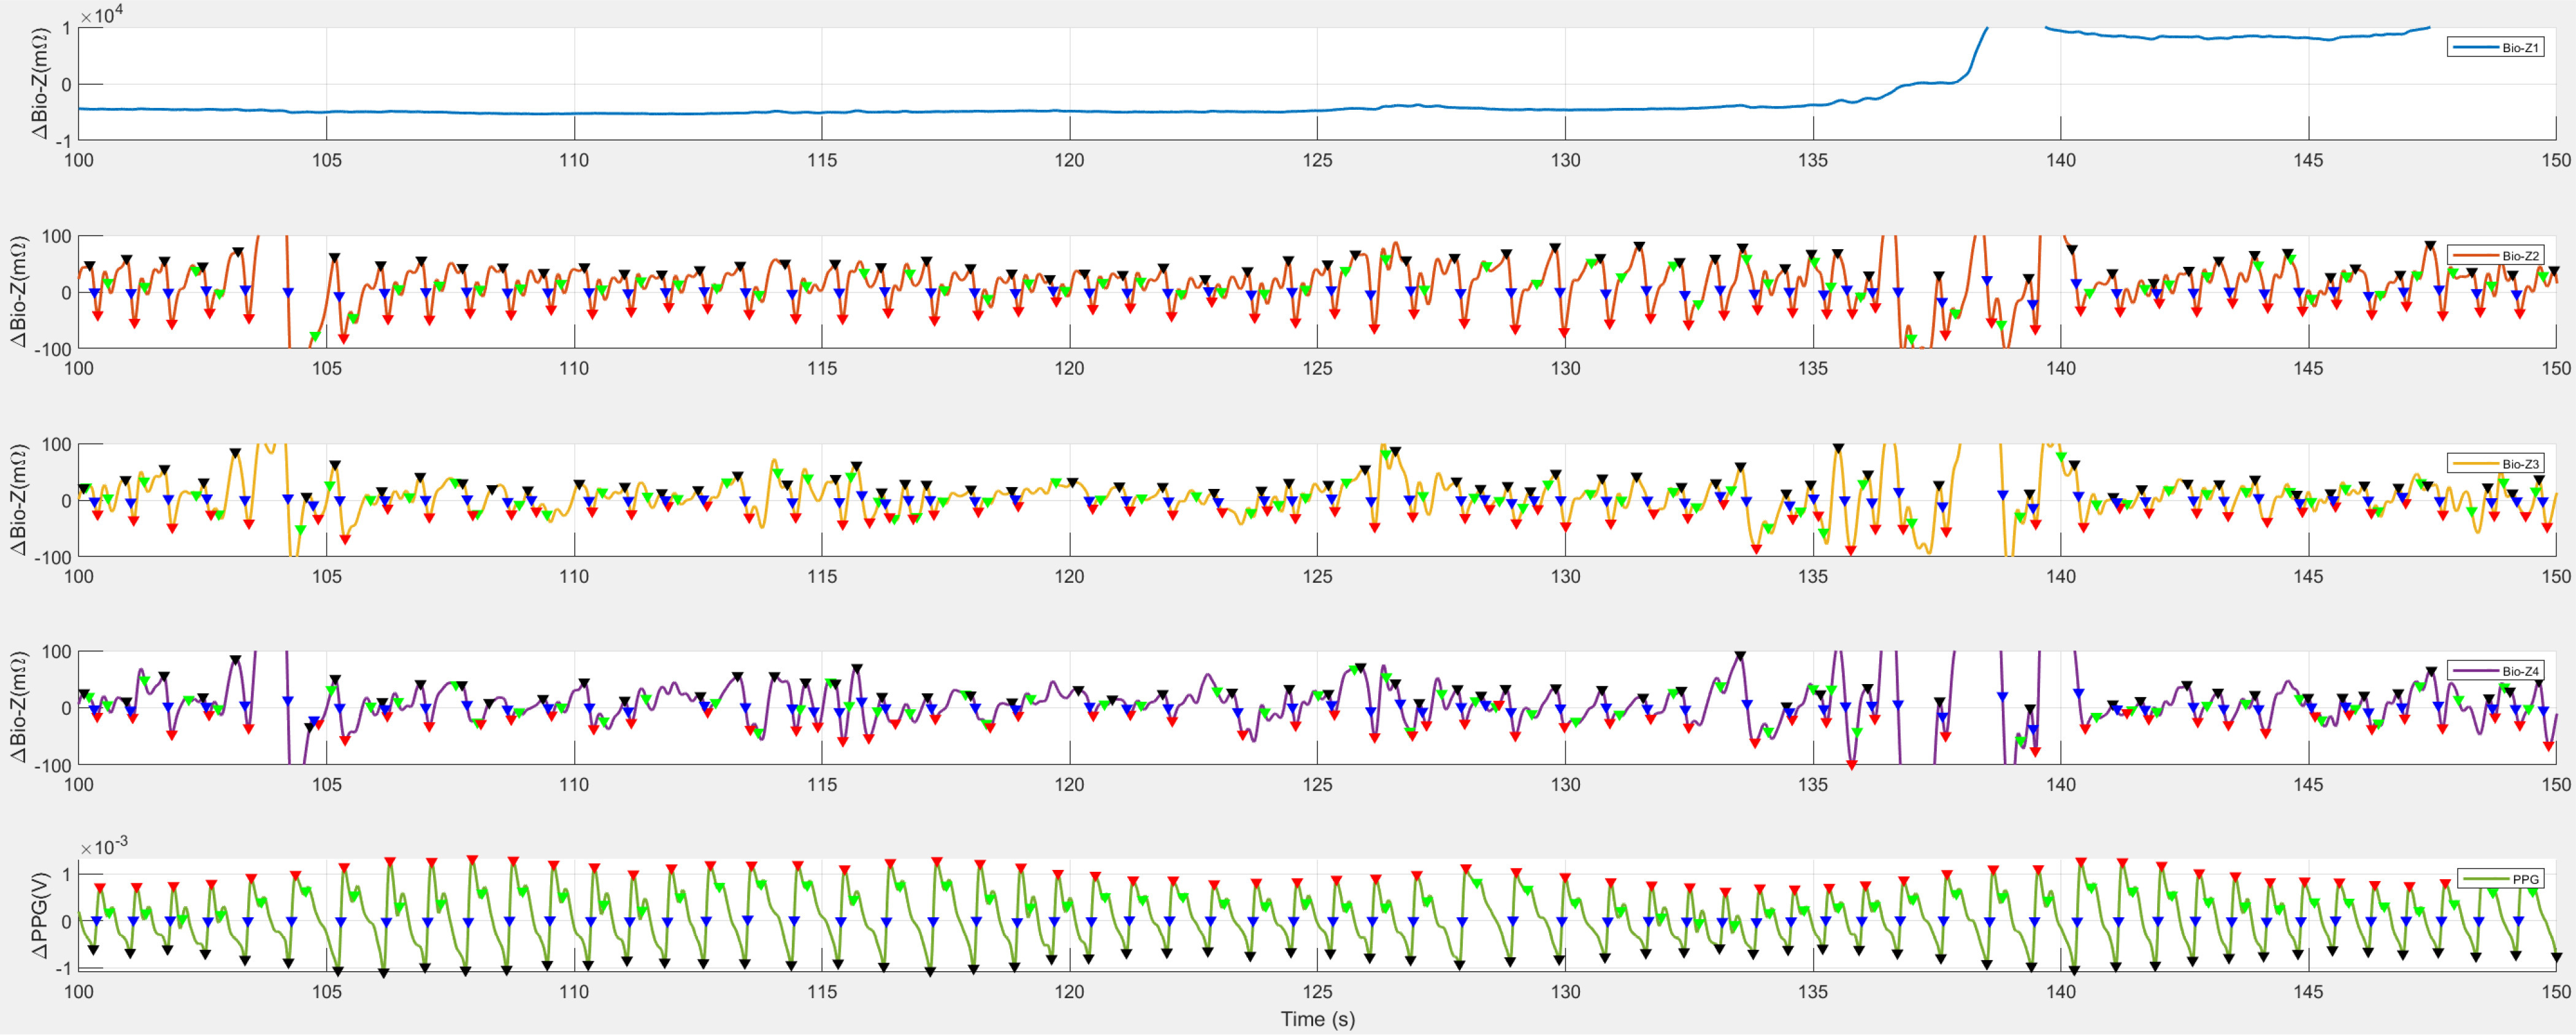
An example of noise in the Bio-Z dataset. Bio-Z1, the first Bio-Z sensor, experienced sensor misplacement. Additionally, motion artifacts, another form of noise, affected the recordings on other sensors, particularly between 135 to 140 seconds.
2). Respiration Rate Data Collection
Pimentel selected 53 adult patients from the MIMIC-II dataset and randomly extracted 8 minutes of PPG recordings and respiratory signals from each patient to formulate the BIDMC dataset [23]. The dataset has a median age of 64.81 with a range of 19-90+ and contains 32 females. We selected PPG to predict RR in breaths per minute (BrPM) as the reference physiological parameters of interest.
All recordings were collected during the patient's admission to medical and surgical intensive care units. During the recordings, the patients remained supine, committing minimal maneuvers and therefore virtually free of motion artifacts.
B. Estimation Model
1). Evaluation Metrics
We utilized the popular root-mean-squared-error (RMSE) and mean-absolute-error (MAE) metrics to measure the difference between our estimations and reference values for both datasets. A lower RMSE and MAE reflect better estimation quality.
2). Artificial Neural Networks
Various neural network architectures were applied to downstream medical tasks and listed in Table II. Fully connected Artificial NNs such as Multilayer perceptron (MLP) derives cardiac-related features from data [7], [39]. Where recurrent NNs like LSTM preserve sequential cardiac information through memory [40]. Composite NN architectures like CNN-LSTM further boosted prediction performance [8], [9]. In addition to feature extractions, some NNs are also employed architectures such as self-attention to perform automatic noise rejection [7], [8], [9], [16].
TABLE II. Table Comparison of Several Downstream Medical Works That Utilized Pulsatile waveforms.
| Panwar et al [8] | Truong et al [28] | Hsu et al [39] | El-Hajj et al [40] | Li et al [9] | Chen et al [16] | Shuzan et al [27] | Huang et al [7] | Pulsa2AI (Ours) | |
|---|---|---|---|---|---|---|---|---|---|
| Filter used in Preprocessing? | - | Gaussian | WaveformPlausibility | Waveform Plausibility+wavelet | - | - | variational model decomposition | Bandpass+low frequency+Savgol+Chebyshev II | Signal quality+morphology+DL-cluster |
| Is Filter noise rejection based? | - | No | Yes | Partially | - | - | Partially | No | Yes |
| Downstream neural network used | CNN-LSTM | - | MLP | LSTM | CNN-BiLSTM | CNN | Compared multiple | MLP-Mixer | Agnostic |
| Incorporated filter in downstream deep model? | Yes | - | No | No | Yes | Yes | - | Yes | Agnostic |
| Downstream Medical Task | BP | BP | BP | BP | BP | BP | RR | BP | Agnostic |
All of Them Used ML Models for Downstream Medical Tasks Except for Truong et al.
To best examine the performance improvement of preprocessing, we implemented a simple MLP of three linear layers in python to downstream medical estimations. We maintained the same parameters: learning rate of 1e-3, weight decay of 1e-6, train epoch of 100, batch size of 16, and the hidden dimension of all layers to be 128. We used adaptive moment estimation (Adam) as the training optimizer and mean squared error (MSE) as the loss function.
3). Experiment Setup
With the ML-ready data prepared by the framework, we randomly split the cardiac cycle sequences into train and test sets. We performed a randomized 80/20 split, maintained them across models, and reported average results via 3 repetitions for every session and subject. We prepared the dataset similarly for baselines by disabling all SQI-based filters but keeping the bandpass filter and robust label alignment.
C. Ablation Study of Noise Filtering
To examine the impact of our parametric data preprocessing scheme on improving BP and RR estimation on their respective datasets, we designed an ablation study with the following experiments to measure the importance and correlation of threshold variables of all three filtering techniques.
We defined the raw performance of MLP input by feeding the bandpass-filtered (0.6–3 Hz) pulsatile recordings to the downstream tasks. We implemented Gaussian [28], wavelet [40], variational mode decomposition (VMD) [27], and multi-filter [7] to serve as baselines because other techniques are either incorporated in the raw performance experiment or do not apply.
For ablations on Pulse2AI, we evaluated each filtering modality by disabling the other two. For signal quality-driven, we empirically selected t = 5 and grid-searched the SNR thresholds of x ∼ {25, 50, 75, 100} dBs; for morphology driven, we computed 4 versions of the morphology filter ranked by the tolerance to outliers; for data-driven, we grid-searched for a normalized DTW distance threshold of d ∼ {0.5, 1.0, 1.5, 2.0}. Since the scale of absolute errors carries different impacts in variable downstream tasks, we evaluated improvements of filtering by calculating the percentage decrease in RMSE and MAE over the raw performance result and reported them in Table III.
TABLE III. Ablation Study of the Impact of Preprocessing Filtering on BP Estimation Using Bio-Z Dataset, and on RR Estimation Using BIDMC Dataset, Reporting Results Averaging Across All Subjects.
| BP Estimation with Bio-Z Dataset | RR Estimation with BIDMC Dataset | ||||||||
|---|---|---|---|---|---|---|---|---|---|
| Filtering Techniques | Filtered Cardiac Cycles | SBP Improvement (mmHg) | DBP Improvement (mmHg) | Filtered Cardiac Cycles | RR Improvement (BrPM) | ||||
| RMSE | MAE | RMSE | MAE | RMSE | MAE | ||||
| Baseline Techniques | Raw performance | - | 11.41 | 10.09 | 7.93 | 7.91 | - | 1.84 | 1.47 |
| Gaussian [28] | 17.79% | 10.58 | 9.39 | 7.25 | 7.27 | 2.41% | 1.75 | 1.33 | |
| Wavelet [40] | 19.81% | 10.61 | 9.43 | 7.24 | 7.25 | 12.28% | 1.74 | 1.32 | |
| VMD [27] | 29.19% | 10.04 | 9.15 | 7.27 | 7.27 | 17.73% | 1.72 | 1.31 | |
| Multi-filter [7] | 33.96% | 10.58 | 9.39 | 7.24 | 7.26 | 11.17% | 1.74 | 1.32 | |
| Signal Quality Driven | 25 dB | 23.54% | 8.74 | 8.41 | 6.48 | 6.70 | 4.92% | 1.67 | 1.32 |
| 50 dB | 32.50% | 8.53 | 8.17 | 7.72 | 7.58 | 31.37% | 1.58 | 1.25 | |
| 75 dB | 38.12% | 9.61 | 9.12 | 7.72 | 7.58 | 35.29% | 1.60 | 1.26 | |
| 100 dB | 41.67% | 9.91 | 9.70 | 7.88 | 7.85 | 37.25% | 1.62 | 1.26 | |
| Morphology Driven | Softer | 40.48% | 10.49 | 9.48 | 7.31 | 7.45 | 1.57% | 1.74 | 1.32 |
| Soft | 46.27% | 8.93 | 8.29 | 7.30 | 7.44 | 9.19% | 1.79 | 1.40 | |
| Hard | 50.24% | 8.57 | 8.13 | 7.32 | 7.44 | 19.53% | 1.74 | 1.32 | |
| Harder | 52.48% | 9.15 | 8.60 | 7.71 | 7.79 | 42.06% | 1.78 | 1.38 | |
| DL-based Data-Driven | 2 | 3.71% | 10.43 | 9.53 | 7.54 | 7.38 | 3.19% | 1.82 | 1.47 |
| 1.5 | 9.32% | 9.49 | 8.65 | 6.16 | 5.85 | 13.91% | 1.49 | 1.18 | |
| 1 | 19.44% | 9.64 | 8.53 | 5.97 | 6.02 | 16.88% | 1.58 | 1.19 | |
| 0.5 | 28.46% | 8.03 | 6.83 | 5.87 | 5.67 | 32.05% | 1.57 | 1.18 | |
Results are Computed Using a Simple MLP (Section III-B-2)).
IV. Discussion
A. Blood Pressure Estimation
We selected 19 sessions from 5 subjects in the Bio-Z dataset to perform the aforementioned experiments and measured percentage improvements in mmHg. The raw performance of SBP estimation had 11.41 and 10.09 mmHg errors in RMSE and MAE, respectively; the DBP estimation had 7.93 and 7.91 mmHg errors in RMSE and MAE, respectively. All participants received performance improvements.
For SBP estimation, all three techniques improved RMSE by at least 24% and MAE by at least 19%, and the DL-based data-driven filter with a DTW distance threshold of 0.5 performed the best with a 29.58% improvement in RMSE and 32.31% in MAE. For DBP estimation, improvements were at least 7% lower RMSE and 6% lower MAE, and the same DL-based data-driven filter above scored the highest improvement of 26.01% and 28.38% while filtering fewer cardiac cycles.
Among experiments with signal quality-driven noise filtering, models perform best at the threshold of 50 dB for SBP estimation and at 25 dB for DBP estimation. They outperformed baselines in both SBP and DBP estimations.
While the best-performing morphology-driven filtering outperformed all baselines on SBP estimation, it underperformed on DBP estimation. The plausibility thresholds were empirically defined in regard to the absolute criteria of clean waveforms in the dataset.
Most DL-driven filters outperformed the baselines while filtering fewer cardiac cycles. Preserving clusters with normalized DTW distance ≤0.5 to the template pulsatile waveform report the best performance both for DL-filter and overall.
B. Respiration Rate Estimation
We performed the same set of experiments on RR estimation for all 53 subjects and measured the percentage improvements in BrPM. Raw performance of MLP on RR estimation was 1.84 BrPM error in RMSE and 1.47 in MAE.
Appling the same experiments, we observed that 16 (30.2%) subjects received performance improvements over the raw performance when preprocessing filters were used. The other participants received performance drawbacks as much as −5.40% in RMSE and −6.95% in MAE. Because the subjects of the BIDMC dataset were selected subsets from MIMIC-II and were mostly in stationary supine positions during collections, they had lower exposure to noise sources and reduced benefits from preprocessing filters. We reported the following results on the 16 subjects with positive performance gains.
For RR estimation, all three techniques demonstrated over 10% improvement in MAE and 8% improvement and were comparable to baselines. The DL-driven filter with a normalized DTW distance of 0.5 and achieved 14.58% and 19.69% improvements in RMSE and MAE, respectively.
The best-performing threshold for the signal quality-driven filter was 50 dB, achieving 14.21% and 15.29% improvement in RMSE and MAE. It also outperformed all baselines, too.
Similarly, all versions of expertly defined morphology thresholds presented performance benefits while the “hard” version gave the best improvement of 8.84% and 10.09% in RMSE and MAE, beatings the Gaussian and wavelet filtering baselines.
As all thresholds of DL-based data-driven filters boosted performances, thresholds with a normalized DTW distance of 0.5 provided the best performance as mentioned above, and outperformed all of the baselines.
C. Limitations and Future Works
While our Pulse2AI method presented overperformance over two downstream tasks, we have yet validated its performance and validity under online, wearable setting, such as power consumption and memory stress. The study cohort of Bio-Z dataset included mostly young and white participants and could not represent the entire population. Conversely, the BIDMC dataset collected from a much older cohort patients in supine positions and could not represent the healthy populations, either. Nevertheless, we have evaluated Pulse2AI over two medical modeling tasks on two utterly different cohorts and proved its consistency in achieving elevated modeling performance in FAIR fashions.
An immediate follow-up work for our study would be automating the grid-search process and converting Pulse2AI into a self-optimized preprocessing function. More importantly, we identified that lacking ML-ready data streams was a bottleneck for medical applications introduced Pulse2AI to convert abundant pulsatile recordings of IoMT devices into the cardiac reservoir.
V. Conclusion
Remote sensors and IoMT provide abundant wearable pulsatile recordings but bridging physiological and biomedical signals to AI/ML-ready data remains a major limitation. Pulse2AI is an end-to-end preprocessing framework that adapts to different pulsatile modalities and supplies ML-ready datasets for arbitrary downstream medical applications. Within the framework, we proposed an elevated signal alignment scheme and 3 SQI-based filtering metrics to provide a preprocessed dataset for a given downstream task.
Pulse2AI was validated on both Bio-Z, a self-collected dataset encompassing maneuvers on younger, healthier participants in free-living environments, and BIDMC, a public dataset with minimal noise and elderly, sicker patients. When coupled with any of the three filtering metrics, Pulse2AI offered the best performance improvements on both BP and RR estimations, outperforming four filtering baselines. The Pulse2AI's ability to offer the best ML-ready dataset agnostic to downstream medical applications is a crucial step towards bridging the valuable assets in IoMT and ML for the healthcare community to tackle upcoming challenges in medical modeling.
Conflict of Interest
All authors declare no conflict of interest.
Author Contribution
S.H., R.J., and B.M. conceived the idea for the construction of the Pulse2AI framework. S.H. processed the data and compiled the models, while R.J. and B.M. supervised the entire process. The manuscript was written with contributions from all authors, and all authors have approved the final version of the manuscript.
Funding Statement
This work was supported by the National Institutes of Health under Grant 1R01HL151240-01A1 and Grant 1R21EB028486-01.
Contributor Information
Sicong Huang, Email: siconghuang@tamu.edu.
Roozbeh Jafari, Email: rjafari@mit.edu.
Bobak J. Mortazavi, Email: bobakm@tamu.edu.
References
- [1].Gupta S. and Gupta A., “Dealing with noise problem in machine learning data-sets: A systematic review,” Procedia Comput. Sci., vol. 161, pp. 466–474, Jan. 2019, doi: 10.1016/J.PROCS.2019.11.146. [DOI] [Google Scholar]
- [2].Thambiraj G., Gandhi U., Mangalanathan U., Jose V. J. M., and Anand M., “Investigation on the effect of Womersley number, ECG and PPG features for cuff less blood pressure estimation using machine learning,” Biomed. Signal Process. Control, vol. 60, 2020, Art. no. 101942. [Google Scholar]
- [3].Pereira T. et al. , “A supervised approach to robust photoplethysmography quality assessment,” IEEE J. Biomed. Health Inform., vol. 24, no. 3, pp. 649–657, Mar. 2020, doi: 10.1109/JBHI.2019.2909065. [DOI] [PMC free article] [PubMed] [Google Scholar]
- [4].Khalid F., Hanif M. A., Rehman S., Qadir J., and Shafique M., “FAdeML: Understanding the impact of pre-processing noise filtering on adversarial machine learning,” in Proc. Des., Automat. Test Europe Conf. Exhib., 2019, pp. 902–907, doi: 10.23919/DATE.2019.8715141. [DOI] [Google Scholar]
- [5].“BRIDGE2AI – Propelling biomedical research with artificial intelligence,” Accessed: Mar. 16, 2023. [Online]. Available: https://bridge2ai.org/
- [6].Zhang L. et al. , “Measuring fine-grained heart-rate using a flexible wearable sensor in the presence of noise,” in Proc. IEEE 15th Int. Conf. Wearable Implantable Body Sensor Netw., 2018, pp. 160–164, doi: 10.1109/BSN.2018.8329683. [DOI] [Google Scholar]
- [7].Huang B., Chen W., Lin C.-L., Juang C.-F., and Wang J., “MLP-BP: A novel framework for cuffless blood pressure measurement with PPG and ECG signals based on MLP-Mixer neural networks,” Biomed. Signal Process. Control, vol. 73, 2022, Art. no. 103404. [Google Scholar]
- [8].Panwar M., Gautam A., Biswas D., and Acharyya A., “PP-Net: A deep learning framework for PPG-based blood pressure and heart rate estimation,” IEEE Sensors J., vol. 20, no. 17, pp. 10000–10011, Sep. 2020. [Google Scholar]
- [9].Li Y. H., Harfiya L. N., and Chang C. C., “Featureless blood pressure estimation based on photoplethysmography signal using CNN and BiLSTM for IoT devices,” Wireless Commun. Mob. Comput., vol. 2021, pp. 1–10, 2021, doi: 10.1155/2021/9085100. [DOI] [Google Scholar]
- [10].Karimi D., Dou H., Warfield S. K., and Gholipour A., “Deep learning with noisy labels: Exploring techniques and remedies in medical image analysis,” Med. Image Anal., vol. 65, Oct. 2020, Art. no. 101759, doi: 10.1016/J.MEDIA.2020.101759. [DOI] [PMC free article] [PubMed] [Google Scholar]
- [11].Rahmani A. M. et al. , “Machine learning (ML) in medicine: Review, applications, and challenges,” Mathematics, vol. 9, no. 22, Nov. 2021, Art. no. 2970, doi: 10.3390/MATH9222970. [DOI] [Google Scholar]
- [12].Muela H. C. S. et al. , “Hypertension severity is associated with impaired cognitive performance,” J. Amer. Heart Assoc., vol. 6, no. 1, 2017, Art. no. e004579. [DOI] [PMC free article] [PubMed] [Google Scholar]
- [13].Fuchs F. D. and Whelton P. K., “High blood pressure and cardiovascular disease,” Hypertension, vol. 75, no. 2, pp. 285–292, 2020. [DOI] [PMC free article] [PubMed] [Google Scholar]
- [14].Kearney P. M., Whelton M., Reynolds K., Muntner P., Whelton P. K., and He J., “Global burden of hypertension: Analysis of worldwide data,” Lancet, vol. 365, no. 9455, pp. 217–223, 2005. [DOI] [PubMed] [Google Scholar]
- [15].Chauhan S. and Vig L., “Anomaly detection in ECG time signals via deep long short-term memory networks,” in Proc. IEEE Int. Conf. Data Sci. Adv. Analytics, 2015, pp. 1–7, doi: 10.1109/DSAA.2015.7344872. [DOI] [Google Scholar]
- [16].Chen Y., Zhang D., Karimi H. R., Deng C., and Yin W., “A new deep learning framework based on blood pressure range constraint for continuous cuffless BP estimation,” Neural Netw., vol. 152, pp. 181–190, 2022. [DOI] [PubMed] [Google Scholar]
- [17].Banegas J. R. et al. , “Relationship between clinic and ambulatory blood-pressure measurements and mortality,” New England J. Med., vol. 378, no. 16, pp. 1509–1520, Apr. 2018, doi: 10.1056/NEJMOA1712231/SUPPL_FILE/NEJMOA1712231_DISCLOSURES.PDF. [DOI] [PubMed] [Google Scholar]
- [18].Dadlani A., Madan K., and Sawhney J. P. S., “Ambulatory blood pressure monitoring in clinical practice,” Indian Heart J., vol. 71, no. 1, pp. 91–97, 2019. [DOI] [PMC free article] [PubMed] [Google Scholar]
- [19].Nachman D. et al. , “Twenty-four-hour ambulatory blood pressure measurement using a novel noninvasive, cuffless, wireless device,” Amer. J. Hypertension, vol. 34, no. 11, pp. 1171–1180, Nov. 2021, doi: 10.1093/AJH/HPAB095. [DOI] [PubMed] [Google Scholar]
- [20].Sabeti E., Reamaroon N., Mathis M., Gryak J., Sjoding M., and Najarian K., “Signal quality measure for pulsatile physiological signals using morphological features: Applications in reliability measure for pulse oximetry,” Inform. Med. Unlocked, vol. 16, 2019, Art. no. 100222. [DOI] [PMC free article] [PubMed] [Google Scholar]
- [21].El-Hajj C. and Kyriacou P. A., “A review of machine learning techniques in photoplethysmography for the non-invasive cuff-less measurement of blood pressure,” Biomed. Signal Process. Control, vol. 58, 2020, Art. no. 101870. [Google Scholar]
- [22].Nicolò A., Massaroni C., Schena E., and Sacchetti M., “The importance of respiratory rate monitoring: From healthcare to sport and exercise,” Sensors, vol. 20, no. 21, Nov. 2020, Art. no. 6396, doi: 10.3390/S20216396. [DOI] [PMC free article] [PubMed] [Google Scholar]
- [23].Pimentel M. A. F. et al. , “Toward a robust estimation of respiratory rate from pulse oximeters,” IEEE Trans. Biomed. Eng., vol. 64, no. 8, pp. 1914–1923, Aug. 2017, doi: 10.1109/TBME.2016.2613124. [DOI] [PMC free article] [PubMed] [Google Scholar]
- [24].Birrenkott D. A., Pimentel M. A. F., Watkinson P. J., and Clifton D. A., “A robust fusion model for estimating respiratory rate from photoplethysmography and electrocardiography,” IEEE Trans. Biomed. Eng., vol. 65, no. 9, pp. 2033–2041, Sep. 2018, doi: 10.1109/TBME.2017.2778265. [DOI] [PubMed] [Google Scholar]
- [25].Liu H., Allen J., Zheng D., and Chen F., “Recent development of respiratory rate measurement technologies,” Physiol. Meas., vol. 40, no. 7, Aug. 2019, Art. no. 07TR01, doi: 10.1088/1361-6579/AB299E. [DOI] [PubMed] [Google Scholar]
- [26].Karlen W., Kobayashi K., Ansermino J. M., and Dumont G. A., “Photoplethysmogram signal quality estimation using repeated Gaussian filters and cross-correlation,” Physiol. Meas., vol. 33, no. 10, pp. 1617–1629, 2012, doi: 10.1088/0967-3334/33/10/1617. [DOI] [PubMed] [Google Scholar]
- [27].Shuzan M. N. I. et al. , “A novel non-invasive estimation of respiration rate from motion corrupted photoplethysmograph signal using machine learning model,” IEEE Access, vol. 9, pp. 96775–96790, 2021, doi: 10.1109/ACCESS.2021.3095380. [DOI] [Google Scholar]
- [28].Truong H., Montanari A., and Kawsar F., “Non-invasive blood pressure monitoring with multi-modal in-ear sensing,” in Proc. IEEE Int. Conf. Acoust., Speech Signal Process., 2022, pp. 6–10, doi: 10.1109/ICASSP43922.2022.9747661. [DOI] [Google Scholar]
- [29].Jensen M. T., Suadicani P., Hein H. O., and Gyntelberg F., “Elevated resting heart rate, physical fitness and all-cause mortality: A 16-year follow-up in the Copenhagen Male Study,” Heart, vol. 99, no. 12, pp. 882–887, Jun. 2013, doi: 10.1136/HEARTJNL-2012-303375. [DOI] [PMC free article] [PubMed] [Google Scholar]
- [30].Ibrahim B. and Jafari R., “Cuffless blood pressure monitoring from an array of wrist bio-impedance sensors using subject-specific regression models: Proof of concept,” IEEE Trans. Biomed. Circuits Syst., vol. 13, no. 6, pp. 1723–1735, Dec. 2019, doi: 10.1109/TBCAS.2019.2946661. [DOI] [PMC free article] [PubMed] [Google Scholar]
- [31].Johnson D. H., “Signal-to-noise ratio,” Scholarpedia, vol. 1, no. 12, 2006, Art. no. 2088, doi: 10.4249/SCHOLARPEDIA.2088. [DOI] [Google Scholar]
- [32].Martinez J., Nowroozilarki Z., Jafari R., and Mortazavi B. J., “Data-driven guided attention for analysis of physiological waveforms with deep learning,” IEEE J. Biomed. Health Inform., vol. 26, no. 11, pp. 5482–5493, Nov. 2022, doi: 10.1109/JBHI.2022.3199199. [DOI] [PubMed] [Google Scholar]
- [33].An J. and Cho S., “Variational autoencoder based anomaly detection using reconstruction probability,” in Special Lecture on IE, 2015, vol. 21, pp. 1–18. [Google Scholar]
- [34].Madiraju N. S., Sadat S. M., Fisher D., and Homa K. A., and Diego S., “Deep temporal clustering : Fully unsupervised learning of time-domain features,” Feb. 2018. Accessed: Jun. 05, 2023. [Online]. Available: https://arxiv.org/abs/1802.01059v1
- [35].Martinez J., Sel K., Mortazavi B. J., and Jafari R., “Boosted-SpringDTW for comprehensive feature extraction of PPG signals,” IEEE Open J. Eng. Med. Biol., vol. 3, pp. 78–85, 2022, doi: 10.1109/OJEMB.2022.3174806. [DOI] [PMC free article] [PubMed] [Google Scholar]
- [36].Athaya T. and Choi S., “A review of noninvasive methodologies to estimate the blood pressure waveform,” Sensors, vol. 22, no. 10, May 2022, Art. no. 3953, doi: 10.3390/S22103953. [DOI] [PMC free article] [PubMed] [Google Scholar]
- [37].Charlton P. H. et al. , “Breathing rate estimation from the electrocardiogram and photoplethysmogram: A review,” IEEE Rev. Biomed. Eng., vol. 11, pp. 2–20, Oct. 2018, doi: 10.1109/RBME.2017.2763681. [DOI] [PMC free article] [PubMed] [Google Scholar]
- [38].Ibrahim B. and Jafari R., “Cuffless blood pressure monitoring from a wristband with calibration-free algorithms for sensing location based on bio-impedance sensor array and autoencoder,” Sci. Rep., vol. 12, no. 1, pp. 1–14, Jan. 2022, doi: 10.1038/s41598-021-03612-1. [DOI] [PMC free article] [PubMed] [Google Scholar]
- [39].Hsu Y. C., Li Y. H., Chang C. C., and Harfiya L. N., “Generalized deep neural network model for cuffless blood pressure estimation with photoplethysmogram signal only,” Sensors, vol. 20, no. 19, Oct. 2020, Art. no. 5668, doi: 10.3390/S20195668. [DOI] [PMC free article] [PubMed] [Google Scholar]
- [40].El-Hajj C. and Kyriacou P. A., “Cuffless blood pressure estimation from PPG signals and its derivatives using deep learning models,” Biomed. Signal Process. Control, vol. 70, Sep. 2021, Art. no. 102984, doi: 10.1016/J.BSPC.2021.102984. [DOI] [Google Scholar]
- [41].Pearson K. A., Griffith C. A., Zellem R. T., Koskinen T. T., and Roudier G. M., “Ground-based spectroscopy of the exoplanet XO-2b using a systematic wavelength calibration,” Astronomical J., vol. 157, no. 1, Dec. 2018, Art. no. 21, doi: 10.3847/1538-3881/AAF1AE. [DOI] [Google Scholar]