

Abstract
Echinochrome A (Ech A), a marine biosubstance isolated from sea urchins, is a strong antioxidant, and its clinical form, histochrome, is being used to treat several diseases, such as ophthalmic, cardiovascular, and metabolic diseases. Cancer-associated fibroblasts (CAFs) are a component of the tumor stroma and induce phenotypes related to tumor malignancy, including epithelial–mesenchymal transition (EMT) and cancer stemness, through reciprocal interactions with cancer cells. Here, we investigated whether Ech A modulates the properties of CAFs and alleviates CAF-induced lung cancer cell migration. First, we observed that the expression levels of CAF markers, Vimentin and fibroblast-activating protein (FAP), were decreased in Ech A-treated CAF-like MRC5 cells. The mRNA transcriptome analysis revealed that in MRC5 cells, the expression of genes associated with cell migration was largely modulated after Ech A treatment. In particular, the expression and secretion of cytokine and chemokine, such as IL6 and CCL2, stimulating cancer cell metastasis was reduced through the inactivation of STAT3 and Akt in MRC5 cells treated with Ech A compared to untreated MRC5 cells. Moreover, while conditioned medium from MRC5 cells enhanced the migration of non-small cell lung cancer cells, conditioned medium from MRC5 cells treated with Ech A suppressed cancer cell migration. In conclusion, we suggest that Ech A might be a potent adjuvant that increases the efficacy of cancer treatments to mitigate lung cancer progression.
Keywords: CAF, Echinochrome A, Lung Cancer, Migration
Introduction
Lung cancer is one of the most lethal types of tumors worldwide and has a high incidence and low survival rate. Although there have been rapid advancements in the diagnosis and treatment of lung cancer, the 5-year survival rate of lung cancer patients remains poor [1]. Tumor metastasis occurs in a high number of patients with lung cancer, leading to an increase in cancer-related deaths [2, 3]. The tumor microenvironment (TME) is a major regulator of tumor cell survival and metastasis [4, 5]. Cancer cells that interact with components of the TME become more aggressive and spread from the primary tumor to other organs [6].
Cancer-associated fibroblasts (CAFs), the most abundant cells in the TME, can modulate the extracellular matrix (ECM) architecture and secrete tumorigenic growth factors, microRNAs (miRNAs) and exosomes, thereby stimulating cancer progression, invasion and metastasis [7–11]. Reciprocally, several factors produced by tumor cells can transform and activate normal fibroblasts to a CAF-like state [12]. CAFs express a unique subset of markers that can be used to distinguish them from inactivated fibroblasts, such as FAP, α-smooth muscle actin (α-SMA), platelet-derived growth factor receptor-α/β (PDGFR-α/β) and Vimentin [13], depending on the cancer type. As CAFs have multiple functions in tumor cell regulation, many studies have aimed to control the functions of CAFs, resulting in effective improvement of the TME as well as retardation of tumor progression [14].
Echinochrome A (Ech A; Fig. 1) is a natural red pigment derived from sea urchins [15–17]. Ech A, the active substance in the Russian drug Histochrom®, has favorable efficacy against diverse diseases and pathological processes, including ischemic heart disease, ophthalmic disease, lung fibrosis, and melanogenesis [18–21], via its antioxidant, antiviral, and anti-inflammatory activities [22, 23]. Furthermore, Ech A contains several hydroxyl groups suitable for free radical scavenging [24]; thus, we predict that Ech A has potential utility in the regulation of cytokines, growth factors, transcription, and immunomodulation [25]. It has been recently reported that the levels of proinflammatory cytokines in the blood decrease upon administration of Ech A in cardiovascular disease (CVD) patients [26]. Although Ech A exerts multifarious therapeutic effects on various diseases and exhibits low toxicity [27], the regulatory role of Ech A in disrupting the crosstalk between cancer cells and CAFs to impede tumor metastasis has not been elucidated. Therefore, here, we explored whether Ech A regulates the properties of CAFs to promote the inhibition of human lung cancer cell migration.
Fig. 1.
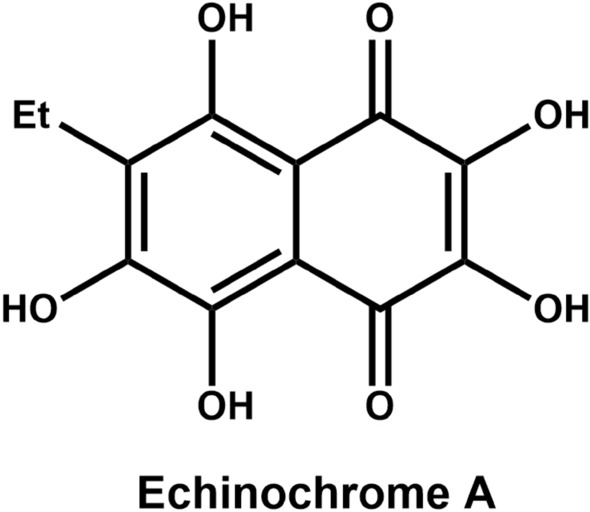
Chemical structure of Ech A
Materials and methods
Preparation of Ech A
Sea urchins (Scaphechinus mirabilis) were collected at Peter the Great Bay in the Sea of Japan. Taxonomic identification was performed by the Russian authors. The materials were extracted with EtOH containing 10% H2SO4 at ambient temperature. The resultant extract was then concentrated in a rotary evaporator under reduced pressure. The residue was partitioned between H2O and CHCl3 according to a previously described protocol [28]. The aqueous phase was extracted three times and discarded, whereas the organic phase was evaporated under reduced pressure on a rotary evaporator to yield the dried extract. The CHCl3 extract was separated first on a Toyopearl column using 20–50% EtOH containing 0.6% HCOOH as the eluent and then on a Sephadex LH-20 chromatography column (chloroform/ethanol, 7/1) to yield Ech A. The chemical structure of Ech A was confirmed by liquid chromatography–tandem mass spectrometry (LC‒MS/MS) and nuclear magnetic resonance (NMR) spectroscopy.
HPLC analysis of Ech A
A 10 mM stock solution of Ech A in DMSO was used for analysis. The solution was filtered through a 0.45 mm hydrophobic polytetrafluoroethylene (PTFE) filter and analyzed by semipreparative HPLC using SPD-20A/20AV Series Prominence HPLC UV‒Vis detectors (Shimadzu, Japan). Analysis was performed by injecting 15 μL of the sample onto a Phenomenex Luna C18 (4.6 × 100 mm, 3.5 μm) column. The mobile phase, consisting of formic acid in H2O [0.1% (v/v)] (A) and acetonitrile [0.1% (v/v)] (B), was delivered at a flow rate of 1 mL/min by applying the following programmed gradient elution profile: 0–100% (B) for 50 min, 100% (B) for 1 min, 100% (B) isocratic for 10 min, and 0% (B) isocratic for 10 min for postrun reconditioning of the column. Ech A was detected at 16.75 min (retention time) by semipreparative HPLC.
Cell lines and cell culture
MRC5 human lung fibroblasts were purchased from the Korean Cell Line Bank (#10,171, KCLB, Korea), and the non-small cell lung cancer (NSCLC) cell lines A549, H460 and H23 were purchased from the American Type Culture Collection (#CCL-185, #HTB-177, #CRL-5800, respectively, ATCC, USA). These cells were cultured in MEM (#LM007-54, Welgene, Korea) supplemented with 10% fetal bovine serum (FBS) (#35–015-CV, Corning, USA) and 1% antibiotic–antimycotic solution (#15,240–062, Gibco, USA). All cells were maintained in a humidified incubator containing 5% CO2 at 37 °C. Importantly, MRC5 cells were maintained for less than 20 passages.
RNA sequencing (RNA-seq) for transcriptome analysis
Transcriptome analysis was conducted through RNA-seq to investigate the variations in gene expression between the groups treated with and without Ech A. The Illumina platform was used for sequencing; the process ensured that the quality of each total read met the criteria, with a Q30 score exceeding 90% and a mapping rate greater than 95%. The reference genome index was constructed using HISAT2 v2.0.5 [29], and the read counts mapped to each gene were determined using featureCounts v1.5.0-p3 [30]. Subsequently, the fragments per kilobase of transcript per million mapped reads (FPKM) value for each gene was computed. Differential expression analysis between groups, with three biological replicates for each condition, was performed using the DESeq2 R package (version 1.20.0) [31]. The read counts were normalized by a scaling factor with the edgeR package [32]. Differential expression analysis between the two conditions was carried out using the edgeR R package (version 3.22.5).
Enrichment analysis of differentially expressed genes and data visualization
For the functional prediction of differentially expressed genes (DEGs), Gene Ontology (GO) enrichment analysis was performed by filtering genes with a p value less than 0.01 and a fold change (FC) greater than 2 utilizing the ToppFUN database (https://toppgene.cchmc.org/enrichment.jsp) [33]. Only GO terms with a p value ≦ 0.05 were considered significantly enriched. The results of GO enrichment analysis were visualized using shinyGO (http://bioinformatics.sdstate.edu/go/) [34], and the graphical representation included only the top 20 terms. A heatmap of 140 genes associated with cell migration was generated by quantifying FPKM values and subjecting them to log2 transformation. Visualization was performed using the R package heatmap (version 4.2.3) [35] and encompassed the entire experimental group.
Conditioned medium (CM)
To collect CM from MRC5 cells, cells were seeded in 6-well plates in complete MEM and cultured overnight. After treating the cells with DMSO or Ech A for 72 h, the culture medium was collected, centrifuged at 1000×g for 3 min at 4℃, and filtered through a 0.45 µm syringe filter (#16,533, Sartorius, Germany) to remove unattached cells and debris. The CM was stored at – 80 °C and used for cytokine array analysis, migration assays, and Western blotting.
Cell viability
Cells were seeded in 96-well plates at a density of 4000 cells per well in complete MEM and cultured overnight. After the cells were treated with DMSO or Ech A for 24, 48, or 72 h, their viability was determined using a Cell Counting Kit-8 (CCK-8) (#CK-04, Dojindo Laboratories, Japan) according to the manufacturer’s instructions. The optical density of the samples at 450 nm was measured using a microtiter plate spectrophotometer (Beckman Coulter, Inc., USA).
Quantitative reverse transcription–PCR (qRT‒PCR)
Total RNA was isolated using a Ribospin Kit (#304–150, GeneAll Biotechnology, Korea). The concentration of the isolated RNA was quantified using a NanoDrop ND-2000 spectrophotometer (Thermo Fisher Scientific, USA). The isolated RNA (1 μg) was reverse transcribed to cDNA with an iScript cDNA synthesis kit (#1,706,691, Bio-Rad, USA). The synthesized cDNA was amplified with SYBR Green (#RR420A, Takara, Japan) and subsequently analyzed using a LightCycler 96 system (#05815916001, Roche, Switzerland). Target gene expression was normalized to that of β-actin. The primers used are listed in Table 1.
Table 1.
Primer sequences targeting the genes in this study
Western blotting and antibodies
Protein concentrations were quantified using a Protein Assay Kit (#5,000,001, Bio-Rad, USA). Protein samples were loaded onto 4–12% Bis–Tris Plus gradient gels (#NW04120, Invitrogen, USA), and the proteins were transferred to polyvinylidene fluoride (PVDF) membranes (#10,600,100, GE Healthcare, USA). The membranes were blocked with 5% skim milk (#232,100, BD, USA) at room temperature for 1 h and incubated with primary antibodies at 4 °C overnight. The membranes were reprobed with secondary antibodies at room temperature for 2 h. Finally, the membranes were developed using enhanced chemiluminescence (ECL) solution (#RPN2109, GE Healthcare, USA), and images were acquired using an Amersham ImageQuant 800 (GE Healthcare, USA) imaging system. Antibodies against PARP-1 (#9542, Cell Signaling, USA), cleaved Caspase-3 (Asp175) (#9661, Cell Signaling, USA), β-Actin (SC-47778; Santa Cruz, USA), PDGFR-β (#3169, Cell Signaling, USA), Vimentin (#5741, Cell Signaling, USA), α-Smooth Muscle Actin (α-SMA) (#19,245, Cell Signaling, USA), FAP (#66,562, Cell Signaling, USA), Claudin-1 (#13,255, Cell Signaling, USA), STAT3 (#4904, Cell Signaling, USA), p-STAT3 (#9145, Cell Signaling, USA), Akt (#9272, Cell Signaling, USA) and p-Akt (#9271, Cell Signaling, USA) were used.
Cytokine array analysis
CM from MRC5 cells treated with DMSO or Ech A was analyzed using the Proteome Profiler Human Cytokine Array, which contains antibodies against 36 human cytokines (#ARY005B, R&D Systems, USA), according to the manufacturer’s instructions. In brief, membranes were incubated for 1 h in blocking buffer and were then incubated with samples containing detection antibody cocktail at 4 °C overnight. After incubation, the membranes were washed and were then incubated for 30 min with horseradish peroxidase (HRP)-conjugated streptavidin. Unbound reagents were washed away, and the membranes were developed with ECL solution. The array membranes were imaged using an Amersham ImageQuant 800 imaging system.
ELISA
To measure the concentrations of secreted interleukin-6 (IL-6) and chemokine (C–C motif) ligand 2 (CCL2)/MCP-1 in CM from cultured MRC5 cells (MRC5 CM) and CM from Ech A-treated MRC5 cells (MRC5 + Ech A CM), ELISA was performed using Human IL-6 DuoSet ELISA (#DY206, R&D Systems, USA) and Human CCL2/MCP-1 DuoSet ELISA (#DY279, R&D Systems, USA) kits according to the manufacturer’s instructions. Aliquots of 100 µL of supernatant from MRC5 cells cultured with DMSO or Ech A were assayed, and all the samples were measured in triplicate. The range of the standard curve was 0–600 pg/mL for IL-6 and 0–1000 pg/mL for CCL2/MCP-1. The optical density of the samples at 450 nm was measured using a microtiter plate spectrophotometer (Beckman Coulter, Inc., USA).
Migration assay
Transwell inserts (8 µm pore size; #353,097, Falcon, USA) were placed in 24-well plates. A total of 800 µL of CM (400 µL) mixed with complete medium (400 µL) was added to the lower compartment of each well. A549, H460, and H23 cells in serum-free medium were seeded in the upper compartment at a density of 1 × 10⁵ cells/150 µL per well and incubated for 24 h. Subsequently, the inserts were stained with 1% crystal violet solution in methanol at room temperature for 1 h. After washing, the nonmigrated cells were removed using a cotton swab. Cells were counted under an EVOS microscope (EVOS XL Cell Imaging System, Life Technologies, USA) at a magnification of 100×.
Statistical analysis
The statistical analyses were performed using GraphPad Prism 8 for Windows (GraphPad Software, San Diego, California). All the data are presented as the mean ± standard deviation (SD) values. Unpaired, two-tailed Student’s t test and one-way analysis of variance (ANOVA) with Tukey’s multiple comparisons test were used to calculate statistical significance. P < 0.05 was considered to indicate statistical significance.
Results
Assessment of cell viability following treatment with Ech A
The purity of the prepared pure Ech A was initially examined via semipreparative HPLC (Fig. 2a). The effect of EchA on the viability of human lung fibroblasts (MRC5) and three NSCLC cell lines (A549, H460, and H23) was analyzed via a CCK-8 assay. As shown in Fig. 2b, no marked changes in viability were observed in MRC5 cells or in any of the lung cancer cell lines treated with 10 μM Ech A at 24, 48 or 72 h. Similar to the cytotoxicity assay results, cleavage of the cell death-related proteins PARP-1 and Caspase-3 was not detected following treatment with 10 μM Ech A in any of the cell lines (Fig. 2c). To exclude the possibility of a direct cytotoxic effect of Ech A on MRC5 cells and cancer cell lines, we used 10 μM Ech A in all further experiments.
Fig. 2.

Effect of EchA on MRC5, A549, H460 and H23 cell viability. a HPLC analysis of Ech A (detection wavelength, 254 nm). b Cytotoxicity assay in MRC5, A549, H460 and H23 cells treated with different concentrations of Ech A for 24 h, 48 h, and 72 h. c Apoptosis-related proteins were analyzed via Western blotting. Samples containing equal amounts of protein (10 µg of protein from the cell lysate) were loaded. β-Actin was used as a loading control
Ech A-mediated differential gene expression in MRC5 cells
To determine whether Ech A modulates the CAF-like properties of MRC5 cells, we treated MRC5 cells with 10 µM Ech A for 72 h and measured the expression levels of CAF biomarkers, namely, PDGFR-β, Vimentin, FAP and α-SMA. When MRC5 cells were exposed to Ech A, the expression levels of Vimentin and FAP but not those of α-SMA and PDGFR-β decreased (Fig. 3a). To further characterize the regulatory effect of Ech A on gene expression, we performed mRNA transcriptome analysis in MRC5 cells treated with or without Ech A. Samples were collected at both the 24 h and 72 h time points under each experimental condition, and differences in gene expression were analyzed by comparing the values at 72 h with those at 24 h. DEGs were rigorously filtered based on the stringent criterion of a p value of 0.01 or lower and a FC of 2 or greater (Fig. 3b). The identified DEGs were subsequently systematically classified as upregulated or downregulated.
Fig. 3.

Transcriptome analysis for determining the effectiveness of Ech A treatment. a Expression levels of markers of CAFs in MRC5 cells treated with or without Ech A were measured via Western blotting (MRC5: untreated MRC5 cells; MRC5 + Ech A: Ech A-treated MRC5 cells). Protein samples isolated from human lung cancer cell lines, which express minimal amounts of CAF markers, were used as negative controls. β-Actin was used as a loading control. b Venn diagram displaying the overlap between MRC5 (72 h) and MRC5 + Ech A (72 h) cells. c The top 20 enriched GO terms based on the genes upregulated or downregulated under each condition; M72: MRC5 (72 h) compared to MRC5 (24 h), ME72: MRC5 + Ech A (72 h) compared to MRC5 + Ech A (24 h). d Heatmap showing genes associated with cell migration as determined by log2 transformation of the FPKM values. Dark gray, NA (Not Available)
GO analysis was subsequently performed to determine the functions associated with these DEGs (Fig. 3c). GO analysis revealed that the upregulated genes in the Ech A treatment group included genes directly or indirectly associated with cell migration. Conversely, for the downregulated genes, the most enriched GO terms were linked to the cell cycle, although a subset of terms related to cell migration were also discerned. In both the untreated (Ech A-negative) and treated groups, the common functions of the upregulated genes were linked to cell migration. However, by functional analysis of the downregulated genes, cell migration was identified specifically in the treated group. Thus, our interest was increased, prompting further exploration into the role of Ech A in modulating the expression of genes associated with decreased cell migration. Via GO analysis, we identified 140 genes directly associated with cell migration (Fig. 3d). Notably, among these genes, IL-6 and CCL2 exhibited significant differences in expression levels. Consequently, further validation experiments are warranted to conclusively elucidate the specific roles of IL-6 and CCL2 in the cell migration-related effects of Ech A.
Secretome analysis of MRC5 CM and MRC5 + Ech A CM
CAFs are key regulators of cancer progression and motility; thus, we examined changes in the secretion of cancer cell-regulating cytokines from MRC5 cells treated with Ech A. Because the transcriptome analysis revealed that the expression levels of several cytokine genes related to cancer cell migration were upregulated or downregulated (Fig. 3b–d), we first validated the mRNA expression levels of IL-6 and CCL2 in the same samples used for RNA-seq analysis. As expected, our qRT‒PCR results revealed decreases in IL-6 and CCL2 transcription in Ech A-treated MRC5 cells after 72 h of treatment, while no significant changes in IL-6 or CCL2 expression were detected at 24 h or 48 h (Fig. 4a).
Fig. 4.

Effect of EchA on cytokine production in MRC5 cells. a Validation of IL-6 and CCL2 mRNA expression by qRT‒PCR. mRNA was isolated from MRC5 cells cultured with or without Ech A (MRC5: untreated MRC5 cells; MRC5 + Ech A: Ech A-treated MRC5 cells). The expression levels of IL-6 and CCL2 after 24 h, 48 h and 72 h of treatment were measured via qRT‒PCR. The results are presented as the mean ± SD values. ns: MRC5 (24 h, 48 h) vs. MRC5 + Ech A (24 h, 48 h), *p < 0.05: MRC5 (72 h) vs. MRC5 + Ech A (72 h) using two-tailed Student’s t test. b Quantification of cytokine secretion from MRC5 cells cultured with or without Ech A for 72 h. Supernatants from cultured MRC5 cells cultured alone (MRC5 CM) or with Ech A (MRC5 + Ech A CM) were analyzed with a cytokine array kit. c Measurement of the concentrations of secreted IL-6 and CCL2 by ELISA with the same samples used for the cytokine array analysis. The results are presented as the mean ± SD values. *p < 0.05: MRC5 CM vs. MRC5 + Ech A CM using unpaired Student’s t test. d Phospho-STAT3 and phospho-Akt levels were determined after Ech A treatment in MRC5 cells via Western blotting. STAT3 and Akt were used as loading controls
Moreover, to explore the regulatory effect of Ech A on cytokine production in MRC5 cells, MRC5 CM and MRC5 + Ech A CM obtained after 72 h of culture were analyzed using a human cytokine array. As shown in Fig. 4b, the amounts of the following cytokines were decreased in MRC5 + Ech A CM compared to control MRC5 CM: CCL2, macrophage migration inhibitory factor (MIF), granulocyte–macrophage colony-stimulating factor (GM-CSF) and IL-6. To further support the qRT‒PCR and cytokine analysis results, the concentrations of secreted IL-6 and CCL2 proteins were measured via ELISA. Consistent with the results shown in Fig. 4a, b, the concentrations of secreted IL-6 and CCL2 were significantly lower in MRC5 + Ech A CM than in MRC5 CM (Fig. 4c).
Because the production of IL-6 and CCL2 is mainly regulated by STAT3 activation, we measured the level of STAT3 phosphorylation (p-STAT3) after 2, 4, 8 h of Ech A treatment in MRC5 cells. As shown in Fig. 4d, the level of p-STAT3 was gradually decreased. In addition, the phosphorylation level of Akt, which reciprocally communicates with STAT3, was downregulated after 8 h of Ech A treatment (Fig. 4d).
Regulatory role of Ech A in lung cancer cell migration
IL-6 and CCL2 play important roles in cancer cell motility. Because the concentrations of secreted IL-6 and CCL2 were decreased in MRC5 + Ech A CM, the migration of the NSCLC cell lines A549, H460 and H23 was evaluated using a transwell migration assay in the presence of MRC5 CM or MRC5 + Ech A CM. As shown in Fig. 5a I and II, Ech A alone did not affect the migration of A549, H460 or H23 cells compared to that in the corresponding untreated control groups. The addition of MRC5 CM to the assay medium clearly facilitated the migration of A549, H460 and H23 cells (Fig. 5a III). However, the migration of NSCLC cells was decreased in the presence of MRC5 + Ech A CM compared to MRC5 CM (Fig. 5a IV).
Fig. 5.

Regulation of lung cancer cell migration by conditioned medium from MRC5 cells cultured with or without Ech A. a Lung cancer cell migration assays were performed in the presence of MRC5 CM or MRC5 + Ech A CM (a: untreated control, b: Ech A-treated, c: MRC5 CM mixed at a 1:1 ratio with complete medium, d: MRC5 + Ech A CM mixed at a 1:1 ratio with complete medium). The results are presented as the mean ± SD values. ns: Control vs. Ech A, *p < 0.05: MRC5 CM vs. MRC5 + Ech A CM using one-way ANOVA (Tukey’s multiple comparisons test). b The expression levels of EMT markers (Vimentin and Claudin-1) were determined via Western blotting. Human lung cancer cell lines were cultured in a 1:1 mixture of CM with complete medium for 24 h. Samples containing equal amounts of protein (10 µg of protein from the cell lysate) were loaded. β-Actin was used as a loading control.
Because the migration ability of A549, H460 and H23 cells cultured with MRC5 CM differed from that upon culture with MRC5 + Ech A CM, the expression of the epithelial-mesenchymal transition (EMT)-related proteins Vimentin and Claudin-1 was evaluated via Western blot analysis. In A549 cells cultured with MRC5 CM, the expression levels of Vimentin and Claudin-1 were higher than those in A549 cells cultured with MRC5 + Ech A CM (Fig. 5b, left panel). Interestingly, a change in Vimentin expression was detected in H460 cells, but only a minimal change was detected in H23 cells, and the pattern of change in Claudin-1 expression change was directly opposite that of Vimentin in both H460 and H23 cells (Fig. 5b, middle and right panel). Thus, these results suggest that the mechanism of action of Ech A in cancer cell migration differs by cell type.
Discussion
Lung cancer is one of the most common and severe types of cancer and can be divided into two main types: small cell lung cancer (SCLC) and NSCLC. The majority (approximately 85%) of lung cancer cases are NSCLC. Because many lung cancer patients typically exhibit no symptoms until the disease is advanced, a better understanding of the mechanisms of lung cancer cell metastasis is needed to improve the survival of patients with advanced lung cancer.
Ech A exhibits cell type-specific cytotoxic activities. In MRC5 cells treated with various concentrations of Ech A, the cell viability rate was 80% after exposure to concentrations of up to 100 μM. In contrast, the viability of the tested NSCLC cells significantly decreased even after exposure to 25 μM Ech A (Fig. 2b, c). Recent studies have shown that 50 μM Ech A exhibits cytotoxicity in the B16F10 murine melanoma cell line [21], while no change in the viability of mouse embryonic stem cells was observed after exposure to concentrations of up to 500 μM [36]. Collectively, these results indicate that cancer cells are more susceptible to Ech A than are normal cells. Although treatment with high-dose Ech A induces cancer cell death, we used a noncytotoxic concentration (10 μM) of Ech A in MRC5 and NSCLC cell lines to determine the regulatory role of Ech A in the crosstalk between cancer cells and the TME.
Multiple mechanisms are involved in the transformation of normal fibroblasts to CAFs [12]. Activated CAFs promote tumor development and modify cancer therapeutic responses through the secretion of diverse substances, including growth factors and cytokines. Several studies have demonstrated that MRC5 human lung fibroblasts possess CAF-like properties that regulate cancer progression and metastasis in cancers such as hepatocellular carcinoma (HCC) [37], lung cancer [38, 39] and breast cancer [40]. After treatment with Ech A, the expression levels of the CAF markers Vimentin and FAP were decreased in MRC5 cells (Fig. 3a), suggesting that Ech A might decrease the activity of CAF-like MRC5 cells. Somewhat inconsistent with our results, a recent study reported that Ech A reversed the increase in the expression of α-SMA and fibronectin induced by transforming growth factor-beta 2 (TGF-β2) and interleukin-1 beta (IL-1β) in human umbilical vein endothelial cells (HUVECs) and that the activation of nuclear factor kappa-light-chain-enhancer of activated B cells (NF-ĸB) p-p65 by TGF-β2 and IL-1β was gradually reduced by Ech A in a dose-dependent manner [41]. Moreover, another study demonstrated that Ech A attenuated NF-ĸB p65 activation in endotoxin-induced uveitis (EIU) rat model [42]. The NF-ĸB signaling cascade is important for controlling gene transcription, cytokine synthesis and cell viability. Dysregulation of NF-ĸB is involved in the occurrence of cancer, inflammatory diseases, infectious diseases and other diseases [43]. Under exposure to various stimuli, NF-ĸB induces the production of cytokines, chemokines and adhesion molecules [44]. Our transcriptome and secretome analyses revealed that in MRC5 cells, Ech A inhibits the production of cancer cell migration-related cytokines, especially IL-6 and CCL2, whose expression is regulated mainly by NF-ĸB and/or STAT3 (Figs. 3b-d and 4a-c) [45, 46]. Similarly, one clinical study showed that the level of IL-6 in the blood was decreased in CVD patients treated with Ech A [26]. Therefore, it is plausible that Ech A might modify the activities of NF-ĸB and/or STAT3, resulting in inhibition of IL-6 and CCL2 expression in MRC5 cells. Although the phosphorylation level of STAT3 was decreased in Ech A treated MRC5 cells (Fig. 4d), the detailed mechanism through which Ech A modulates cytokine production will be further explored.
EMT is a process in which epithelial cells lose their polarity and adhesive ability and acquire migration and invasion ability, transforming into mesenchymal stem cells. Several cytokines, chemokines, growth factors and hypoxia induce EMT in cancer cells [2, 47, 48]. In particular, TGF-β2 and IL-6 play crucial roles in triggering EMT in tumor cells under exposure to various stimuli. Our study demonstrated that the migration of NSCLC cells was increased when they were cultured with MRC5 CM containing several secreted factors, such as IL-6 and CCL2 (Fig. 5a). Similar to our results, the invasion and migration of HCC cells have been reported to be facilitated by the addition of MRC5 CM [37]. In contrast, treatment with Ech A (MRC5 + Ech A CM) reversed the increase in the migration of NSCLC cells incubated with MRC5 CM, probably due to the absence of secreted factors from MRC5 cells. Along with our migration assay results, we found that the upregulation of the EMT markers Vimentin and Claudin-1 mediated by MRC5 CM treatment was decreased in NSCLC cells cultured with MRC5 + Ech A CM, albeit to different extents depending on the cell line (Fig. 5b). Vimentin is a structural protein that supports the positioning of organelles in the cytosol and is highly expressed in cells undergoing EMT during metastasis initiation [49]. In addition, although the function of Claudin-1 in EMT is controversial in different types of cancer, many studies have shown that an increase in Claudin-1 expression induces EMT, consistent with our results [50, 51].
In summary, herein, we provided the first data regarding the regulatory role of Ech A in cytokine production in CAFs. Furthermore, we found that the Ech A-mediated reduction in cytokine secretion from CAFs attenuates the migration of NSCLC cells. Thus, as Ech A regulates the secretion of IL-6 and CCL2 from MRC5 cells through the modulation of STAT3 and Akt activities, we are conducting further studies to explore the regulatory mechanism of Ech A in cytokine expression and to determine whether Ech A could be used as an adjuvant therapy in cancer treatment to improve the TME, thereby alleviating lung cancer cell metastasis.
Author contributions
All authors contributed to the study conception and design. Material preparation, data collection and analysis were performed by Da-Young Eum, Chaeyoung Lee Cong So Tran, Jinyoung Lee, Soon Yong Park, Mi-So Jeong, Yunho Jin, Jae Woong Shim, Seoung Rak Lee, Minseob Koh, Elena A. Vasileva, Natalia P. Mishchenko, Seong-Joon Park, and Si Ho Choi. The first draft of the manuscript was written by Kyu Heo, Hwayoung Yun and Yoo Jin Choi, and all authors commented on previous versions of the manuscript. All the authors have read and approved the final manuscript.
Funding
This work was supported by the a Dongnam Institute of Radiological & Medical Sciences (DIRAMS) grant funded by the Korean government (MSIT) (50591–2023), a National Research Foundation of Korea (NRF) grant funded by the Korean government (MSIT) (NRF-2021R1A2C1095736) and the National Research Foundation of Korea (NRF) grant funded by the Korea government (MSIT) (NRF-2023R1A2C1007018).
Data availability
RNA-Seq data were deposited into the Gene Expression Omnibus database under accession number GSE252587 and are available at the following URL: https://www.ncbi.nlm.nih.gov/geo/query/acc.cgi?acc=GSE252587
Code availability
Not applicable.
Declarations
Conflict of interest
The authors have no relevant financial or nonfinancial interests to disclose.
Ethics approval
Not applicable.
Consent to participate
Not applicable.
Consent to publish
Not applicable.
Footnotes
Da-Young Eum, Chaeyoung Lee and Cong So Tran have contributed equally to this work.
Contributor Information
Yoo Jin Choi, Email: cyj5325@dirams.re.kr.
Hwayoung Yun, Email: hyun@pusan.ac.kr.
Kyu Heo, Email: kyuh33@dirams.re.kr.
References
- 1.Siegel RL, Miller KD, Jemal A. Cancer statistics, 2018. CA Cancer J Clin. 2018;68:7–30. doi: 10.3322/caac.21442. [DOI] [PubMed] [Google Scholar]
- 2.Altorki NK, Markowitz GJ, Gao D, Port JL, Saxena A, Stiles B, McGraw T, Mittal V. The lung microenvironment: an important regulator of tumour growth and metastasis. Nat Rev Cancer. 2019;19:9–31. doi: 10.1038/s41568-018-0081-9. [DOI] [PMC free article] [PubMed] [Google Scholar]
- 3.Thiery JP, Acloque H, Huang RYJ, Nieto MA. Epithelial-mesenchymal transitions in development and disease. Cell. 2009;139:871–890. doi: 10.1016/j.cell.2009.11.007. [DOI] [PubMed] [Google Scholar]
- 4.Neophytou CM, Panagi M, Stylianopoulos T, Papageorgis P. The role of tumor microenvironment in cancer metastasis: molecular mechanisms and therapeutic opportunities. Cancers. 2021;13:2053. doi: 10.3390/cancers13092053. [DOI] [PMC free article] [PubMed] [Google Scholar]
- 5.Giraldo NA, Sanchez-Salas R, Peske JD, Vano Y, Becht E, Petitprez F, Validire P, Ingels A, Cathelineau X, Fridman WH, Sautès-Fridman C. The clinical role of the TME in solid cancer. Br J Cancer. 2019;120:45–53. doi: 10.1038/s41416-018-0327-z. [DOI] [PMC free article] [PubMed] [Google Scholar]
- 6.Kurose K, Hoshaw-Woodard S, Adeyinka A, Lemeshow S, Watson PH, Eng C. Genetic model of multi-step breast carcinogenesis involving the epithelium and stroma: clues to tumour–microenvironment interactions. Hum Mol Genet. 2001;10:1907–1913. doi: 10.1093/hmg/10.18.1907. [DOI] [PubMed] [Google Scholar]
- 7.Olumi AF, Grossfeld GD, Hayward SW, Carroll PR, Tlsty TD, Cunha GR. Carcinoma-associated fibroblasts direct tumor progression of initiated human prostatic epithelium. Cancer Res. 1999;59:5002–5011. doi: 10.1186/bcr138. [DOI] [PMC free article] [PubMed] [Google Scholar]
- 8.Bhome R, Goh RW, Bullock MD, et al. Exosomal microRNAs derived from colorectal cancer-associated fibroblasts: role in driving cancer progression. Aging. 2017;9:2666–2694. doi: 10.18632/aging.101355. [DOI] [PMC free article] [PubMed] [Google Scholar]
- 9.Bhome R, Goh R, Pickard K, Mellone M, Sayan AE, Mirnezami A. Profiling the microRNA payload of exosomes derived from ex vivo primary colorectal fibroblasts. Methods Mol Biol. 2017;1509:115–122. doi: 10.1007/978-1-4939-6524-3_11. [DOI] [PMC free article] [PubMed] [Google Scholar]
- 10.Luga V, Zhang L, Viloria-Petit Alicia M, Ogunjimi Abiodun A, Inanlou Mohammad R, Chiu E, Buchanan M, Hosein Abdel N, Basik M, Wrana Jeffrey L. Exosomes mediate stromal mobilization of autocrine Wnt-PCP signaling in breast cancer cell migration. Cell. 2012;151:1542–1556. doi: 10.1016/j.cell.2012.11.024. [DOI] [PubMed] [Google Scholar]
- 11.Erdogan B, Webb DJ. Cancer-associated fibroblasts modulate growth factor signaling and extracellular matrix remodeling to regulate tumor metastasis. Biochem Soc Trans. 2017;45:229–236. doi: 10.1042/BST20160387. [DOI] [PMC free article] [PubMed] [Google Scholar]
- 12.Sahai E, Astsaturov I, Cukierman E, et al. A framework for advancing our understanding of cancer-associated fibroblasts. Nat Rev Cancer. 2020;20:174–186. doi: 10.1038/s41568-019-0238-1. [DOI] [PMC free article] [PubMed] [Google Scholar]
- 13.Han C, Liu T, Yin R. Biomarkers for cancer-associated fibroblasts. Biomark Res. 2020;8:64. doi: 10.1186/s40364-020-00245-w. [DOI] [PMC free article] [PubMed] [Google Scholar]
- 14.Cheng SH, Chiou HYC, Wang JW, Lin MH. Reciprocal regulation of cancer-associated fibroblasts and tumor microenvironment in gastrointestinal cancer: implications for cancer dormancy. Cancers. 2023;15:2513. doi: 10.3390/cancers15092513. [DOI] [PMC free article] [PubMed] [Google Scholar]
- 15.Anderson HA, Mathieson JW, Thomson RH. Distribution of spinochrome pigments in echinoids. Comp Biochem Physiol. 1969;28:333–345. doi: 10.1016/0010-406x(69)91347-4. [DOI] [PubMed] [Google Scholar]
- 16.Vasileva EA, Mishchenko NP, Tran VTT, Vo HMN, Bui LM, Denisenko VA, Fedoreyev SA. Quinoid pigments from the sea urchin Astropyga radiata. Chem Nat Compd. 2017;53:356–358. doi: 10.1007/s10600-017-1988-1. [DOI] [Google Scholar]
- 17.Gerasimenko AV, Fedoreyev SA, Mischenko NP. Molecular and crystal structure of the echinochrome complex with dioxane. Crystallogr Rep. 2006;51:42–46. doi: 10.1134/s1063774506010093. [DOI] [Google Scholar]
- 18.Kim R, Hur D, Kim HK, Han J, Mishchenko NP, Fedoreyev SA, Stonik VA, Chang W. Echinochrome A attenuates cerebral ischemic injury through regulation of cell survival after middle cerebral artery occlusion in rat. Mar Drugs. 2019;17:501. doi: 10.3390/md17090501. [DOI] [PMC free article] [PubMed] [Google Scholar]
- 19.Afanas'ev SA, Lasukova TV, Chernyavskii AM. ATP-sparing effect of histochrome in acute myocardial ischemia in patients with coronary heart disease. Bull Exp Biol Med. 1997;124:1217–1219. doi: 10.1007/bf02445124. [DOI] [Google Scholar]
- 20.Park GT, Yoon JW, Yoo SB, et al. Echinochrome A treatment alleviates fibrosis and inflammation in bleomycin-induced scleroderma. Mar Drugs. 2021;19:237. doi: 10.3390/md19050237. [DOI] [PMC free article] [PubMed] [Google Scholar]
- 21.Choi MR, Lee H, Kim HK, Han J, Seol JE, Vasileva EA, Mishchenko NP, Fedoreyev SA, Stonik VA, Ju WS, Kim D-J, Lee S-R. Echinochrome A inhibits melanogenesis in B16F10 cells by downregulating CREB signaling. Mar Drugs. 2022;20:555. doi: 10.3390/md20090555. [DOI] [PMC free article] [PubMed] [Google Scholar]
- 22.Sadek SA, Hassanein SS, Mohamed AS, Soliman AM, Fahmy SR. Echinochrome pigment extracted from sea urchin suppress the bacterial activity, inflammation, nociception, and oxidative stress resulted in the inhibition of renal injury in septic rats. J Food Biochem. 2022;46:e13729. doi: 10.1111/jfbc.13729. [DOI] [PubMed] [Google Scholar]
- 23.Fedoreyev SA, Krylova NV, Mishchenko NP, Vasileva EA, Pislyagin EA, Iunikhina OV, Lavrov VF, Svitich OA, Ebralidze LK, Leonova GN. Antiviral and antioxidant properties of echinochrome A. Mar Drugs. 2018;16:509. doi: 10.3390/md16120509. [DOI] [PMC free article] [PubMed] [Google Scholar]
- 24.Rubilar T, Barbieri ES, Gazquez A, Avaro M. Sea urchin pigments: echinochrome A and its potential implication in the cytokine storm syndrome. Mar Drugs. 2021;19:267. doi: 10.3390/md19050267. [DOI] [PMC free article] [PubMed] [Google Scholar]
- 25.Camini FC, da Silva Caetano CC, Almeida LT, de Brito Magalhães CL. Implications of oxidative stress on viral pathogenesis. Arch Virol. 2017;162:907–917. doi: 10.1007/s00705-016-3187-y. [DOI] [PubMed] [Google Scholar]
- 26.Artyukov AA, Zelepuga EA, Bogdanovich LN, Lupach NM, Novikov VL, Rutckova TA, Kozlovskaya EP. Marine polyhydroxynaphthoquinone, echinochrome A: prevention of atherosclerotic inflammation and probable molecular targets. J Clin Med. 2020;9:1494. doi: 10.3390/jcm9051494. [DOI] [PMC free article] [PubMed] [Google Scholar]
- 27.Shikov AN, Pozharitskaya ON, Krishtopina AS, Makarov VG. Naphthoquinone pigments from sea urchins: chemistry and pharmacology. Phytochem Rev. 2018;17:509–534. doi: 10.1007/s11101-018-9547-3. [DOI] [Google Scholar]
- 28.Mischenko NP, Fedoreyev SA, Pokhilo ND, Anufriev VP, Denisenko VA, Glazunov VP. Echinamines A and B, first aminated hydroxynaphthazarins from the sea urchin Scaphechinus mirabilis. J Nat Prod. 2005;68:1390–1393. doi: 10.1021/np049585r. [DOI] [PubMed] [Google Scholar]
- 29.Kim D, Langmead B, Salzberg SL. HISAT: a fast spliced aligner with low memory requirements. Nat Methods. 2015;12:357–360. doi: 10.1038/nmeth.3317. [DOI] [PMC free article] [PubMed] [Google Scholar]
- 30.Liao Y, Smyth GK, Shi W. featureCounts: an efficient general purpose program for assigning sequence reads to genomic features. Bioinformatics. 2014;30:923–930. doi: 10.1093/bioinformatics/btt656. [DOI] [PubMed] [Google Scholar]
- 31.Love MI, Huber W, Anders S. Moderated estimation of fold change and dispersion for RNA-seq data with DESeq2. Genome Biol. 2014;15:550. doi: 10.1186/s13059-014-0550-8. [DOI] [PMC free article] [PubMed] [Google Scholar]
- 32.Robinson MD, McCarthy DJ, Smyth GK. edgeR: a Bioconductor package for differential expression analysis of digital gene expression data. Bioinformatics (Oxford, England) 2010;26:139–140. doi: 10.1093/bioinformatics/btp616. [DOI] [PMC free article] [PubMed] [Google Scholar]
- 33.Chen J, Bardes EE, Aronow BJ, Jegga AG. ToppGene Suite for gene list enrichment analysis and candidate gene prioritization. Nucleic Acids Res. 2009;37:W305–W311. doi: 10.1093/nar/gkp427. [DOI] [PMC free article] [PubMed] [Google Scholar]
- 34.Ge SX, Jung D, Yao R. ShinyGO: a graphical gene-set enrichment tool for animals and plants. Bioinformatics (Oxford, England) 2020;36:2628–2629. doi: 10.1093/bioinformatics/btz931. [DOI] [PMC free article] [PubMed] [Google Scholar]
- 35.Raivo K (2019) Package ‘pheatmap’. Publishing CRAN Web. https://cran.r-project.org/web/packages/pheatmap/pheatmap.pdf. Accessed 4 Jan 2019
- 36.Kim HK, Cho SW, Heo HJ, Jeong SH, Kim M, Ko KS, Rhee BD, Mishchenko NP, Vasileva EA, Fedoreyev SA, Stonik VA, Han J. A novel atypical PKC-Iota inhibitor, echinochrome A, enhances cardiomyocyte differentiation from mouse embryonic stem cells. Mar Drugs. 2018;16:192. doi: 10.3390/md16060192. [DOI] [PMC free article] [PubMed] [Google Scholar]
- 37.Ding S, Chen G, Zhang W, Xing C, Xu X, Xie H, Lu A, Chen K, Guo H, Ren Z, Zheng S, Zhou L. MRC-5 fibroblast-conditioned medium influences multiple pathways regulating invasion, migration, proliferation, and apoptosis in hepatocellular carcinoma. J Transl Med. 2015;13:237. doi: 10.1186/s12967-015-0588-8. [DOI] [PMC free article] [PubMed] [Google Scholar]
- 38.Wang W, Li Q, Takeuchi S, et al. Met kinase inhibitor E7050 reverses three different mechanisms of hepatocyte growth factor–induced tyrosine kinase inhibitor resistance in EGFR mutant lung cancer. Clin Cancer Res. 2012;18:1663–1671. doi: 10.1158/1078-0432.ccr-11-1171. [DOI] [PubMed] [Google Scholar]
- 39.Kayalar O, Oztay F, Ongen HG. Gastrin-releasing peptide induces fibrotic response in MRC5s and proliferation in A549s. Cell Commun Signal. 2020;18:96. doi: 10.1186/s12964-020-00585-y. [DOI] [PMC free article] [PubMed] [Google Scholar]
- 40.Heylen N, Baurain R, Remacle C, Trouet A. Effect of MRC-5 fibroblast conditioned medium on breast cancer cell motility and invasion in vitro. Clin Exp Metast. 1998;16:193–203. doi: 10.1023/a:1006532523152. [DOI] [PubMed] [Google Scholar]
- 41.Song BW, Kim S, Kim R, et al. Regulation of inflammation-mediated endothelial to mesenchymal transition with echinochrome a for improving myocardial dysfunction. Mar Drugs. 2022;20:756. doi: 10.3390/md20120756. [DOI] [PMC free article] [PubMed] [Google Scholar]
- 42.Lennikov A, Kitaichi N, Noda K, Mizuuchi K, Ando R, Dong Z, Fukuhara J, Kinoshita S, Namba K, Ohno S, Ishida S. Amelioration of endotoxin-induced uveitis treated with the sea urchin pigment echinochrome in rats. Mol Vis. 2014;20:171–177. [PMC free article] [PubMed] [Google Scholar]
- 43.Taniguchi K, Karin M. NF-κB, inflammation, immunity and cancer: coming of age. Nat Rev Immunol. 2018;18:309–324. doi: 10.1038/nri.2017.142. [DOI] [PubMed] [Google Scholar]
- 44.Liu T, Zhang L, Joo D, Sun S-C. NF-κB signaling in inflammation. Signal Transduct Target Ther. 2017;2:17023. doi: 10.1038/sigtrans.2017.23. [DOI] [PMC free article] [PubMed] [Google Scholar]
- 45.Yoon S, Woo SU, Kang JH, Kim K, Shin HJ, Gwak HS, Park S, Chwae YJ. NF-κB and STAT3 cooperatively induce IL6 in starved cancer cells. Oncogene. 2012;31:3467–3481. doi: 10.1038/onc.2011.517. [DOI] [PubMed] [Google Scholar]
- 46.Grivennikov SI, Karin M. Dangerous liaisons: STAT3 and NF-kappaB collaboration and crosstalk in cancer. Cytokine Growth Factor Rev. 2010;21:11–19. doi: 10.1016/j.cytogfr.2009.11.005. [DOI] [PMC free article] [PubMed] [Google Scholar]
- 47.Kalluri R, Weinberg RA. The basics of epithelial-mesenchymal transition. J Clin Investig. 2010;120:1786. doi: 10.1172/jci39104c1. [DOI] [PMC free article] [PubMed] [Google Scholar]
- 48.Zhang L, Huang G, Li X, Zhang Y, Jiang Y, Shen J, Liu J, Wang Q, Zhu J, Feng X, Dong J, Qian C. Hypoxia induces epithelial-mesenchymal transition via activation of SNAI1 by hypoxia-inducible factor -1α in hepatocellular carcinoma. BMC Cancer. 2013;13:108. doi: 10.1186/1471-2407-13-108. [DOI] [PMC free article] [PubMed] [Google Scholar]
- 49.Huang Y, Hong W, Wei X. The molecular mechanisms and therapeutic strategies of EMT in tumor progression and metastasis. J Hematol Oncol. 2022;15:129. doi: 10.1186/s13045-022-01347-8. [DOI] [PMC free article] [PubMed] [Google Scholar]
- 50.Chang JW, Seo ST, Im MA, Won H-R, Liu L, Oh C, Jin YL, Piao Y, Kim HJ, Kim JT, Jung SN, Koo BS. Claudin-1 mediates progression by regulating EMT through AMPK/TGF-β signaling in head and neck squamous cell carcinoma. Transl Res. 2022;247:58–78. doi: 10.1016/j.trsl.2022.04.003. [DOI] [PubMed] [Google Scholar]
- 51.Suh Y, Yoon CH, Kim RK, Lim EJ, Oh YS, Hwang SG, An S, Yoon G, Gye MC, Yi JM, Kim MJ, Lee SJ. Claudin-1 induces epithelial–mesenchymal transition through activation of the c-Abl-ERK signaling pathway in human liver cells. Oncogene. 2013;32:4873–4882. doi: 10.1038/onc.2012.505. [DOI] [PubMed] [Google Scholar]
Associated Data
This section collects any data citations, data availability statements, or supplementary materials included in this article.
Data Availability Statement
RNA-Seq data were deposited into the Gene Expression Omnibus database under accession number GSE252587 and are available at the following URL: https://www.ncbi.nlm.nih.gov/geo/query/acc.cgi?acc=GSE252587
Not applicable.