

Abstract
Transcriptional cofactors of the ETO family are recurrent fusion partners in acute leukemia. We characterized the ETO2 regulome by integrating transcriptomic and chromatin binding analyses in human erythroleukemia xenografts and controlled ETO2 depletion models. We demonstrate that beyond its well‐established repressive activity, ETO2 directly activates transcription of MYB, among other genes. The ETO2‐activated signature is associated with a poorer prognosis in erythroleukemia but also in other acute myeloid and lymphoid leukemia subtypes. Mechanistically, ETO2 colocalizes with EP300 and MYB at enhancers supporting the existence of an ETO2/MYB feedforward transcription activation loop (e.g., on MYB itself). Both small‐molecule and PROTAC‐mediated inhibition of EP300 acetyltransferases strongly reduced ETO2 protein, chromatin binding, and ETO2‐activated transcripts. Taken together, our data show that ETO2 positively enforces a leukemia maintenance program that is mediated in part by the MYB transcription factor and that relies on acetyltransferase cofactors to stabilize ETO2 scaffolding activity.

INTRODUCTION
Acute myeloid leukemia (AML) is characterized by acquisition of mutations in hematopoietic stem and progenitor cells leading to the pathological accumulation of cells blocked in terminal differentiation. AML genetic profiling identified recurrent alterations in transcription factors and epigenetic regulators, 1 which contribute to impaired differentiation and leukemogenesis. 2 While the targeting of AML mutations has allowed some precise therapies (i.e., PML‐RARA or IDH1/2), 3 , 4 most transcriptional alterations still cannot be efficiently targeted.
Transcriptional regulation is mediated by interactions between DNA‐binding transcription factors and non‐DNA‐binding components, including epigenetic regulators with enzymatic functions (e.g., CBP/EP300, DOT1L, HDAC) but also scaffolding cofactors that contribute to formation of protein complexes through protein‐protein interactions or oligomerization properties (e.g., MENIN, LDB1, LMO2). 5 Both groups represent therapeutic targets as exemplified by the promising effects of therapeutic molecules targeting essential mediators of MLL fusions DOT1L or MENIN. 2 , 6 , 7 However, small‐molecule inhibitors efficiently targeting the transcriptional program controlled by scaffolding cofactors that functionally cross‐talk with several partners are generally lacking.
Among these scaffolding proteins are the ETO family of transcription cofactors, including RUNX1T1 (a.k.a. ETO), CBFA2T2, and CBFA2T3 (thereafter named ETO2), which have been shown to associate in complexes with GATA, ETS, and RUNX transcription factors. 8 In mice, inactivation of Eto2, but not Runx1t1 and Cbfa2t2, results in hematopoiesis failure, including a drastic decrease in the number of HSC and erythroid progenitors, indicating a prominent role of ETO2 in their homeostasis. 9 , 10 Molecularly, ETO2 is primarily known as a transcriptional corepressor through recruitment of repressors including NCOR and mSin3A. 11 , 12 , 13 ETO family members are recurrently targeted by leukemia‐associated driver fusion oncogenes such as RUNX1‐RUNX1T1 and RUNX1‐ETO2 in AML, ETO2‐GLIS2 in acute megakaryoblastic leukemia (AMKL), and NFIA‐ETO2/ETO in pediatric acute erythroid leukemia (AEL). 14 , 15 , 16 , 17 , 18 While the essential contribution of ETO activity was demonstrated in human leukemia, including through interference with nervy homology region (NHR)2 domain peptides that abrogate RUNX1‐RUNX1T1 and ETO2‐GLIS2 disease maintenance, 19 , 20 the poor stability and lack of cell permeability currently preclude its clinical application. Therefore, a surrogate approach to efficiently target the ETO‐controlled transcriptional program with small‐molecule inhibitors will be relevant.
Here, we characterized an ETO2‐controlled transcriptional program in human acute leukemia and identified molecular dependencies on which this program relies. Analyses were initiated in AEL, an aggressive disease representing 3%–5% of AML, in which gene expression analyses recently revealed aberrantly high expression of GATA1‐complex factors, including of ETO2, in more than 25% of AEL patients. 21 We found that interfering with ETO2 function abrogates human AEL model maintenance both in vitro and in vivo. Integrative analysis of ETO2 chromatin binding in patient‐derived cells with gene expression profiling in a model of controlled ETO2 depletion allowed us to identify direct target genes and showed that ETO2 controls several hematopoietic regulators through the binding to numerous regulatory chromatin regions including enhancers. Besides its well‐known repressor function of erythroid differentiation, ETO2 also positively regulates a core subset of genes essential for the maintenance of different acute leukemia subtypes. Notably, we identified an ETO2 complex‐interacting epigenetic cofactor required to maintain ETO2 protein and amenable to pharmacological inhibition.
RESULTS
Peptide interference with the NHR2 domain abrogates erythroleukemia maintenance
To interfere with ETO factor function, we expressed a small‐peptide NC128, homologous to the ETO2 NHR2 domain and previously described to impair dimerization and activity of ETO family proteins. 20 In both HEL and K562 human AEL cell lines, the lentiviral ectopic expression of NC128 compromised cell proliferation, through increased cell death and reduced cell cycle progression, and increased erythroid cell markers expression, including CD36 and hemoglobin (Figures 1A–E and S1A–C). Ectopic expression of NC128 in leukemic cells obtained from three distinct AEL patient‐derived xenograft (PDX) models also inhibited cell proliferation ex vivo as compared to empty vector control (Figure 1F). Notably, NC128 expression increased the expression of erythroid‐associated genes, including GATA1 and HBA1, indicating progression into erythroid differentiation of human AEL cells (Figure S1D,E).
Figure 1.
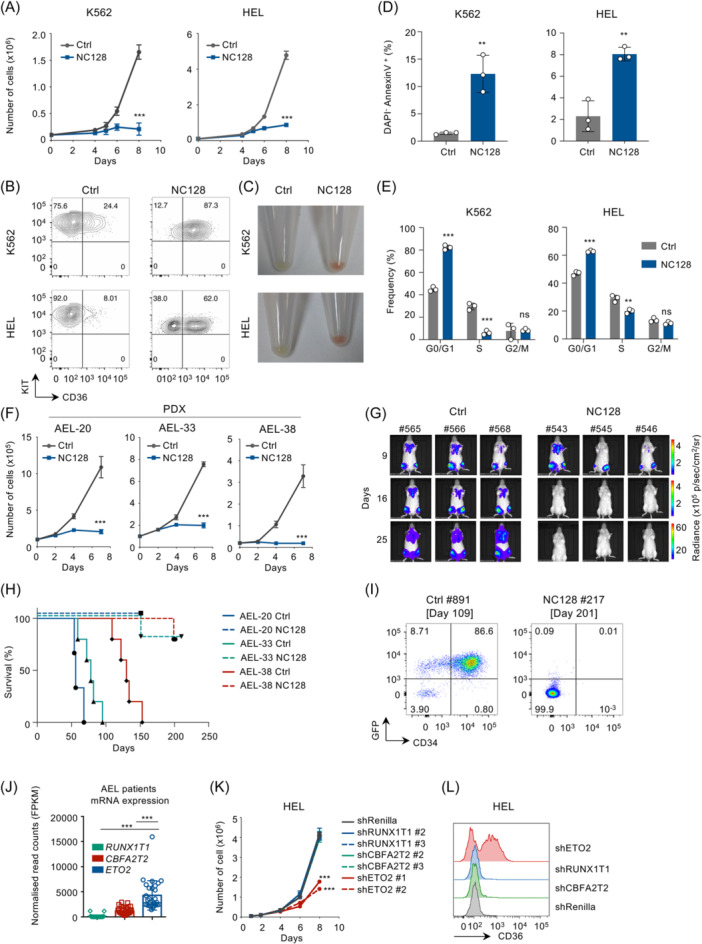
ETO protein activity is essential for erythroleukemia cell survival. (A) Cell proliferation of the human erythroid cell lines K562 and HEL transduced with the NC128 or empty lentiviral (Ctrl) vectors expressing also a GFP reporter. Transduced (GFP+) cells were sorted 24 h after transduction, 100.000 cells per replicate were plated in culture medium for proliferation assay, and viable cells were then enumerated over time using trypan blue reagent; n = 3 technical replicates. (B) KIT and CD36 expression measured by flow cytometry in K562 and HEL erythroid cell lines expressing NC128 or empty vector (Ctrl) at 72 h posttransduction. The plots are gated on viable (SYTOX Blue‐negative) GFP+ (expressing NC128/Ctrl) cells as represented in Figure S1A. The result is representative of n = 3 technical replicates. (C) Photographs of pelleted K562 and HEL cell lines 5 days posttransduction with NC128 or empty vector (Ctrl). GFP+ cells were sorted 24 h after transduction and plated in culture medium. (D) Quantification of DAPI− AnnexinV+ cells measured by flow cytometry in HEL and K562 cell lines expressing NC128 or empty vector (Ctrl) at 72 h posttransduction. GFP+ cells were sorted 24 h after transduction and 500.000 cells per replicate were plated in culture medium. Plots are gated on single GFP+ cells as represented in Figure S1B; n = 3 technical replicates per condition. (E) Cell cycle analysis performed by DNA quantification using 4′,6‐diamidino‐2‐phenylindole staining and measured by flow cytometry in HEL and K562 cell lines expressing NC128 or empty vector (Ctrl); 72 h posttransduction. Plots are gated as represented in Figure S1C. GFP+ cells were sorted 24 h after transduction and 500.000 cells per replicate were plated in culture medium; n = 3 technical replicates per condition. (F) Cell proliferation of AEL PDX models (AEL‐20, AEL‐33, and AEL‐38) expressing NC128 or empty vector (Ctrl) maintained ex vivo. GFP+ cells were sorted 24 h after transduction and 100.000 cells (AEL‐20 & AEL‐33) or 20.000 cells (AEL‐38) per replicate were plated in culture medium. Viable cells were enumerated using trypan blue reagent; n = 3 technical replicates. (G) Whole‐body bioluminescence images of NSG mice injected with 5 × 10⁵ of patient‐derived luciferase‐positive AEL cells (AEL‐20) expressing NC128 (mice #543, #544, and #546) or empty vector (Ctrl; mice #565, #566, and #568). Cells were transduced and sorted at 24 h posttransduction based on high GFP level and then transplanted in recipient mice. Mice were analyzed at 9, 16, and 25 days posttransplantation (n = 3 recipients per group; luciferase intensity are represented as photons/s/cm2/sr [p/s/cm2/sr]). (H) Kaplan–Meier survival curve of NSG recipient mice transplanted with 5 × 10⁵ of AEL PDX cells (AEL‐20, n = 3 technical replicates/group; AEL‐33, n = 5 technical replicates/group or AEL‐38, n = 5 technical replicates/group) expressing NC128 or empty vector (Ctrl). For two animals in the NC128 groups, while we have no evidence that these animals had a phenotypic leukemia, a death event was indicated because either an animal was found dead in cage and showed a significant proportion of GFP‐negative human cells quantified by flow cytometry (AEL‐33 #521), or no flow cytometry data were available to exclude the lack of human cells (AEL‐38 #284). (I) Flow cytometry analysis of the bone marrow from NSG recipient mice injected with 5 × 10⁵AEL PDX cells (AEL‐38) transduced with either NC128 (mouse ID #217) or empty (Ctrl; mouse ID #891) lentiviruses. Analyses were performed at day 201 and 109 posttransplantation, respectively. Plot representing human CD34 and GFP expression was gated on viable (SYTOX Blue‐negative) cells. (J) Histogram representing RUNX1T1, CBFA2T2, and ETO2 genes expression measured by RNA‐seq in AEL patient samples; 20 n = 29 patients. (K) Cell proliferation of HEL cell line expressing short hairpin RNA (shRNA) targeting RUNX1T1, CBFA2T2, ETO2, or Renilla, using 2 shRNA per genes. GFP+ cells were sorted 24 h after transduction, and 50.000 cells per replicate were plated in culture medium. Viable cells were enumerated using trypan blue reagent; n = 3 technical replicates. (L) Flow cytometry analysis of human CD36 gene expression of HEL cell line expressing shRNA targeting RUNX1T1, CBFA2T2, ETO2, or Renilla. GFP+ cells were sorted 24 h after transduction and plated in culture medium. Analysis was performed at 72 h posttransduction. Plots were gated on viable (SYTOX Blue‐negative) GFP+ (expressing shRNA) cells as shown in Figure S2D; n = 3 technical replicates. Data in (C) are representative of >4 independent experimental repeats, and data in (A, B, D, E, K, L) are representative of three independent experimental repeats. Mean ± SEM is represented. Statistical significance is indicated as p‐values (Student t test except when otherwise specified). *p < 0.05; **p < 0.01; ***p < 0.001.
To define the consequence of targeted interference with ETO factors in disease development capacities in vivo, we transduced cells from three AEL xenograft models (including a luciferase‐positive model) with NC128 or empty vector (Ctrl) and transplanted flow‐sorted transduced (GFP+) cells in NSG mice. Initial engraftment at 9 days posttransplantation did not show any difference between Ctrl and NC128 AEL‐20 recipients (Figures 1G and S1F). Ctrl recipients showed disease progression with a median survival of 57 days (AEL‐20), 78 days (AEL‐33), and 125 days (AEL‐38) (Figure 1H and Table S1). NC128 recipients did not develop disease within a 5‐ to 7‐month follow‐up (Figure 1G,H). Flow cytometry of bone marrow cells from NC128 recipients at endpoint confirmed impairment of AEL development (Figure 1I), with most animals showing no human cells and only one animal (AEL‐33 #521) showing a significant proportion of CD34+GFP− population supporting loss of NC128 expression. Altogether, these observations suggest that ETO factors are essential for AEL propagation.
Within the ETO family, genetic inactivation of Eto2 in mice leads to major hematopoietic failures, which is not observed for Runx1t1 or Cbfa2t2. 9 , 10 In addition, ETO2 is more highly expressed than RUNX1T1 and CBFA2T2 in human AEL cell lines and patient‐derived cells (Figures 1J and S2A). To dissect the contribution of each ETO member to support AEL cell maintenance, we performed short hairpin RNA (shRNA)‐mediated knock‐down of RUNX1T1, CBFA2T2, or ETO2 in HEL and K562 cells. While inhibition of RUNX1T1 and CBFA2T2 did not significantly change cell proliferation in both cell lines compared to control shRNA (shRenilla), ETO2 knock‐down remarkably compromised cell growth associated with an increased expression of erythroid cell surface marker (Figures 1K,L and 2B,C). Notably, molecular analysis also revealed that only ETO2 knock‐down resulted in increase of GATA1 gene expression compared to control shRNA in both cell lines (Figure S2D,E). Therefore, these data demonstrate that ETO2 is the predominant ETO‐family factor for AEL cell maintenance.
Transcriptional consequences of ETO2 genetic ablation in human leukemia cell lines
In order to specifically identify ETO2 transcriptional targets, we genetically inactivated endogenous ETO2 using CRISPR/Cas9 system in HEL and K562 cells by engineering a deletion between intron 6 and intron 8, thereby removing exons coding for the conserved NHR2 domain generating an out‐of‐frame protein. To avoid a counter‐selection of engineered cells, we first transduced the cells with a doxycycline (DOX) inducible lentiviral vector encoding the human ETO2 complementary DNA (cDNA) and maintain an ETO2 expression through DOX treatment during genome engineering (Figure 2A). Homozygous deletion of endogenous ETO2 was validated by polymerase chain reaction and DNA sequencing (Figure S3A). Western blot analyses of extracts from deleted clones (subsequently named HEL‐ETO2KO and K562‐ETO2KO) at several time points following DOX removal showed a gradual decrease of ETO2 protein level to reach an undetectable level 6 days post‐DOX removal (Figure 2B). The functional consequence of ETO2 inactivation was confirmed by the decreased cell proliferation, with increased apoptosis and decreased cell cycle progression, as well as increased CD36 expression and hemoglobin production associated with increased GATA1 and HBA1 messenger RNA (mRNA) levels upon DOX withdrawal in both cell lines (Figures 2C–F and S3B,C).
Figure 2.
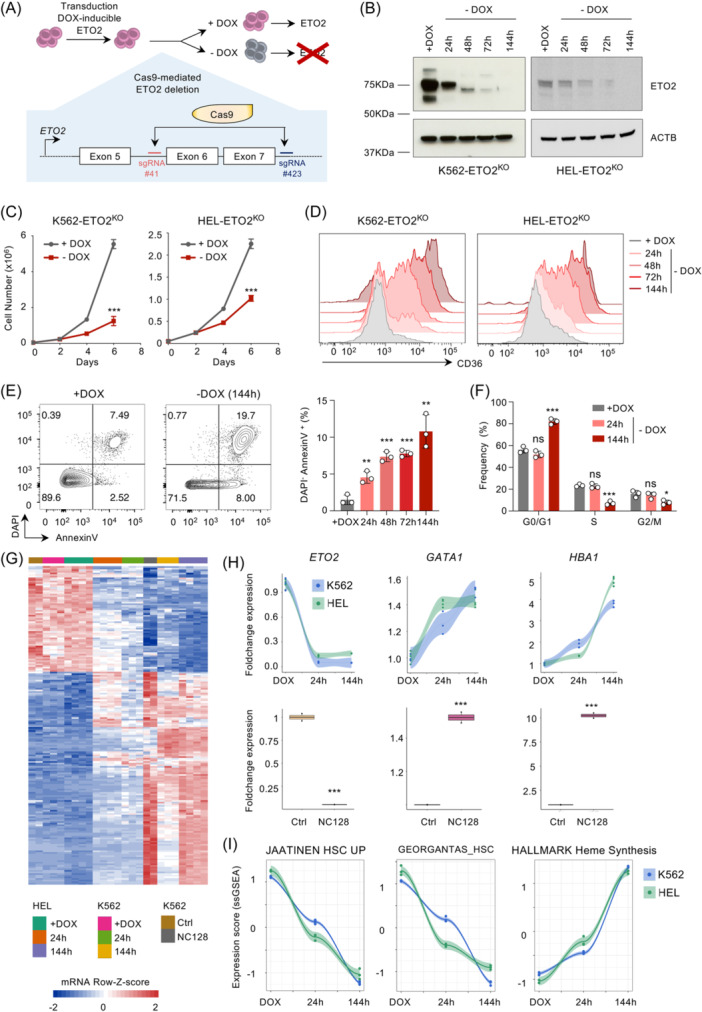
Identification of ETO2‐specific target genes. (A) Experimental design of CRISPR/Cas9‐mediated ETO2 knockout using the erythroid cell line K562 and HEL expressing ETO2 in an inducible manner, generating 2 genetically engineered cell lines: K562‐ETO2KO and HEL‐ETO2KO. (B) Western blot analysis of exogeneous ETO2 and actin (ACTB) protein levels in HEL‐ETO2KO and K562‐ETO2KO cell lines with doxycycline (+DOX) or at 24, 48, 72, and 144 h after doxycycline depletion from culture media (−DOX). (C) Cell proliferation of K562‐ETO2KO and HEL‐ETO2KO cell lines ±DOX. Viable cells were enumerated using trypan blue reagent; n = 3 technical replicates per condition. (D) Flow cytometry analysis of human CD36 expression in K562‐ETO2KO and HEL‐ETO2KO + DOX or at 24, 48, 72, and 144 h after DOX withdrawal. Plots are gated on viable (SYTOX Blue‐negative) cells. FACS plots are representative of n = 3 technical replicates. (E) Quantification of 4′,6‐diamidino‐2‐phenylindole (DAPI−) AnnexinV+ cells measured by flow cytometry in HEL‐ETO2KO + DOX or at 24, 48, 72, and 144 h after DOX withdrawal. Both FACS plots and histograms are represented. FACS plots are representative of n = 3 technical replicates. (F) Cell cycle analysis performed by DNA quantification using DAPI staining and measured by flow cytometry in HEL‐ETO2KO + DOX or at 24 and 144 h after DOX withdrawal; n = 3 technical replicates per condition. (G) Heatmap representation of differentially expressed genes measured by RNA‐seq, shared between K562‐ETO2KO & HEL‐ETO2KO at 24 or 144 h after DOX withdrawal compared to +DOX and K562 expressing NC128 or empty control (Ctrl). Row‐Z‐score were computed separately for K562‐ETO2KO (n = 3 technical replicates per condition), HEL‐ETO2KO (n = 4 technical replicates per condition), and K562 expressing NC128 (n = 2 technical replicates per condition) and then merged for heatmap representation. (H) Dot/line plot and histogram representation of ETO2, GATA1, and HBA1 foldchange gene expression quantified by RNA‐seq, in K562‐ETO2KO (n = 3 technical replicates per condition) and HEL‐ETO2KO (n = 4 technical replicates per condition) at 24 and 144 h after DOX withdrawal compared to +DOX and K652 expressing NC128 as compared to empty control (Ctrl; n = 2 technical replicates per condition). (I) Dot/line plot representation of GSEA scoring performed using ssGSEA R package on K562‐ETO2KO (n = 3 technical replicates per condition) and HEL‐ETO2KO (n = 4 technical replicates per condition) +DOX or at 24 and 144 h after DOX withdrawal using the gene expression signature JAATINEN_HSC_UP, Georgantas_HSC and Hallmark_Heme_synthesis from MSigDB database (https://www.gsea-msigdb.org/gsea/index.jsp). Data in (B–D) are representative of >4 independent experimental repeats; data in (E–F) are representative of three independent experimental repeats. Mean ± SEM is represented. Statistical significance is indicated as p‐values (Student t test except when otherwise specified). *p < 0.05; **p < 0.01; ***p < 0.001.
To identify ETO2‐controlled transcriptional changes consistent between ETO2KO and NC128 inactivation methods, we performed RNA sequencing (RNAseq) on HEL‐ETO2KO and K562‐ETO2KO at 24 h and 6 days (144 h) post‐DOX removal as compared to DOX‐treated cells as well as K562 expressing NC128 or empty vectors. Analysis of differentially expressed genes shared between those models, both at early and late time points, identified 65 common downregulated genes and 125 common upregulated genes (e.g., GATA1), confirming that ETO2 is globally more associated with repressive function rather than activation (Figures 2G–H and S3D). In line with previous observations, time‐course gene set enrichment analysis (GSEA) showed that ETO2 depletion resulted in both a gradually increased erythroid differentiation gene signature and a decreased stem cell gene signature (Figures 2I and S3E).
ETO2 controls enhancers activity at loci of key hematopoietic master regulators
To further explore the molecular mechanism by which ETO2 maintains human AEL, we analyzed the genome‐wide location of ETO2 as well as epigenetic histone marks H3K27ac and H3K4me3 mostly enriched at active enhancers and promoters, respectively, using chromatin immunoprecipitation followed by sequencing (ChIP‐seq) in cells from the three PDX models. We identified 4880, 8060, and 15,276 ETO2 binding sites, out of which 1351 were consistently observed in all three PDX models (Figure S4A). Most (>70%) of ETO2 peaks were localized in intronic and intergenic regions (Figure S4B). Motif analysis at ETO2 binding regions showed enrichment for the DNA‐binding motifs of several known ETO2 direct partners, including ETS (ERG, ETS1 or PU.1 motifs), RUNX, and GATA factors (Figures 3A and S4C) but also novel motifs including those for MYB or FOXO factors (Figure 3A). Analyses of available ETO2 ChIPseq data in human CD34+ cells and several AML cell lines, including of erythroid phenotype (e.g., K562), revealed a similar pattern (Figure 4B,C). 22 Notably, among the 1351 common ETO2 binding sites identified in AEL PDX, 1061 (78%) were shared with CD34+ cells and AML cell lines, suggesting that ETO2 chromatin binding is largely shared between AEL and several immature and myeloid progenitors (Figure S4D).
Figure 3.
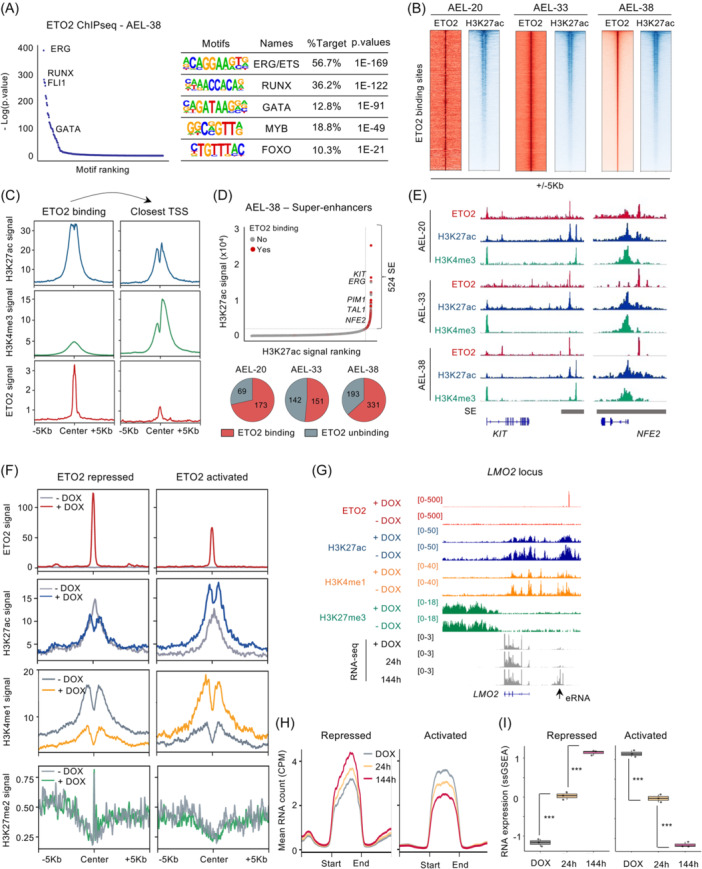
Genome‐wide ETO2 chromatin binding in human erythroleukemia. (A) Dot plot showing the –log(p value) and motif ranking under ETO2 peaks in AEL‐38 PDX cells determined using HOMER algorithm. Table of motif analysis under ETO2 peaks is also presented (right panel). Several motifs of known or unknown ETO2 partners including ERG, RUNX, GATA, MYB, and FOXO are represented. Motifs, associated transcription factors, percentages of peaks containing the motif, and p‐values are shown. (B) Heatmap representation of ETO2 and H3K27ac ChIP‐seq signals centered on ETO2 binding sites in AEL‐20, AEL‐33, and AEL‐38. ETO2 and H3K27ac signals are represented at ±5 kb based on ETO2 peak centers. (C) Line plot of H3K27ac, H3K4me3, and ETO2 ChIP‐seq signals under ETO2 peaks or centered on the closest TSS of ETO2 binding sites determined in AEL‐38 PDX cells. (D) Dot plot representing enhancers ranked by H3K27ac occupancy signals in AEL patient‐derived xenograft AEL‐38. Super‐enhancers were defined by H3K27ac occupancy signals upper the threshold computed by ROSE algorithm. The presence/absence of ETO2 binding in enhancers is represented by red (presence) or grey (absence) dots as well as by the pie chart diagram. (E) Picture representing ETO2, H3K27ac, and H3K4me3 ChIP‐seq signal at KIT and NFE2 genes in AEL PDX models AEL‐20, AEL‐33, and AEL‐38. Defined super‐enhancer regions are also represented in grey. (F) Line plot of ETO2, H3K27ac, H3K4me1, and H3K27me3 ChIP‐seq signal at ETO2 binding sites associated to repressed or activated ETO2 targets in HEL‐ETO2KO maintained with doxycycline (+DOX) or 144 h post‐DOX withdrawal (−DOX). (G) Visualization of ChIP‐seq signal of ETO2, H3K27ac, H3K4me1, and H3K27me3 as well as RNA‐seq count in HEL‐ETO2KO + DOX or at 24 and 144 h after DOX withdrawal. Location of enhancer RNA (eRNA) is shown. (H) Line plot of normalized RNA count quantified by RNA‐seq in HEL‐ETO2KO + DOX or at 24 and 144 h after DOX withdrawal, localized at ETO2 binding sites associated to repressed or activated ETO2 targets. Plot is representative of n = 4 independent samples per group. (I) Histogram representation of GSEA scoring computed by ssGSEA R package using RNA count quantified in HEL‐ETO2KO + DOX or at 24 and 144 h after DOX withdrawal, localized at ETO2 binding sites associated to repressed or activated ETO2 targets; n = 4 technical replicates per condition. Statistical significance is indicated as p‐values (Student t test except when otherwise specified). *p < 0.05; **p < 0.01; ***p < 0.001.
In addition, we observed that ETO2 binding sites were enriched with the active chromatin marker H3K27ac (Figures 3B,C and S4E). By comparing relative H3K27ac and H3K4me3 intensities at ETO2 peaks or at the corresponding closest transcription start site (TSS), ETO2 peak intensity correlated with H3K27ac peak intensity and inversely correlated with H3K4me3 peak intensity, indicating that ETO2 mostly occupies putative enhancer regions (Figure 3C). Broad active enhancer clusters, often called super‐enhancer (SE), have been shown to regulate lineage‐specific transcriptional programs and oncogene expression. 23 , 24 We used ROSE algorithm to annotate typical enhancers (TEs) and super‐enhancers (SEs) based on H3K27ac profiling. 23 , 25 This analysis identified 241 to 524 super‐enhancers out of which 118 (18%) were shared between all AEL PDX models (Figure 3D). Most SE regions (52%–71%) were associated with at least one ETO2 binding sites, suggesting that ETO2 may regulate these SE‐associated genes in AEL (Figure 3D). The annotation of SE regions to the closest TSS led to the identification of 328 to 811 predicted SE‐associated genes which included master hematopoietic stem cells and oncogenic factors (e.g., ERG, KIT) and erythroid‐associated genes (e.g., TAL1, NFE2) (Figure 3D,E). Together, these data suggest that ETO2 regulates an oncogenic program through the binding of enhancers that control the expression of transcriptional master regulators in several AML subgroups.
To investigate the dynamic transcriptional regulation of enhancer activity by ETO2, we performed ChIPseq analysis of ETO2, H3K27ac, H3K4me1, and H3K27me3 in HEL‐ETO2KO maintained with or without DOX [HELETO2+ and HELETO2− at 144 h]. ETO2 knockout led to a global decrease of H3K27ac and H3K4me1 intensity at ETO2 binding sites associated with ETO2‐activated genes and a decreased RNA Pol II (POLR2A) binding at PIM1 enhancer (Figures 3F,G and 4F,G). Inversely, ETO2 binding sites associated with ETO2‐repressed targets showed a local increase in H3K27ac intensity at the center of the peaks and a global H3K4me1 increased intensity. Notably, we did not observe H3K27me3 enrichment at ETO2‐activated enhancer upon ETO2 withdrawal (Figure 3F,G). To further document enhancer activity, we quantified noncoding enhancer RNA (eRNA), described to be transcribed from active enhancer, at predicted ETO2‐repressed/activated enhancer regions in HELETO2+ and HELETO2− using RNA‐seq data. Following ETO2 withdrawal, we observed a significant gradual decrease of eRNA at ETO2‐activated enhancers and an increased production at ETO2‐repressed enhancers (Figure 3G–I). Taken together, these data indicate that ETO2 is localized at enhancer regions close to key hematopoietic master regulators and regulates their expression by modulating enhancer activity.
The ETO2‐activated expression program defines aggressive human leukemia
To define a core direct signature of ETO2‐controlled genes, the integration of differentially expressed genes with the presence of an ETO2 binding site predicted 33 activated genes and 47 repressed genes (Figure 4A and Table S2). No obvious differences in the percentages of transcription factor motifs were found between ETO2 peaks associated with activated or repressed genes (data not shown). While the repressive function of ETO2 on the hematopoietic differentiation is well described, its activating activity is less characterized. 10 , 11 , 12 We therefore investigated the relevance of this signature with AML/AEL patient samples through both gene expression and clinical data analyses.
Figure 4.
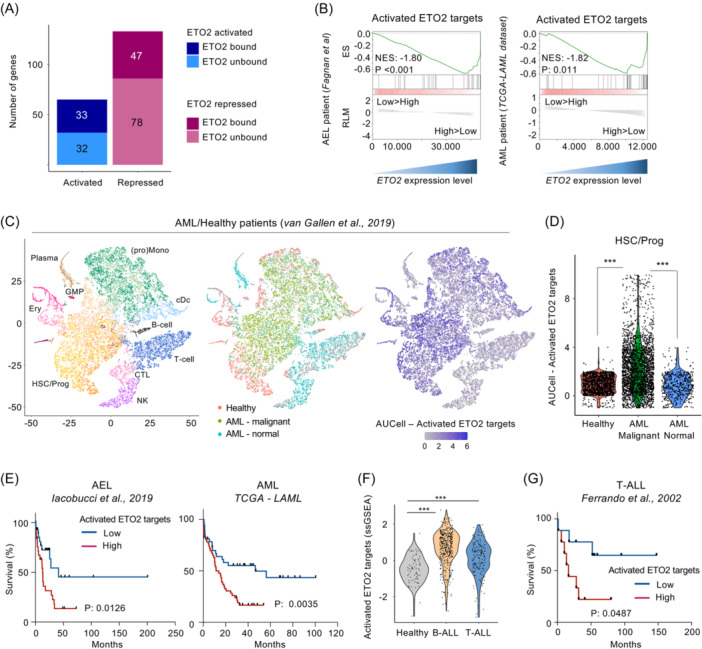
Characterization of ETO2 direct target genes in human leukemia. (A) Histogram representation of genes commonly activated/repressed by ETO2 in K562‐ETO2KO, HEL‐ETO2KO, and K562 expressing NC128, associated with ETO2 binding or not (unbound). (B) Gene set enrichment analysis (GSEA) comparing patient samples with high ETO2 expression (33% higher) versus low ETO2 expression (33% lower) in RNAseq data of AEL patient samples 20 and AML patient samples (NIH ‐ TCGA‐LAML dataset) using the 33 activated ETO2 target signatures. NES score and p‐value (P) are represented. (C) t‐SNE representation of 14 pooled AML patients and healthy donors' single‐cell RNAseq previously annotated. 26 Each dot represents a single cell. Dots were colored according to predicted cell type previously annotated (T cell, CTL, natural killer cell [NK], hematopoietic stem cell [HSC], immature hematopoietic progenitor [Prog], erythroid progenitor [Ery], B cell, plasma cell [Plasma], dendritic cell progenitor [pDC], and (pro)monocyte), predicted cell population (healthy [red], AML malignant [green], AML normal counterpart [blue]) as well as activated ETO2 target score defined using AUCell R package on the 33 activated ETO2 targets. (D) Violin plot representation of activated ETO2 target score (computed using AUCell R package) comparing healthy donors, AML malignant cells, and AML normal counterpart cells in HSC/Prog cell fraction defined from (C). (E) Kaplan–Meier survival curve of patients presenting a high (red) or low (blue) activated ETO2 target score (computed using ssGSEA R package) in two distinct cohorts of patient with AEL; 25 n = 28 patient sample per group) and AML (NIH ‐ TCGA‐LAML database; n = 38 patient sample per group). AML patients presenting a RUNX1‐RUNX1T1 translocation were excluded from the analysis; p‐value (P) is represented. (F) Violin plot representing activated ETO2 target score in healthy bone marrow (n = 73 patient samples), B‐ALL (n = 442 patient samples), and T‐ALL (n = 173 patient samples) patient samples. Data originated from the MILE leukemia study 27 . (G) Kaplan–Meier survival curve of T‐ALL patients 28 presenting a high (red) or low (blue) activated ETO2 target score; n = 9 patient sample per group. Statistical significance is indicated as p‐values (Student t test except when otherwise specified). *p < 0.05; **p < 0.01; ***p < 0.001.
First, we assessed whether the ETO2 expression level correlates with expression of the ETO2 target genes through GSEA analyses using available AEL and AML patient sample transcriptomes 21 , 26 and compared patients with high ETO2 (top 33% of patients with the highest ETO2 expression) and low ETO2 (bottom 33% of patients with the lowest ETO2 level) expression (Figures 4B and S5A–C). Patient samples with high ETO2 expressed significantly more activated ETO2 target signatures than patient samples with low ETO2 levels. High ETO2 samples were also enriched in HSC‐associated genes compared to those with low ETO2 expression (Figure S5B). Of note, AEL patients with high ETO2 expression were not significantly associated with blast/erythroid cell percentages or genetic subgroups compared to those expressing low ETO2 (Figure S5D,E).
To investigate a possible cellular heterogeneity in ETO2 activity within AML/healthy samples, we used published and previously annotated single‐cell RNAseq (scRNAseq) data 29 and the AUCell R package to compute gene expression scoring based on the 33 activated ETO2 targets.
Cells expressing the highest activated ETO2 target scores were mainly localized within the HSC/progenitors and (pro)monocyte cell fractions containing the malignant cells (Figure 4C). Importantly, within HSC/Prog cell population, predicted malignant cells presented a higher activated ETO2 target score compared to AML normal counterpart cells and healthy donors (Figures 4D and S5F). These data support the idea that the enrichment in the ETO2‐activated program in leukemic cells is independent of the cellular composition and relative frequency of immature cells.
We then investigated the correlation between the activated ETO2 target signature and prognosis. In both AEL and AML cohorts, patients presenting with a high activated ETO2 target score showed a significantly poorer clinical outcome compared to those with lower ETO2 activity (Figure 4E). In line with this observation, AML and AEL patient samples with a higher activated ETO2 target score were also significantly enriched in the LSC‐43 gene signature, previously defined to be associated with poor clinical outcomes in AML and enriched in leukemic stem cells 30 (Figure S5G).
In addition, since ETO2 was also highly expressed in some lymphoid lineages and acute lymphoblastic leukemia (ALL) (Figure S6A–C), we extended our investigation to other publicly available data sets. The activated ETO2 target signature was higher in B‐cell and T‐cell ALL as compared to healthy patient samples (Figures 4F and S6D). T‐ALL patients with the highest ETO2 score presented with a poorer clinical outcome than those with a low score (Figure 4G). Taken together, these analyses show that the expression level of the activated ETO2 target signature correlates with disease aggressiveness in multiple acute leukemia subtypes, supporting the idea that targeting this program may be widely relevant in acute leukemia.
The ETO2 regulome includes MYB and targetable vulnerabilities in human leukemia
We then sought to identify which ETO2‐driven genes are essential for the maintenance of human leukemia and could represent pharmacological targets. To this aim, we intersected the activated ETO2 target signature with genes previously identified as molecular vulnerabilities in multiple human leukemic cell lines from available genome‐wide CRISPR/Cas9 screen data 31 (Figures 5A and S7A). This analysis revealed a subset of four genes including PIM1, DYRK1A, and RICTOR referred to as druggable in DGidb 32 and the transcription factor MYB (Figure 5A).
Figure 5.
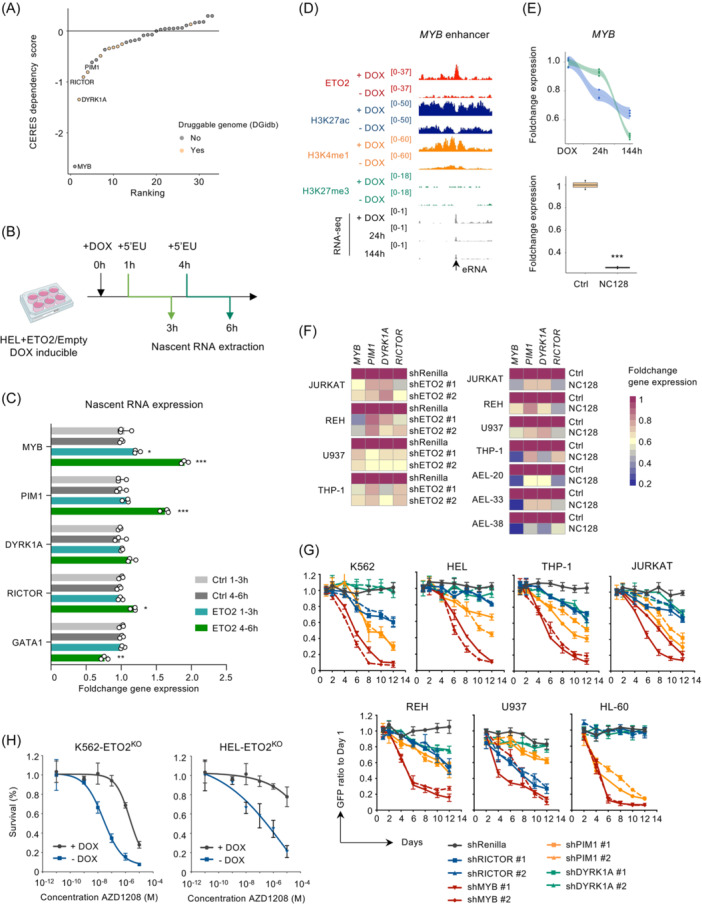
Molecular targeting of essential ETO2‐activated genes in human leukemia. (A) Median of CERES dependency score for each of the 33 activated ETO2 target genes in 17 acute myeloid leukemia (AML) cell lines. 31 (B) Schematic experimental design of nascent RNA extraction between 1–3h and 4–6 h postdoxycycline (DOX) induction of ectopic ETO2 expression or empty vector (Ctrl) in the HEL cell line. (C) Histogram representation of MYB, PIM1, DYRK1A, RICTOR, and GATA1 nascent gene expression measured by quantitative reverse‐transcription polymerase chain reaction (RT‐qPCR) between 1–3 h and 4–6 h post‐DOX induction of ectopic ETO2 expression or empty vector (Ctrl) in the HEL cell line, n = 3 technical replicates per condition. (D) Dot/line plot and histogram representation of MYB foldchange gene expression quantified by RNA‐seq, in K562‐ETO2KO (n = 3 technical replicates per condition) and HEL‐ETO2KO (n = 4 technical replicates per condition) at 24 and 144 h after DOX withdrawal compared to +DOX and K652 expressing NC128 as compared to empty control (Ctrl; n = 2 technical replicates per condition). (E) Visualization of ChIP‐seq signal of ETO2, H3K27ac, H3K4me1, and H3K27me3 as well as RNA‐seq count in HEL‐ETO2KO + DOX or at 24 and 144 h after DOX withdrawal. Location of enhancer RNA (eRNA) is shown. (F) Heatmap representation of MYB, PIM1, DYRK1A, and RICTOR gene expression quantified by RT‐qPCR in several AEL PDX models (AEL‐20, AEL‐33, and AEL‐38), AML (U937 and THP‐1) cell line, and ALL (JURKAT and REH) cell line expressing either short hairpin RNA (shRNA) targeting ETO2 (#1 and #2) or Renilla or NC128 or empty vector (Ctrl); n = 3 technical replicates per condition. (G) Lineplot representation of GFP ratio (Day X/Day 1) postdoxycycline induction of shRNA targeting RICTOR, MYB, PIM1, DYRK1A, or Renilla genes in AEL (HEL and K562), AML (THP‐1 and HL‐60), and ALL (JURKAT and REH). GFP intensity analyzed by flow cytometry; 2 shRNA were used per genes (#1 and #2); n = 3 technical replicates per condition. (H) Dose‐response curve for proliferation of K562‐ETO2KO and HEL‐ETO2KO maintained with (grey) or without (blue) doxycycline in media culture, treated for 6 days with the indicated AZD1208 concentrations. Mean ± SD; n = 3 technical replicates. Data in (F) are representative of three independent experimental repeats; data in (C–E) are representative of two independent experimental repeats. Mean ± SEM is represented. Statistical significance is indicated as p‐values (Student t test except when otherwise specified). *p < 0.05; **p < 0.01; ***p < 0.001.
To determine whether ETO2‐activated gene expression is direct or may indirectly result from deregulation of ETO2‐repressed genes, we induced ETO2 overexpression in the parental HEL or U937 cell lines (presenting a high or low basal ETO2 expression, respectively) using a DOX inducible vector. To avoid confounding results based on basal gene expression and variable half‐life of transcripts, we quantified nascent RNA of candidate genes produced between 1–3 and 4–6 h post‐ETO2 induction (Figures 5B,C and S7B). Upon ETO2 overexpression, we observed an increase in MYB, PIM1, and RICTOR nascent transcripts with MYB and PIM1 showing the highest amplitude at 4–6 h (Figure 5B,C). Notably, MYB upregulation was already significant at 1–3 h while GATA1 downregulation was significant at 4–6 h. In line with these data, ETO2 is located on the MYB enhancer and both MYB expression and enhancer activity decreased upon ETO2 depletion (Figure 5D,E), supporting that ETO2 directly regulates MYB expression.
To extend to other leukemic cell types, we interfered with ETO2 activity by either ectopically expressing the NC128 peptide or by ETO2 knockdown in human AML (U937 and THP‐1) and ALL (JURKAT and REH) cell lines as well as our AEL xenografts models. Both approaches led to reduced MYB, PIM1, DYRK1A, and RICTOR expression (Figures 5F and S7C–F). These results support that ETO2 controls the expression of a core subset of genes in several human leukemia subtypes and that positive regulation of MYB expression by ETO2 is uncoupled from GATA1 downregulation.
To validate the role of this core gene subset for the maintenance of leukemic cells, we next performed individual knockdown using inducible shRNA by lentiviral delivery in several erythroid, myeloid, and lymphoid human leukemia lines (Figure S7G). Competitive proliferation between transduced (GFP+) and untransduced (GFP−) cells was monitored by flow cytometry analyses over time to determine the impact of shRNA expression on cell proliferation (Figure 5G). Knockdown of MYB inhibited proliferation of all cell lines while knockdown of PIM1, DYRK1A, and RICTOR resulted in proliferation inhibition in multiple cell lines, confirming that this core subset of genes driven by ETO2 functionally contributes to the maintenance of multiple human leukemic cells.
As a proof of principle that impairing the activity of both ETO2 and its targets could enhance AEL growth inhibition, we observed that the PIM inhibitor AZD1208 inhibited proliferation of HELETO2− and K562ETO2− more efficiently than that of HELETO2+ and K562ETO2+, respectively (Figure 5H). As treatment with the PIM inhibitor AZD1208 alone does not abrogate leukemic development, 33 these data support that combinatorial treatment could represent a therapeutic benefit in the context of ETO2‐active leukemia.
MYB is an essential effector of ETO2
Our results position ETO2 as a direct transcriptional regulator upstream of MYB that was described as important driver of multiple leukemia subgroups. 34 We therefore investigated whether ETO2‐mediated leukemic cell maintenance is MYB dependent. To this aim, we ectopically expressed MYB through lentiviral delivery in HEL‐ETO2KO and K562‐ETO2KO (Figures 6A,B and S8A,B). MYB expression rescued most of the proliferation and erythroid differentiation consequences of ETO2 genetic ablation. At the transcriptional level, MYB expression significantly rescued GATA1 and PIM1 expression while other ETO2 targets including DYRK1A and RICTOR remained unaffected (Figures 6C and S8C). These data indicated that ETO2‐driven leukemic cell maintenance strongly relies on MYB activity.
Figure 6.
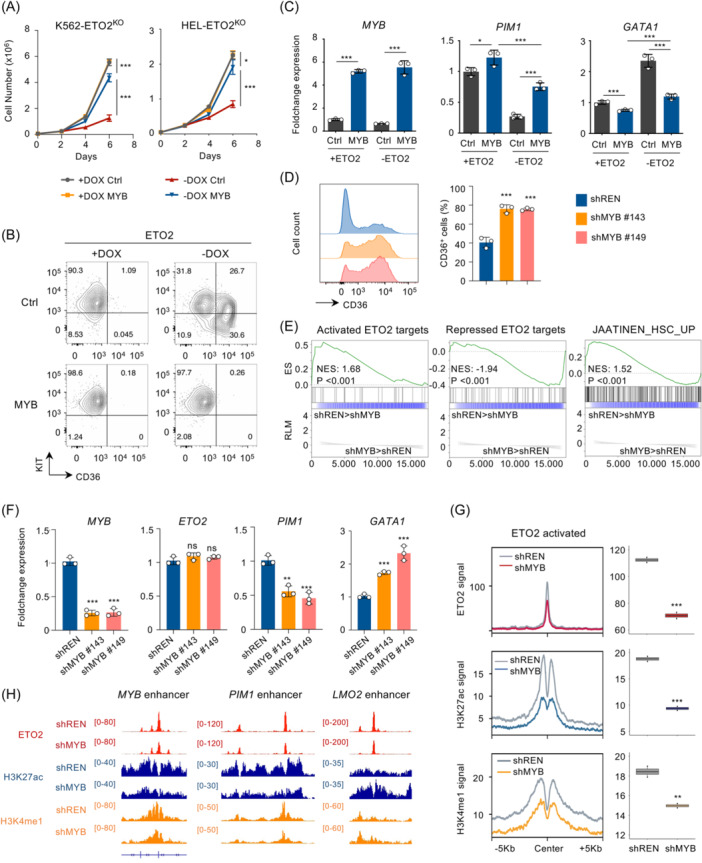
MYB is essential for the ETO2‐driven leukemic cell maintenance. (A) Cell proliferation of K562‐ETO2KO and HEL‐ETO2KO cell lines ±DOX expressing MYB or empty (Ctrl) backbone. GFP+ cells were sorted 24 h after transduction, and 50.000 cells per replicate were plated in culture medium supplemented ±DOX; n = 3 technical replicates. (B) Representation of KIT and CD36 expression measured by flow cytometry analysis in HEL‐ETO2KO cell lines ±DOX expressing MYB or empty (Ctrl) backbone, 48 h post‐DOX removal. Plots were gated on viable (SYTOX Blue‐negative) GFP+ (expressing MYB/Ctrl) cells. FACS plot is representative of n = 3 technical replicates for each group. (C) Histogram representation of MYB, PIM1, and GATA1 gene expression quantified by quantitative reverse‐transcription polymerase chain reaction (RT‐qPCR) in HEL‐ETO2KO cell lines ±DOX expressing MYB or empty (Ctrl) backbone, 48 h post‐DOX removal; n = 3 technical replicates per condition. (D) Histogram representation of CD36 expression quantified by flow cytometry in HEL expressing shRenilla (shREN) shMYB #143 and #149. GFP+ cells were sorted 24 h after transduction, and 100.000 cells per replicate were plated in culture medium. Plots were gated on viable (SYTOX Blue‐negative) GFP+ (expressing MYB/Ctrl) cells. FACS plot is representative of n = 3 technical replicates for each group. (E) GSEA analysis of the 33 activated or 47 repressed ETO2 target as well as JAATINEN_HSC_UP signatures in K562 expressing shRenilla (shREN) or shMYB; 35 n = 4 technical replicates per group. (F) Histogram representation of MYB, ETO2, PIM1, and GATA1 gene expression in HEL expressing shRenilla (shREN) shMYB #143 or #149. GFP+ cells were sorted 48 h after transduction follow by RNA extraction; n = 3 technical replicates per condition. (G) Line plot and histogram representations of ETO2, H3K27ac, and H3K4me1 mean ChIP signal at ETO2 binding sites associated to activated ETO2 targets in HEL expressing shRenilla (shREN) or shMYB. Plot is representative of n = 2 technical replicates for each group. (H) Visualization of ChIP‐seq signal of ETO2, H3K27ac, and H3K4me1 in HEL expressing shRenilla (shREN) or shMYB, at MYB enhancer, PIM1 enhancer, and LMO2 enhancer. Data in (A, B, D) are representative of three independent experimental repeats; data in (C, F) are representative of two independent experimental repeats. Mean ± SEM is represented. Statistical significance is indicated as p‐values (Student t test except when otherwise specified). *p < 0.05; **p < 0.01; ***p < 0.001.
We then investigated whether MYB expression inhibition could phenocopy ETO2 genetic inactivation. ShRNA‐mediated MYB knockdown in HEL cells impaired cell proliferation and increased cell surface CD36 expression (Figures 5E and 6D). A publicly available transcriptome data set also showed that MYB knockdown in K562 cells is associated with decrease expression of the activated ETO2‐activated targets as well as increased expression of ETO2‐repressed targets, without altering ETO2 expression itself (Figure 6E,F). Next, we quantified ETO2 binding as well as H3K27ac and H3K4me1 through ChIP‐seq in HEL knocked down for MYB as compared to shRenilla (Figures 6G,H and S8D). We observed that ETO2 binding at both ETO2‐activated/repressed enhancers decreased upon MYB knockdown while ETO2 mRNA expression did not significantly change. H3K27ac and H3K4me1 signals were also decreased at ETO2‐activated enhancer regions and increased at ETO2‐repressed regions upon MYB knockdown, mimicking the consequences of ETO2 inactivation at these enhancers.
Taken together, these data indicated that MYB is an essential effector of the ETO2‐driven leukemic cell maintenance and acts in concert with ETO2 to regulate enhancer activity and drive a stemness transcriptional program.
CBP/EP300 is essential for ETO2 transcriptional activation activity
Although nondirectly druggable, MYB has been reported to interact with the histone acetyl‐transferase (HAT) CBP/EP300, essential for its transcriptional activity. 36 In addition, based on the known role of HAT factors such as CBP/EP300 at active enhancers, including its extreme abundancy at these regions, 37 and our current data showing co‐occupancy of ETO2 binding at enhancer regions, we investigated whether ETO2, MYB, and EP300 are part of a same transcriptional complex. Using ChIP‐seq for ETO2, MYB, and EP300 in HEL cell line, we observed that MYB and EP300 were present in 5311/6566 (80.9%) and 6123/6566 (93.2%) ETO2 binding sites, respectively (Figure 7A). Using available ChIPseq data of ETO2 and EP300 in other AML/AEL cell lines (K562 and Kasumi), we confirmed co‐occupancy of EP300 at ETO2 binding sites (Figure S9A). To obtain further evidence of physical proximity, we ectopically expressed ETO2 fused to a promiscuous biotin ligase (BioID2) 38 in HEL cells. Following streptavidin pull‐down, we detected biotinylated MYB and EP300 by western blot analyses (Figure 7B), supporting that ETO2 is present in transcriptional complexes including MYB or EP300. Reciprocal coimmunoprecipitation of EP300 or MYB in HEL cell confirmed binding with ETO2 (Figure S9B).
Figure 7.
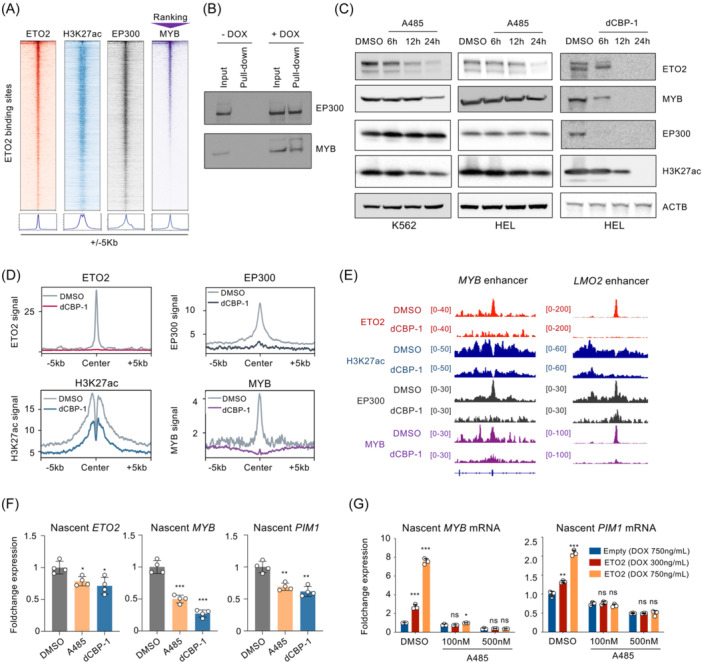
CBP/EP300 is essential for ETO2 transcriptional activation. (A) Heatmap and line plot representation of ETO2, H3K27ac, EP300, and MYB enrichment at ETO2 binding sites in HEL. Chromatin regions are ranked based on decreasing MYB signal intensity. (B) Western blot analysis of EP300 and MYB protein levels in total nuclear extract (Input) or following streptavidin pull‐down in HEL expressing ETO2‐BioID2 (+DOX) or not (−DOX). (C) Western blot analysis of ETO2, MYB, EP300, H3K27ac, and ACTIN (ACTB) protein levels in HEL or K562 cells treated with the catalytic CBP/EP300 inhibitor A485 (0.5 μM) or CBP‐PROTAC dCBP‐1 (0.5 μM) and analyzed at 6, 12, or 24 h posttreatment (dimethyl sulfoxide [DMSO] at 24 h). ETO2 and ACTB were probed on the same membrane, and MYB, EP300, and H3K27ac were probed separately. (D) Line plot representation of ETO2, H3K27ac, EP300, and MYB mean ChIP signals at ETO2 binding sites associated to activated ETO2 targets in HEL treated 3 h with DMSO or dCBP‐1 (0.5 μM). (E) Visualization of ChIP‐seq signal of ETO2, H3K27ac, EP300, and MYB in HEL treated 3 h with DMSO or dCBP‐1 (0.5 μM), at MYB enhancer and LMO2 enhancer. (F) Histogram representation of nascent ETO2, MYB, and PIM1 messenger RNA synthesized between 3 and 6 h following DMSO, A485, or dCBP‐1 (0.5 μM) treatment in the HEL cell line. Quantification measured by quantitative reverse‐transcription polymerase chain reaction (RT‐qPCR); n = 4 technical replicates per condition. (G) Histogram representing the quantification of MYB and PIM1 nascent RNA measured by RT‐qPCR. HEL cells were treated for 3 h with DMSO or A485 (0.1 or 0.5 μM) prior DOX induction of ETO2 or empty vector using different dose of doxycycline (300 ng/mL [DOX 300] or 750 ng/mL [DOX 750]). RNA synthesized between 3 and 6 h after DOX induction was collected by ClickIT Nascent RNA capture kit; n = 3 technical replicates per condition. Data in (B, C, F, G) are representative of two independent experimental repeats. Mean ± SEM is represented. Statistical significance is indicated as p‐values (Student t test except when otherwise specified). *p < 0.05; **p < 0.01; ***p < 0.001.
Based on the observation that EP300 is part of ETO2 complexes, we next investigated the molecular consequences of HAT inhibition on ETO2 activity using a CBP/EP300 catalytic inhibitor (A485) or a PROTAC‐mediated selective degradation of EP300/CBP (dCBP‐1). 39 , 40 Both A485 and dCBP1 strongly reduced ETO2 and MYB protein expression (Figure 7C). Notably, while dCBP‐1 showed the strongest effect and was associated with the expected loss of EP300 expression, short‐term treatment with A485 (6–12 h) showed a significantly decreased ETO2 expression without affecting EP300 or MYB. A decrease in ETO2 protein was also observed using A485 on multiple acute leukemia cell lines (Figure S9C) or upon EP300‐specific shRNA‐mediated knockdown in HEL cells (Figure S9D). These data supported that CBP/EP300 contributes to ETO2 and MYB protein levels.
To further investigate the consequences of CBP/EP300 inhibition on ETO2/MYB chromatin binding, we treated HEL cells with dCBP‐1 or A485 for a short time (3 h) and quantified the presence of ETO2, MYB, EP300, and H3K27ac through ChIP‐seq and ChIP‐qPCR, respectively. dCBP‐1 treatment led to a global decrease in H3K27ac signals and ETO2, MYB, and EP300 chromatin binding at ETO2‐activated (Figure 7D,E) and ETO2‐repressed (Figure S9E) binding sites. A485 treatment induces similar changes on MYB and PIM1 enhancer loci (Figure S9F). Altogether, these analyses suggested that the EP300/CBP acetyltransferase activity, the structural presence of EP300/CBP, or a combination of both stabilize ETO2/MYB complexes at transcriptionally active loci. Notably, both A485 and dCBP‐1 treatments were associated with a decreased nascent RNA production for ETO2, MYB, and PIM1 between 3 and 6 h of treatment (Figure 7F). To further investigate the consequences of CBP/EP300 HAT inhibition on ETO2‐dependent transcriptional activity, we purified nascent RNA synthesized between 3 and 6 h of A485 treatment in HEL overexpressing ETO2 in a DOX dose‐dependent manner. As expected, we observed an ETO2 dose‐dependent increase of ETO2‐activated targets MYB and PIM1 (Figure 7G). Treatment with A485 fully abrogated the ETO2‐induced MYB or PIM1 expression supporting that CBP/EP300 is required for ETO2 transcriptional activity at some positively controlled target genes. GSEA analyses using public gene expression data sets from K562 cells treated with two EP300/CBP inhibitors also supported that the ETO2‐activated signature is globally depleted upon EP300/CBP inhibition (Figure S9G). Taken together, while EP300/CBP inhibition may not solely inhibit ETO2 targets, these data indicate that positively regulated ETO2 transcription is dependent on EP300/CBP activity, including for the regulation of MYB expression that also colocalizes with ETO2 complexes supporting the existence of a feedforward transcriptional loop.
DISCUSSION
Aberrant transcriptional regulation is a hallmark of human acute leukemia that remains inherently difficult to therapeutically target in most cases. The scaffolding transcriptional cofactor ETO2 belongs to a family of transcriptional cofactors involved in different AML‐associated fusion oncogenes (e.g., AML1‐ETO, ETO2‐GLIS2, or NFIA‐ETO/ETO2) controls an important transcriptional program offering a potential therapeutic avenue in aggressive leukemia. 14 , 15 , 16 , 17 Here, using ETO2 inactivation approaches in several human AEL models including patient‐derived xenograft models, we demonstrate that the activity of ETO2 is essential for human AEL disease maintenance in vivo. More importantly, our molecular analyses revealed that, in addition to its well‐known transcriptional repressor activity, ETO2 also positively regulates a leukemogenic transcriptional program that is active in both myeloid and lymphoid acute leukemia. These data significantly extend the relevance of ETO/ETO2 dependency beyond AML1‐ETO and ETO2‐GLIS2 AML. 19 , 20 In addition, we characterized that ETO2 functional dependencies can be pharmacologically targeted to impair the ETO2‐mediated transcriptional regulation (e.g., with a CBP/EP300 inhibitor) and an essential ETO2 transcriptional target (e.g., with a PIM1 inhibitor).
To date, ETO cofactors have been extensively described as transcriptional corepressors in several contexts through the recruitment of NuRD nucleosome remodeling and deacetylation complexes. 12 , 13 , 41 , 42 By mapping of ETO2 binding to the chromatin in patient‐derived AEL cells combined with controlled genetic inactivation of ETO2 in human erythroid cells, we confirmed that ETO2 negatively regulates numerous genes associated with maturation and terminal hematopoietic differentiation. Unexpectedly, we found that ETO2 also positively controls the expression of an oncogenic program, including signaling molecules (e.g., PIM1) and transcriptional regulators (e.g., MYB). This demonstrates that ETO2‐mediated repression and activation can be uncoupled and supports that they likely act in concert to maintain acute leukemia cells. This ETO2‐activated program was enriched in stem cell features and was significantly more highly expressed in several acute leukemia subgroups as compared to normal cells, including AML but also acute lymphoid leukemia (ALL). A functional involvement of ETO2 in lymphoid malignancies is supported by direct genetic alterations of ETO2 in B‐cell lymphoma with recurrent translocations that juxtapose the IGH locus with ETO2 and leaving the ETO2 coding region intact. 43 ETO2 expression was also very recently correlated with RUNX1 expression in the pediatric t(12;21) ETV6−RUNX1 BCP‐ALL. 44 These data support a wider role for ETO2 in the maintenance of myeloid and lymphoid malignancies.
Our data also highlight a molecular interplay between ETO2, other major human oncogenic transcription factors, and chromatin regulators to impose a widely shared oncogenic program. Indeed, we observed in AEL that ETO2 is located at long‐range enhancer elements, including super‐enhancers, which are enriched in the H3K27ac histone marker as well as EP300 occupancy and known to regulate key oncogene expression like MYB or MYC. 24 , 45 ETO2 does not directly bind DNA but interacts with multiple key hematopoietic transcription factors like GATA1/2, ERG, RUNX1, or TAL1 and chromatin regulators, also previously identified at long‐range enhancer regions to regulate gene expression. 11 , 12 , 42 , 46 , 47 These data support frequent hijacking of ETO2 activity by various human acute leukemia oncogenes.
We also found that ETO2 interacted with the histone acetyl transferase (HAT) EP300, and expression of key target genes MYB and PIM1 was dependent on the HAT activity or the presence of EP300/CBP. Importantly, the ETO2 protein level itself is also dependent on the HAT activity or the presence of EP300/CBP, suggesting that EP300/CBP contributes to ETO2 activity through enzymatic activity, structural presence, or both. As ETO2 is involved in transcriptional complexes with several oncogenes (e.g., MYB, TAL1, TCF3‐HLF, or NUP98‐KDM5A), our results support that the previously described dependence of these oncogenes on CBP/EP300 activity 36 , 48 , 49 , 50 relies at least in part on ETO2 and an ETO2/MYB feedforward transcriptional activation loop. Of interest, ETO2 interacts with and is essential for Prdm14‐induced T‐ALL leukemia development in mice, highlighting that an interplay between chromatin regulators and ETO2 may represent a widely used molecular mechanism to impose an oncogenic program. 51 These data indicate that the ETO2‐mediated oncogenic program represents a common functional node that is frequently hijacked in human leukemia by several combinations of transcription factors and chromatin regulators.
Taken together, these data indicate that ETO2 contributes to leukemia maintenance through both the transcriptional repression of genes important for hematopoietic maturation but also by transcriptional activation of a leukemic stem cell program. At the molecular level, these data support the existence of two ETO2‐controlled mechanisms that can be uncoupled, the former being mediated by the recruitment of corepressor complexes and the latter being mediated, at least in part, by CBP/EP300 HAT cofactors. While the precise mechanism behind loci‐specific consequences of ETO2 on transcription will need additional studies, it is tempting to speculate that target gene transcription will result from the loci organization and relative composition or activity of the transcriptional complexes. Previous studies demonstrated that ETO2 is part of complexes containing corepressors including NCOR, mSin3a, or HDAC1/2/3/6/8 as well as other important bridging/scaffolding factors, like LDB1 and LMO2, 12 , 42 which impact GATA1‐mediated chromatin looping at β‐globin promoter‐enhancer. 52 More recently, ETO2 was found to be a key factor of globin gene switching through modulating chromatin looping and epigenetic environment at β‐globin promoter‐enhancer. 53 In addition, the expression of several positively regulated ETO2 target genes identified here, including MYB and PIM1, were also independently shown to be regulated by higher‐order chromatin looping with long‐range enhancers. 45 , 54 , 55 Progression toward erythroid lineage differentiation was shown to be associated with induction of chromatin looping that relies on protein–protein interactions including LDB1. 52 , 56 Therefore, it is possible that the tetramerization properties of ETO2 similarly controls chromatin organization to enforce expression of this activated gene program that antagonizes differentiation but maintains immature progenitor states. As it relates to other leukemia subtypes, the recent report that the enhancer activity leading to deregulation of EVI1 and GATA2 in aggressive AML with 3q rearrangements relies on MYB activity 57 , 58 also suggests dependency on ETO2 scaffolding activity.
Finally, the characterization of the ETO2‐controlled transcriptional consequences revealed potential therapeutic implications as several targets or cofactors represent molecular vulnerabilities for several human leukemia. Indeed, integration of ETO2 targets with in the Drug gene interaction database (DGidb) identified 3 components of the ETO2‐activated targets (PIM1, RICTOR, and DYRK1A) that are essential for leukemic cell maintenance and previously investigated as therapeutic targets in human leukemia. 59 , 60 , 61 Of particular interest, we observed that cell lines inactivated for ETO2 are more sensitive to the PIM inhibitor AZD1208 supporting the translational potential of a synthetic lethal approach if ETO2 protein stability is achieved in leukemic cells.
Taken together, using molecular dissection of mechanisms orchestrated by ETO2, we unraveled the central role of ETO2 in positively controlling an oncogenic program that provides new insight into the possible therapeutic interventions, including through combined inhibition of both ETO2 target genes and transcriptional complexes stability involving ETO2. This study provides proof of principle for targeting of ETO2‐driven transcription scaffolding activities that are essential for maintenance of human acute leukemia.
MATERIALS AND METHODS
Key resource table
All reagents used in the present study are listed in Table S3.
AEL patient‐derived xenografts
Previously reported AEL patient samples 21 were amplified into NOD.Cg‐Prkdc scidIl2rgtm1Wjl/SzJ (NSG) mice (The Jackson Laboratory). Notable mutations were as follows: AEL‐20 (TP53R234H + ERGHigh), AEL‐33 (TP53C141W), AEL‐38 (TET2Q1548X + DNMT3AR882H), and most of the PDX‐amplified cells were CD34+KIT+CD36−. For bioluminescent analysis of AEL PDX cell (AEL‐20), patient cells were transduced with the pFUWLuc‐mCherry‐puro lentiviral (a kind gift from A. L. Kung; Dana Farber Cancer Institute) and sorted on mCherry expression. 5 × 10⁵ sorted cells were injected in the femur of recipients and followed as previously described. 19 Mice were maintained at the Gustave Roussy preclinical facility, and all experiments were approved by the French National Animal Care and Use Committee (CEEA#26: projects 2017‐082‐12726 and 2017‐084‐12799).
Cell culture
Human embryonic kidney (HEK‐293T) cells were grown in Dulbecco's modified Eagle's medium supplemented with 10% fetal bovine serum (FBS), penicillin (100 U/mL)–streptomycin (100 μg/mL), and 2 mM L‐glutamine (Gibco). The following human cell lines HEL 92.1.7 (named here HEL), K562, U937, THP‐1, JURKAT, REH, and HAL‐01 were grown in RPMI−1640 (Gibco) supplemented with 10% FBS, penicillin (100 U/mL)–streptomycin (100 μg/mL), and 2 mM l‐glutamine (Gibco). The AML HL‐60 cell line was maintained in IMDM (Gibco) supplemented with 10% FBS, penicillin (100 U/mL)‐streptomycin (100 μg/mL), and 2 mM l‐glutamine (Gibco). For in vitro assay, AEL patient‐derived xenografts were maintained in StemSpan‐SFEM (StemCell) supplemented with hEPO (1 U/mL), hSCF (50 ng/mL), hIL3 (10 ng/mL), hIL6 (10 ng/mL), hGM‐CSF (10 ng/mL), and penicillin (100 U/mL)–streptomycin (100 μg/mL).
Lentiviral particle production
For lentiviral particle production, HEK293T cell line was plate 1‐day prior cotransfection. Cells were transfected with pSIEW‐NC128‐IRES‐GFP/mCherry or pLT3‐P2A‐GFP/mCherry using jetPRIME reagent (Polyplus transfection), according to the manufacturer's recommendations. Culture media was changed 24 h post‐transfection, and supernatant containing lentiviral particles was harvested 48 h post‐transfection. Supernatant was subjected to ultracentrifugation (22.000 rpm, 1h10 at 4°C), and pellet was suspended in PBS. For human cell transduction, cells were plated in 12‐ or 6‐well plates and incubated 24 h with lentiviral suspension. Based on fluorochrome expression, the transduction rates were from 12% to 20% for AEL PDX cells and from 30% to >95% for cell lines, and fluorochrome+ cells were sorted prior to subsequent analyses. All flow cytometry panels are gated of fluorochrome+ cells.
Flow cytometry
Used reagents and antibodies are listed in Table S3. Cells were stained in 1× PBS supplemented with 2% FBS at 4°C for 30 min and washed prior analysis. For AEL patient‐derived xenograft (PDX) analysis, bone marrow (BM) or spleen cells underwent red blood cells lysis prior staining. Flow cytometry analysis was performed using ARIAII, CANTO‐II, or CANTO‐X instruments (BD), and data were analyzed using the FlowJo software (version 9.3.2).
Western blot
Nuclear cell lysate was prepared in 20 mM HEPES at pH8, with 10 mM KCl, 0.2% NP40, 10% glycerol, and 1 mM ethylenediaminetetraacetic acid (EDTA) with protease inhibitors (Roche). Nuclei were next resuspended in 20 mM HEPES at pH8, with 10 mM KCl, 20% glycerol, 350 mM NaCl, and 1 mM EDTA with protease inhibitors (Roche) and incubated 20 min on ice. Western blotting was performed using the standard procedure and incubated with antibodies (reported in Table S3) overnight at 4°C.
Streptavidin pull‐down and coimmunoprecipitation
ETO2‐BioID2 expression was induced with doxycycline (+DOX) 48 h prior nuclear protein extraction. Streptavidin pull‐down was performed using Dynabeads™ MyOne™ Streptavidin C1 (Thermofisher) on a protein amount equal to 20 M cells per condition (corresponding to 2.125 mg of nuclear protein extract). Next to beads washing using RIPA‐1X buffer, elution was performed with Laemmli 4× buffer (Biorad) supplemented with 50 mM dithiothreitol and incubating 15 min at 96°C on agitation. Samples and input were loaded on NuPAGE™ 3%–8% or 4%–12% (Invitrogen), and western blots were followed by the standard procedure and incubated with antibodies (reported in Table S3) overnight at 4°C. Coimmunoprecipitation was performed on 20 × 106 HEL cells fixed using the DSP crosslinker agent (Thermo Fisher Scientific). Protein was extracted from nuclei, and preclear was performed using magnetic protein‐G beads (NEB). Antibodies against EP300 and MYB (reported in Table S3) were incubated overnight with protein extract and immunoprecipitated using magnetic protein‐G beads (NEB) for 1.5 h at 4°C. Elution and western blot analysis were performed as described above.
ETO2 CRISPR/Cas9 knockout
Human ETO2 cDNA (synthesized by Genscript) was cloned into the doxycycline inducible lentiviral vector pLT3‐P2A‐mCherry. Single guide RNA (sgRNA) and Cas9 were encoded in one CRISPR‐GFP lentiviral plasmid, as previously described. 19 sgRNA (listed in Table S4) was designed in intron 6 and intron 8 of human ETO2 to target only the endogenous ETO2. HEL and K562 cell lines were firstly transduced with lentiviral particles encoding ETO2 cDNA, and 250 ng/mL of doxycycline (Ozyme) was added to culture media to exogenously express ETO2. Then, mCherry+ cells were sorted. Cells were therefore cotransduced with CRISPR‐GFP lentiviral particles, and CRISPR‐edited single cells were cloned by flow sorting in 96‐well plates and grown under DOX treatment. Clones were screened with PCR amplification of ETO2 intron 6–8 to detect homozygous deletion (primer described in Table S4). Positive clones were selected, and homozygous ETO2 knockout was validated by Sanger sequencing and western blot. For functional and molecular studies, we used the dose of DOX (250 ng/mL) providing in knockout cells with a similar ETO2 expression as compared to the parental cells.
Chromatin immunoprecipitation sequencing (ChIPseq)
ChIP protocol was adapted from MagnaChIP kit protocol (Millipore) as previously described. 19 Briefly, cells were fixed in 1% paraformaldehyde (after 2 mM DSG fixation in the case of ETO2/MYB/EP300 ChIPseq) and reaction stopped with 125 mM glycine (final concentration). For HEL‐ETO2KO, chromatin extracted from 10–20 × 106 cells was sonicated (Covaris apparatus; KBioscience or Bioruptor Pico; Diagenode). For HEL knocked‐down for MYB/empty vector or treated with DMSO/dCBP‐1, chromatin extracted from 2 × 10⁶ cells was digested by micrococcal nuclease (NEB) and sonicated for 15 s using Bioruptor Plus (medium intensity; Diagenode). Sheared chromatin was precleared using protein G sepharose beads (Sigma‐Aldrich) previously blocked with 500 μg/mL BSA and 200 μg/mL salmon DNA, 30 min at 4°C. No spike‐in was used in this study, and input chromatin was used for normalization. Sheared‐precleared chromatin was immunoprecipitated overnight with appropriated antibodies listed in Table S3. Immune complexes were precipitated using blocked protein G sepharose beads 1.5 h at 4°C on wheel. After washing, DNA was collected using IPure Kit V2 (Diagenode) following manufacturer's instructions. DNA fragments were amplified by PCR with indexed paired‐end adaptors (Illumina). PCR purification was performed using AMPure XP magnetic beads (Beckman Coulter), and sequencings were performed using Illumina HiSeq. 2000 or NovaSeq. 6000 (Illumina). For ChIP‐qPCR analysis, binding to loci of interest was quantified using primers listed in Table S4.
ChIPseq analysis
Reads were trimmed and aligned to human genome hg19 using TrimGalore and Bowtie2, respectively (Galaxy version 2.3.4.3), and duplicated reads removed using Samtools (Galaxy version 1.9). Peak calling was performed using MACS2 (Galaxy Version 2.1.1.20160309.6) with the following parameters: ‐‐nomodel, ‐‐extsize 200, ‐‐shift 100, and –qvalue 0.05. For histone mark specifically, the option ‐‐broad was used to identify broad peaks. Read quantification was performed using featureCount (Rsubread) and normalized using DESeq. 2. Normalized bigwig files were generated using bamCompare (Galaxy version 3.3.2.0.0) with the following parameters: bin‐size 20 and ‐‐smoothLength 60, or using bamCoverage (Galaxy version 3.3.2.0.0), used for comparative analysis using computeMatrix (Galaxy Version 3.5.1.0.0) and graphically represented as plot line or heatmap using plotProfile and plotheatmap (deepTools version 3.5.0) respectively. ChIP‐seq peak visualization was performed with IGV (version 2.3.88). Motif analyses and peaks annotation were performed using HOMER (findMotifsGenome.pl and annotatePeaks.pl; version 4.10.4). Peaks were assigned to the closest TSS, and therefore, the associated genes are inferred. Typical‐enhancers and super‐enhancers were identified with the ROSE algorithm. 23 , 25 Heatmap and line plot were performed using plotHeatmap and plotProfile, respectively (deepTools Galaxy version 3.3.2.0.1).
RNA extraction and quantitative PCR (qPCR)
RNA was extracted using RNeasy mini or micro Kit (Qiagen) according to the manufacturer's recommendations. Reverse transcription (RT) was performed using SuperScript II (Invitrogen). qPCR was performed using SYBR Select Master mix (Applied Biosystems) on a 7500HT Fast Real‐Time PCR System (Applied Biosystems) following the manufacturer's recommendations. Primer sequences are listed in Table S4.
Nascent RNA extraction and quantification
Nascent RNA was extracted and purified using Click‐iTR Nascent RNA Capture Kit (Thermofisher) according to manufacturer recommendation with minor modifications described as follows. 5′‐EU (0.2 mM) was added to culture medium and incubated for 3 h followed by RNA extraction as described above. Ten micrograms of RNA with 0.25 mM of Biotin Azide was used for 5′‐EU‐RNA biotinylation. After isopropanol/ethanol precipitation, RNA was resuspended into UltraPure™ DNase/RNase‐Free Distilled Water (Invitrogen) and quantified with Nanodrop (ThermoScientific). 5′‐EU‐RNA biotinylated was purified (following the manufacturer's protocol) and immediately used for first‐strand cDNA synthesis using SuperScript II (Invitrogen). QPCR was performed using SYBR Select Master mix (Applied Biosystems) on a 7500HT Fast Real‐Time PCR System (Applied Biosystems) following the manufacturer's recommendations. Primer sequences are listed in Table S4.
RNA sequencing (RNAseq) and analysis
RNA‐seq was performed as described 21 or sequenced on HiSeq 4000 (Illumina) at the GenomEast Platform facility. Briefly, reads were aligned, and the number of reads per genes was computed using Salmon (version 1.3.0). Differential expressed genes were identified using DESeq. 2 (version 1.14.1) with a p value‐adjusted cutoff of 0.05. The 65 activated ETO2 targets were identified as genes downregulated at both 24 and 144 h after DOX removal compared to cell maintain with DOX in both HEL‐ETO2KO and K562‐ETO2KO as well as downregulated in K562 expressing NC128 compared to an empty vector. Similar analysis using upregulated genes leads to the identification of the 125 repressed ETO2 targets. Integration with ETO2 ChIP‐seq data was performed by intersecting downregulated/upregulated gene list with genes identified as the closest TSS from ETO2 peaks using HOMER (annotatePeaks.pl). Gene Set Enrichment Analyses (GSEA) were performed with GSEA software (version 4.0.3) using available data set (Broad Institute). Activated and repressed ETO2 target signature scoring was computed using ssGSEA (for bulk data set) or AUCell (for single‐cell data set) R packages. For enhancer RNA (eRNA) quantification, eRNA peaks were localized using MACS2 on aligned RNA‐seq data (using Bowtie2 and hg19 reference genome) and intersected with a previously defined H3K27ac broad peak containing ETO2 binding sites. FeatureCounts and DESeq2 were used to quantify and normalize RNA count, respectively, at defined eRNA regions. Normalized bigwig file was generated using bamCoverage and visualized on IGV. Comparative analysis was computed using ssGSEA R package or computeMatrix and visualized using plotProfile (deepTools).
Data and code availability
Sequencing data were submitted to EBI (ArrayExpress) under the accession E‐MTAB‐10346 and E‐MTAB‐13151. Other publicly available data were used. For ChIP‐seq data: ETO2 (GSE105706 and GSE126953), H3K27ac (GSM733656, GSM772870, GSE115115, and ERR671846), and EP300 (GSM935401 and GSM2026059). 22 , 62 , 63 For AEL/AML/ALL expression data: EGAS00001004203, EGAD00001003412, GSE13204, GSE7186, OEP002748, NIH‐project ID: TCGA‐LAML (https://portal.gdc.cancer.gov/projects/TCGA-LAML), Ferrando et al., Cancer Cell. 2002, and human cell lines (https://www.proteinatlas.org). 21 , 26 , 27 , 35 , 64 , 65 For K562 cell lines treated with EP300/CBP inhibitor CBP30 and C646: GSE77295 and GSE110229. 28 For single‐cell gene expression data: GSE116256. 29
Statistical analysis
Statistical significance was calculated using Prism (version 6.0a) and is indicated as p values (Student t test except when otherwise specified). *p < 0.05, **p < 0.01, ***p < 0.001.
AUTHOR CONTRIBUTIONS
Alexandre Fagnan conceived, performed, and analyzed experiments and drafted the manuscript. Zakia Aid, Marie Baille, Aneta Drakul, Elie Robert, Cécile K. Lopez, Cécile Thirant, Yann Lecluse, Julie Rivière, Cathy Ignacimouttou, Audrey Naimo, Christophe Marzac, Sébastien Malinge, Julie Chaumeil, and Thomas Mercher performed and analyzed experiments. Alexandre Fagnan and Elie Robert performed bioinformatics analyses. Alexandre Fagnan, Silvia Salmoiraghi, Eduardo Anguita, Françoise Pflumio, Christian Wichmann, Yun Huang, Jean‐Pierre Bourquin, Camille Lobry, Eric Soler, Claus Nerlov, Oliver A. Bernard, and Juerg Schwaller provided patient samples and clinical information or major intellectual inputs and/or reagents. Thomas Mercher conceived and supervised the project and wrote the manuscript. All authors agreed to the submitted version of the manuscript.
CONFLICT OF INTEREST STATEMENT
The authors declare no conflict of interest.
FUNDING
This study was supported by the Institut National Du Cancer (PLBIO‐2014‐176 and PLBIO‐2018‐169 to T. M.), Ligue contre le cancer (A. F.: PhD grant, TM: équipe labelisée), Cancéropôle Ile‐de‐France (to C. K. L. 2014‐2017), SIRIC‐SOCRATE (INCa‐DGOS‐INSERM 6043 to T. M.), Fondation pour la Recherche Médicale (to Z. A.: FRM‐ING20150532273, A. F.: FRM‐FDT201904008395, Cancéropôle Île‐de‐France (Emergence 2015), and Gustave Roussy Genomic Core Facility (Taxe d'apprentissage TA2018‐ and TA2019‐ALFA [to A. F.]). A. F. is supported by an EHA Junior Research grant. F. P. and T. M. are members of the OPALE Carnot institute. T. M. is supported by the PEDIAC program (INCA_15 670).
Supporting information
Supporting information.
Supporting information.
Supporting information.
ACKNOWLEDGMENTS
We are grateful to Marie‐Laure Arcangeli for scientific discussion, to Mehdi Khaled for providing important cloning tools, and to the Gustave Roussy Institute genomic, imaging, and preclinical platforms.
Contributor Information
Alexandre Fagnan, Email: alexandre.fagnan@ndcls.ox.ac.uk.
Thomas Mercher, Email: thomas.mercher@inserm.fr.
DATA AVAILABILITY STATEMENT
The data that support the findings of this study are available from the corresponding author upon reasonable request.
REFERENCES
- 1. Papaemmanuil E, Gerstung M, Bullinger L, et al. Genomic classification and prognosis in acute myeloid leukemia. N Engl J Med. 2016;374(23):2209‐2221. 10.1056/NEJMoa1516192 [DOI] [PMC free article] [PubMed] [Google Scholar]
- 2. Krivtsov AV, Evans K, Gadrey JY, et al. A Menin‐MLL inhibitor induces specific chromatin changes and eradicates disease in models of MLL‐rearranged leukemia. Cancer Cell. 2019;36(6):660‐673.e11. 10.1016/j.ccell.2019.11.001 [DOI] [PMC free article] [PubMed] [Google Scholar]
- 3. Zhu J, Koken MHM, Quignon F, et al. Arsenic‐induced PML targeting onto nuclear bodies: implications for the treatment of acute promyelocytic leukemia. Proc Natl Acad Sci. 1997;94(8):3978‐3983. 10.1073/pnas.94.8.3978 [DOI] [PMC free article] [PubMed] [Google Scholar]
- 4. Golub D, Iyengar N, Dogra S, et al. Mutant isocitrate dehydrogenase inhibitors as targeted cancer therapeutics. Front Oncol. 2019;9:417. 10.3389/fonc.2019.00417 [DOI] [PMC free article] [PubMed] [Google Scholar]
- 5. Wang Z, Wang P, Li Y, et al. Interplay between cofactors and transcription factors in hematopoiesis and hematological malignancies. Signal Transduct Target Ther. 2021;6(1):1‐16. 10.1038/s41392-020-00422-1 [DOI] [PMC free article] [PubMed] [Google Scholar]
- 6. Daigle SR, Olhava EJ, Therkelsen CA, et al. Selective killing of mixed lineage leukemia cells by a potent small‐molecule DOT1L inhibitor. Cancer Cell. 2011;20(1):53‐65. 10.1016/j.ccr.2011.06.009 [DOI] [PMC free article] [PubMed] [Google Scholar]
- 7. Issa GC, Aldoss I, DiPersio J, et al. The menin inhibitor revumenib in KMT2A‐rearranged or NPM1‐mutant leukaemia. Nature. 2023;615(7954):920‐924. 10.1038/s41586-023-05812-3 [DOI] [PMC free article] [PubMed] [Google Scholar]
- 8. Fujiwara T, Alqadi YW, Okitsu Y, et al. Role of transcriptional corepressor ETO2 in erythroid cells. Exp Hematol. 2013;41(3):303‐315. 10.1016/j.exphem.2012.10.015 [DOI] [PubMed] [Google Scholar]
- 9. Steinauer N, Guo C, Zhang J. Emerging roles of MTG16 in cell‐fate control of hematopoietic stem cells and cancer. Stem Cells Int. 2017;2017:1‐12. 10.1155/2017/6301385 [DOI] [PMC free article] [PubMed] [Google Scholar]
- 10. Chyla BJ, Moreno‐Miralles I, Steapleton MA, et al. Deletion of Mtg16, a target of t(16;21), alters hematopoietic progenitor cell proliferation and lineage allocation. Mol Cell Biol. 2008;28(20):6234‐6247. 10.1128/MCB.00404-08 [DOI] [PMC free article] [PubMed] [Google Scholar]
- 11. Goardon N, Lambert JA, Rodriguez P, et al. ETO2 coordinates cellular proliferation and differentiation during erythropoiesis. EMBO J. 2006;25(2):357‐366. 10.1038/sj.emboj.7600934 [DOI] [PMC free article] [PubMed] [Google Scholar]
- 12. Stadhouders R, Cico A, Stephen T, et al. Control of developmentally primed erythroid genes by combinatorial co‐repressor actions. Nat Commun. 2015;6:8893. 10.1038/ncomms9893 [DOI] [PMC free article] [PubMed] [Google Scholar]
- 13. Schuh AH, Tipping AJ, Clark AJ, et al. ETO‐2 associates with SCL in erythroid cells and megakaryocytes and provides repressor functions in erythropoiesis. Mol Cell Biol. 2005;25(23):10235‐10250. 10.1128/MCB.25.23.10235-10250.2005 [DOI] [PMC free article] [PubMed] [Google Scholar]
- 14. Miyoshi H, Shimizu K, Kozu T, Maseki N, Kaneko Y, Ohki M. t(8;21) breakpoints on chromosome 21 in acute myeloid leukemia are clustered within a limited region of a single gene, AML1. Proc Natl Acad Sci. 1991;88(23):10431‐10434. 10.1073/pnas.88.23.10431 [DOI] [PMC free article] [PubMed] [Google Scholar]
- 15. Thiollier C, Lopez CK, Gerby B, et al. Characterization of novel genomic alterations and therapeutic approaches using acute megakaryoblastic leukemia xenograft models. J Exp Med. 2012;209(11):2017‐2031. 10.1084/jem.20121343 [DOI] [PMC free article] [PubMed] [Google Scholar]
- 16. Gruber TA, Larson Gedman A, Zhang J, et al. An Inv(16)(p13.3q24.3)‐encoded CBFA2T3‐GLIS2 fusion protein defines an aggressive subtype of pediatric acute megakaryoblastic leukemia. Cancer Cell. 2012;22(5):683‐697. 10.1016/j.ccr.2012.10.007 [DOI] [PMC free article] [PubMed] [Google Scholar]
- 17. Micci F, Thorsen J, Panagopoulos I, et al. High‐throughput sequencing identifies an NFIA/CBFA2T3 fusion gene in acute erythroid leukemia with t(1;16)(p31;q24). Leukemia. 2013;27(4):980‐982. 10.1038/leu.2012.266 [DOI] [PMC free article] [PubMed] [Google Scholar]
- 18. King RL, Siaghani PJ, Wong K, et al. Novel t(1;8)(p31.3;q21.3) NFIA ‐ RUNX1T1 translocation in an infant erythroblastic sarcoma. Am J Clin Path. 2021;156(1):129‐138. 10.1093/ajcp/aqaa216 [DOI] [PubMed] [Google Scholar]
- 19. Thirant C, Ignacimouttou C, Lopez CK, et al. ETO2‐GLIS2 Hijacks transcriptional complexes to drive cellular identity and self‐renewal in pediatric acute megakaryoblastic leukemia. Cancer Cell. 2017; 31(3):452‐465. 10.1016/j.ccell.2017.02.006 [DOI] [PubMed] [Google Scholar]
- 20. Wichmann C, Chen L, Heinrich M, et al. Targeting the oligomerization domain of ETO interferes with RUNX1/ETO oncogenic activity in t(8;21)‐positive leukemic cells. Cancer Res. 2007;67(5):2280‐2289. 10.1158/0008-5472.CAN-06-3360 [DOI] [PubMed] [Google Scholar]
- 21. Fagnan A, Bagger FO, Piqué‐Borràs MR, et al. Human erythroleukemia genetics and transcriptomes identify master transcription factors as functional disease drivers. Blood. 2020;136(6):698‐714. 10.1182/blood.2019003062 [DOI] [PMC free article] [PubMed] [Google Scholar]
- 22. Steinauer N, Guo C, Huang C, et al. Myeloid translocation gene CBFA2T3 directs a relapse gene program and determines patient‐specific outcomes in AML. Blood Adv. 2019;3(9):1379‐1393. 10.1182/bloodadvances.2018028514 [DOI] [PMC free article] [PubMed] [Google Scholar]
- 23. Lovén J, Hoke HA, Lin CY, et al. Selective inhibition of tumor oncogenes by disruption of super‐enhancers. Cell. 2013;153(2):320‐334. 10.1016/j.cell.2013.03.036 [DOI] [PMC free article] [PubMed] [Google Scholar]
- 24. Hnisz D, Abraham BJ, Lee TI, et al. Super‐enhancers in the control of cell identity and disease. Cell. 2013;155(4):934‐947. 10.1016/j.cell.2013.09.053 [DOI] [PMC free article] [PubMed] [Google Scholar]
- 25. Whyte WA, Orlando DA, Hnisz D, et al. Master transcription factors and mediator establish super‐enhancers at key cell identity genes. Cell. 2013;153(2):307‐319. 10.1016/j.cell.2013.03.035 [DOI] [PMC free article] [PubMed] [Google Scholar]
- 26. Iacobucci I, Wen J, Meggendorfer M, et al. Genomic subtyping and therapeutic targeting of acute erythroleukemia. Nat Genet. 2019;51(4):694‐704. 10.1038/s41588-019-0375-1 [DOI] [PMC free article] [PubMed] [Google Scholar]
- 27. Kohlmann A, Kipps TJ, Rassenti LZ, et al. An international standardization programme towards the application of gene expression profiling in routine leukaemia diagnostics: the Microarray Innovations in LEukemia study prephase. Br J Haematol. 2008;142(5):802‐807. 10.1111/j.1365-2141.2008.07261.x [DOI] [PMC free article] [PubMed] [Google Scholar]
- 28. Garcia‐Carpizo V, Ruiz‐Llorente S, Sarmentero J, Graña‐Castro O, Pisano DG, Barrero MJ. CREBBP/EP300 bromodomains are critical to sustain the GATA1/MYC regulatory axis in proliferation. Epigenetics Chromatin. 2018;11(1):30. 10.1186/s13072-018-0197-x [DOI] [PMC free article] [PubMed] [Google Scholar]
- 29. van Galen P, Hovestadt V, Wadsworth MH II, et al. Single‐cell RNA‐seq reveals AML hierarchies relevant to disease progression and immunity. Cell. 2019;176(6):1265‐1281.e24. 10.1016/j.cell.2019.01.031 [DOI] [PMC free article] [PubMed] [Google Scholar]
- 30. Ng SWK, Mitchell A, Kennedy JA, et al. A 17‐gene stemness score for rapid determination of risk in acute leukaemia. Nature. 2016;540(7633):433‐437. 10.1038/nature20598 [DOI] [PubMed] [Google Scholar]
- 31. Meyers RM, Bryan JG, McFarland JM, et al. Computational correction of copy number effect improves specificity of CRISPR‐Cas9 essentiality screens in cancer cells. Nature Genet. 2017;49(12):1779‐1784. 10.1038/ng.3984 [DOI] [PMC free article] [PubMed] [Google Scholar]
- 32. Cotto KC, Wagner AH, Feng YY, et al. DGIdb 3.0: a redesign and expansion of the drug‐gene interaction database. Nucleic Acids Res. 2018;46(D1):D1068‐D1073. 10.1093/nar/gkx1143 [DOI] [PMC free article] [PubMed] [Google Scholar]
- 33. Keeton EK, McEachern K, Dillman KS, et al. AZD1208, a potent and selective pan‐Pim kinase inhibitor, demonstrates efficacy in preclinical models of acute myeloid leukemia. Blood. 2014;123(6):905‐913. 10.1182/blood-2013-04-495366 [DOI] [PMC free article] [PubMed] [Google Scholar]
- 34. Wang X, Angelis N, Thein SL. MYB—a regulatory factor in hematopoiesis. Gene. 2018;665:6‐17. 10.1016/j.gene.2018.04.065 [DOI] [PMC free article] [PubMed] [Google Scholar]
- 35. Fuglerud BM, Lemma RB, Wanichawan P, Sundaram AYM, Eskeland R, Gabrielsen OS. A c‐Myb mutant causes deregulated differentiation due to impaired histone binding and abrogated pioneer factor function. Nucleic Acids Res. 2017;45(13):7681‐7696. 10.1093/nar/gkx364 [DOI] [PMC free article] [PubMed] [Google Scholar]
- 36. Sandberg ML, Sutton SE, Pletcher MT, et al. c‐Myb and p300 regulate hematopoietic stem cell proliferation and differentiation. Dev Cell. 2005;8(2):153‐166. 10.1016/j.devcel.2004.12.015 [DOI] [PubMed] [Google Scholar]
- 37. Visel A, Blow MJ, Li Z, et al. ChIP‐seq accurately predicts tissue‐specific activity of enhancers. Nature. 2009;457(7231):854‐858. 10.1038/nature07730 [DOI] [PMC free article] [PubMed] [Google Scholar]
- 38. Kim DI, Jensen SC, Noble KA, et al. An improved smaller biotin ligase for BioID proximity labeling. Mol Biol Cell. 2016;27(8):1188‐1196. 10.1091/mbc.E15-12-0844 [DOI] [PMC free article] [PubMed] [Google Scholar]
- 39. Lasko LM, Jakob CG, Edalji RP, et al. Discovery of a selective catalytic p300/CBP inhibitor that targets lineage‐specific tumours. Nature. 2017;550(7674):128‐132. 10.1038/nature24028 [DOI] [PMC free article] [PubMed] [Google Scholar]
- 40. Vannam R, Sayilgan J, Ojeda S, et al. Targeted degradation of the enhancer lysine acetyltransferases CBP and p300. Cell Chem Biol. 2021;28(4):503‐514. 10.1016/j.chembiol.2020.12.004 [DOI] [PubMed] [Google Scholar]
- 41. Lutterbach B, Westendorf JJ, Linggi B, et al. ETO, a Target of t(8;21) in Acute Leukemia, Interacts with the N‐CoR and mSin3 Corepressors. Mol Cell Biol. 1998;18(12):7176‐7184. 10.1128/MCB.18.12.7176 [DOI] [PMC free article] [PubMed] [Google Scholar]
- 42. Amann JM, Nip J, Strom DK, et al. ETO, a target of t(8;21) in acute leukemia, makes distinct contacts with multiple histone deacetylases and binds mSin3A through its oligomerization domain. Mol Cell Biol. 2001;21(19):6470‐6483. 10.1128/MCB.21.19.6470-6483.2001 [DOI] [PMC free article] [PubMed] [Google Scholar]
- 43. Salaverria I, Martin‐Guerrero I, Burkhardt B, et al. High resolution copy number analysis of IRF4 translocation‐positive diffuse large B‐cell and follicular lymphomas. Genes Chromosom Cancer. 2013;52(2):150‐155. 10.1002/gcc.22014 [DOI] [PubMed] [Google Scholar]
- 44. Jakobczyk H, Debaize L, Soubise B, et al. Reduction of RUNX1 transcription factor activity by a CBFA2T3‐mimicking peptide: application to B cell precursor acute lymphoblastic leukemia. J Hematol Oncol. 2021;14(1):47. 10.1186/s13045-021-01051-z [DOI] [PMC free article] [PubMed] [Google Scholar]
- 45. Xie S, Duan J, Li B, Zhou P, Hon GC. Multiplexed engineering and analysis of combinatorial enhancer activity in single cells. Mol Cell. 2017;66(2):285‐299. 10.1016/j.molcel.2017.03.007 [DOI] [PubMed] [Google Scholar]
- 46. Fujiwara T, O'Geen H, Keles S, et al. Discovering hematopoietic mechanisms through genome‐wide analysis of GATA factor chromatin occupancy. Mol Cell. 2009;36(4):667‐681. 10.1016/j.molcel.2009.11.001 [DOI] [PMC free article] [PubMed] [Google Scholar]
- 47. Choi A, Illendula A, Pulikkan JA, et al. RUNX1 is required for oncogenic Myb and Myc enhancer activity in T‐cell acute lymphoblastic leukemia. Blood. 2017;130(15):1722‐1733. 10.1182/blood-2017-03-775536 [DOI] [PMC free article] [PubMed] [Google Scholar]
- 48. Huang Y, Mouttet B, Warnatz HJ, et al. The leukemogenic TCF3‐HLF complex rewires enhancers driving cellular identity and self‐renewal conferring EP300 vulnerability. Cancer Cell. 2019;36(6):630‐644.e9. 10.1016/j.ccell.2019.10.004 [DOI] [PubMed] [Google Scholar]
- 49. Michmerhuizen NL, Klco JM, Mullighan CG. Mechanistic insights and potential therapeutic approaches for NUP98‐rearranged hematologic malignancies. Blood. 2020;136(20):2275‐2289. 10.1182/blood.2020007093 [DOI] [PMC free article] [PubMed] [Google Scholar]
- 50. Huang S, Qiu Y, Stein RW, Brandt SJ. p300 functions as a transcriptional coactivator for the TAL1/SCL oncoprotein. Oncogene. 1999;18(35):4958‐4967. 10.1038/sj.onc.1202889 [DOI] [PubMed] [Google Scholar]
- 51. Tracey LJ, Brooke‐Bisschop T, Jansen PWTC, Campos EI, Vermeulen M, Justice MJ. The pluripotency regulator PRDM14 requires hematopoietic regulator CBFA2T3 to initiate leukemia in mice. Mol Cancer Res. 2019;17(7):1468‐1479. 10.1158/1541-7786.MCR-18-1327 [DOI] [PMC free article] [PubMed] [Google Scholar]
- 52. Deng W, Lee J, Wang H, et al. Controlling long‐range genomic interactions at a native locus by targeted tethering of a looping factor. Cell. 2012;149(6):1233‐1244. 10.1016/j.cell.2012.03.051 [DOI] [PMC free article] [PubMed] [Google Scholar]
- 53. Guo X, Plank‐Bazinet J, Krivega I, Dale RK, Dean A. Embryonic erythropoiesis and hemoglobin switching require transcriptional repressor ETO2 to modulate chromatin organization. Nucleic Acids Res. 2020;48(18):10226‐10240. 10.1093/nar/gkaa736 [DOI] [PMC free article] [PubMed] [Google Scholar]
- 54. Stadhouders R, Thongjuea S, Andrieu‐Soler C, et al. Dynamic long‐range chromatin interactions control Myb proto‐oncogene transcription during erythroid development. EMBO J. 2012;31(4):986‐999. 10.1038/emboj.2011.450 [DOI] [PMC free article] [PubMed] [Google Scholar]
- 55. Xie S, Armendariz D, Zhou P, Duan J, Hon GC. Global analysis of enhancer targets reveals convergent enhancer‐driven regulatory modules. Cell Rep. 2019;29(9):2570‐2578.e5. 10.1016/j.celrep.2019.10.073 [DOI] [PMC free article] [PubMed] [Google Scholar]
- 56. Soler E, Andrieu‐Soler C, de Boer E, et al. The genome‐wide dynamics of the binding of Ldb1 complexes during erythroid differentiation. Genes Dev. 2010;24(3):277‐289. 10.1101/gad.551810 [DOI] [PMC free article] [PubMed] [Google Scholar]
- 57. Gröschel S, Sanders MA, Hoogenboezem R, et al. A Single oncogenic enhancer rearrangement causes concomitant EVI1 and GATA2 deregulation in leukemia. Cell. 2014;157(2):369‐381. 10.1016/j.cell.2014.02.019 [DOI] [PubMed] [Google Scholar]
- 58. Smeenk L, Ottema S, Mulet‐Lazaro R, et al. Selective requirement of MYB for oncogenic hyperactivation of a translocated enhancer in leukemia. Cancer Discovery. 2021;11(11):2868‐2883. 10.1158/2159-8290.CD-20-1793 [DOI] [PMC free article] [PubMed] [Google Scholar]
- 59. Jordaan G, Liao W, Gera J, Sharma S. Rictor Overexpression and mTORC2 Signaling in Chronic Lymphocytic Leukemia. Blood. 2012;120(21):3884. 10.1182/blood.V120.21.3884.3884 [DOI] [Google Scholar]
- 60. Decker S, Finter J, Forde AJ, et al. PIM kinases are essential for chronic lymphocytic leukemia cell survival (PIM2/3) and CXCR4‐mediated microenvironmental interactions (PIM1). Mol Cancer Ther. 2014;13(5):1231‐1245. 10.1158/1535-7163.MCT-13-0575-T [DOI] [PubMed] [Google Scholar]
- 61. Malinge S, Bliss‐Moreau M, Kirsammer G, et al. Increased dosage of the chromosome 21 ortholog Dyrk1a promotes megakaryoblastic leukemia in a murine model of Down syndrome. J Clin Invest. 2012;122(3):948‐962. 10.1172/JCI60455 [DOI] [PMC free article] [PubMed] [Google Scholar]
- 62. ENCODE Project Consortium . An integrated encyclopedia of DNA elements in the human genome. Nature. 2012;489(7414):57‐74. 10.1038/nature11247 [DOI] [PMC free article] [PubMed] [Google Scholar]
- 63. Xu Y, Man N, Karl D, et al. TAF1 plays a critical role in AML1‐ETO driven leukemogenesis. Nat Commun. 2019;10(1):4925. 10.1038/s41467-019-12735-z [DOI] [PMC free article] [PubMed] [Google Scholar]
- 64. Ferrando AA, Neuberg DS, Staunton J, et al. Gene expression signatures define novel oncogenic pathways in T cell acute lymphoblastic leukemia. Cancer Cell. 2002;1(1):75‐87. 10.1016/S1535-6108(02)00018-1 [DOI] [PubMed] [Google Scholar]
- 65. Andersson A, Ritz C, Lindgren D, et al. Microarray‐based classification of a consecutive series of 121 childhood acute leukemias: prediction of leukemic and genetic subtype as well as of minimal residual disease status. Leukemia. 2007;21(6):1198‐1203. 10.1038/sj.leu.2404688 [DOI] [PubMed] [Google Scholar]
Associated Data
This section collects any data citations, data availability statements, or supplementary materials included in this article.
Supplementary Materials
Supporting information.
Supporting information.
Supporting information.
Data Availability Statement
Sequencing data were submitted to EBI (ArrayExpress) under the accession E‐MTAB‐10346 and E‐MTAB‐13151. Other publicly available data were used. For ChIP‐seq data: ETO2 (GSE105706 and GSE126953), H3K27ac (GSM733656, GSM772870, GSE115115, and ERR671846), and EP300 (GSM935401 and GSM2026059). 22 , 62 , 63 For AEL/AML/ALL expression data: EGAS00001004203, EGAD00001003412, GSE13204, GSE7186, OEP002748, NIH‐project ID: TCGA‐LAML (https://portal.gdc.cancer.gov/projects/TCGA-LAML), Ferrando et al., Cancer Cell. 2002, and human cell lines (https://www.proteinatlas.org). 21 , 26 , 27 , 35 , 64 , 65 For K562 cell lines treated with EP300/CBP inhibitor CBP30 and C646: GSE77295 and GSE110229. 28 For single‐cell gene expression data: GSE116256. 29
The data that support the findings of this study are available from the corresponding author upon reasonable request.