

Abstract
Severe COVID-19 can lead to extensive lung disease causing lung architectural distortion. In this study we employed machine learning and statistical atlas-based approaches to explore possible changes in lung shape among COVID-19 patients and evaluated whether the extent of these changes was associated with COVID-19 severity. On a large multi-institutional dataset (N=3443), three different populations were defined; a) healthy (no COVID-19), b) mild COVID-19 (no ventilator required), c) severe COVID-19 (ventilator required), and the presence of lung shape differences between them were explored using baseline chest CT. Significant lung shape differences were observed along mediastinal surfaces of the lungs across all severity of COVID-19 disease. Additionally, differences were seen on basal surfaces of the lung when compared between healthy and severe COVID-19 patients. Finally, an AI model (a 3D residual convolutional network) characterizing these shape differences coupled with lung infiltrates (ground-glass opacities and consolidation regions) was found to be associated with COVID-19 severity.
1. Introduction
The on-going Coronavirus disease of 2019 (COVID-19) pandemic has prevailed in the form of multiple mutant variants including the most recent Omicron variants BA.4 and BA.5 (Rahman et al., 2022; Tuekprakhon et al., 2022). In spite of administration of multiple vaccine doses, COVID-19 has led to severe respiratory complications and numerous deaths (Jain et al., 2021). Chest computed tomography (CT) examination demonstrates pathological changes in the lung, mostly as lung infiltrates (ground-glass opacities and consolidations), especially in the peripheral regions of the lung (Kanne, 2020). Recently, studies have illustrated the importance of chest CTs not only for diagnosis of COVID-19 but also for staging and monitoring disease progression (Yang et al., 2020).
With COVID-19 cases continuing to remain high, artificial intelligence (AI) based approaches have been developed using CT or chest radiographs for COVID-19 diagnosis (Ren et al., 2022; Serte and Demirel, 2021) and distinguishing COVID-19 disease from other causes of pneumonia (Cardobi et al., 2021, p. 1). Additionally, a few studies have also developed AI-based biomarkers for COVID-19 prognosis identifying severe COVID-19 patients with high risk of mortality (Chamberlin et al., 2022) or those with need of mechanical ventilator (A.l. et al., 2021).
Recent studies have shown that severe COVID-19 disease can lead to complications such as pneumonia, acute respiratory distress syndrome (ARDS), and sepsis (SeyedAlinaghi et al., 2021). These complications may further cause acute lung damage followed by pulmonary fibrosis and chronic impairment of lung function (Wang et al., 2020, p. 19). While for some patients, damage caused to the lung may ameliorate over time, for others, lung damage may persistent and cause permanent loss of lung function (Wu et al., 2020). While it is known that severe COVID-19 disease may potentially cause extensive lung damage and persistent architectural distortion of the lung, to the best of our knowledge, there has been no quantitative effort to study impact of disease severity on lung structure, shape and morphology during early onset of the disease.
While previous studies have used deep learning approaches on CT scans for COVID-19 prognosis (Hiremath et al., 2021; Lee et al., 2021), most of these approaches rely on biomarkers derived from lung infiltrates for their analysis. However, the objective of this study was to explore the impact of severity of the disease on lung shape and morphology using baseline CT scans acquired at the time of COVID-19 diagnosis. On a large multi-institutional dataset (N=3443), at first, three different populations were defined; a) healthy (no COVID-19), b) mild COVID-19 (no ventilator required), c) severe COVID-19 (ventilator required) and separate statistical population-atlas models were built and compared to understand differences in shape and appearance of the lung. Subsequently, these statistical models were further integrated with deep learning to learn the extent of lung deformation associated with severity of the disease. Finally, deep learning derived features of lung deformation and shape differences were integrated with deep learning derived features of lung infiltrates to create a prognostic biomarker for COVID-19.
2. Methods and Materials
2.1. COVID-19 study population
Patients with COVID-19 disease as confirmed with reverse transcription polymerase chain reaction (RT-PCR) who underwent CT evaluation for diagnosis were identified for this study. This study included a retrospective cohort of N=3230 patients with data acquired from four different sources; N=835 patients from D1 (Renmin Hospital of Wuhan University), N=113 from D2 (University Hospitals Cleveland Medical Center), N=2000 from D3 (a publicly available challenge dataset: Study of Thoracic CT in COVID-19 (STOIC)(Revel et al., 2021, p.)), N=282 from D4 (a publicly available dataset from The Cancer Imaging Archive (TCIA) release by the Stony Brook University). The dataset from source D1 was stratified based on the severity, and randomly split into 50% training (D1train: N=416) and 50% testing (D1test: N = 419), while data from the sources D2, D3 and D4 were all used as an external independent test set to test our hypothesis. Summary characteristics with detailed information of cohorts D1-D4 including inclusion and exclusion criteria are provided in the supplementary section, S1. Additionally, details of CT acquisition parameters are presented in Table S1.
Additionally, a randomly selected set of N=213 patients from the National Lung Screening Trial (NLST) Spiral CT abnormalities dataset (Clark et al., 2013; National Lung Screening Trial Research Team, 2013; National Lung Screening Trial Research Team et al., 2011) marked as “Other minor abnormality noted” was used as part of a control cohort (D5). All patients from datasets D1-D5 were grouped into three categories based on severity; a) healthy patients (control cohort) with no COVID-19 disease), b) mildly affected COVID-19 patients (patients who did not require a mechanical ventilator), c) severely affected COVID-19 patients (patients who required a mechanical ventilator).
2.2. Manual delineations of lung and lung infiltrates
A board-certified cardiothoracic radiologist with 14 years of experience delineated lung regions and lung infiltrates (ground-glass opacities and consolidations) on the training set D1train (N = 416). The annotations were made using an open source software 3D Slicer v4.10 (Fedorov et al., 2012). For the rest of the patients in the test sets (D1test, D2, D3 and D4), automated lung and lung infiltrate segmentations were obtained using a U-Net based convolutional neural network (CNN) trained from D1train.
2.3. Population based lung shape difference atlas (DA) construction
2.3.1. Atlas construction with single split of training data
Difference atlases are often used to identify significant shape variations in anatomic regions between different populations using statistical approaches (Ashburner et al., 1998; Scher et al., 2007). The characteristics of shape differences as identified by difference atlases are further used to predict disease diagnosis and prognosis. In our study, we constructed a difference atlas (DA) to identify significant shape differences between COVID-19 patients with mild and severe disease. Fig. 1 shows the flowchart explaining construction of a difference atlas (DA) through a population-atlas model. The population atlas model takes CT scans of two sets of population separately as inputs and outputs DA depicting statistically significant shape differences between the input populations.
Figure 1:
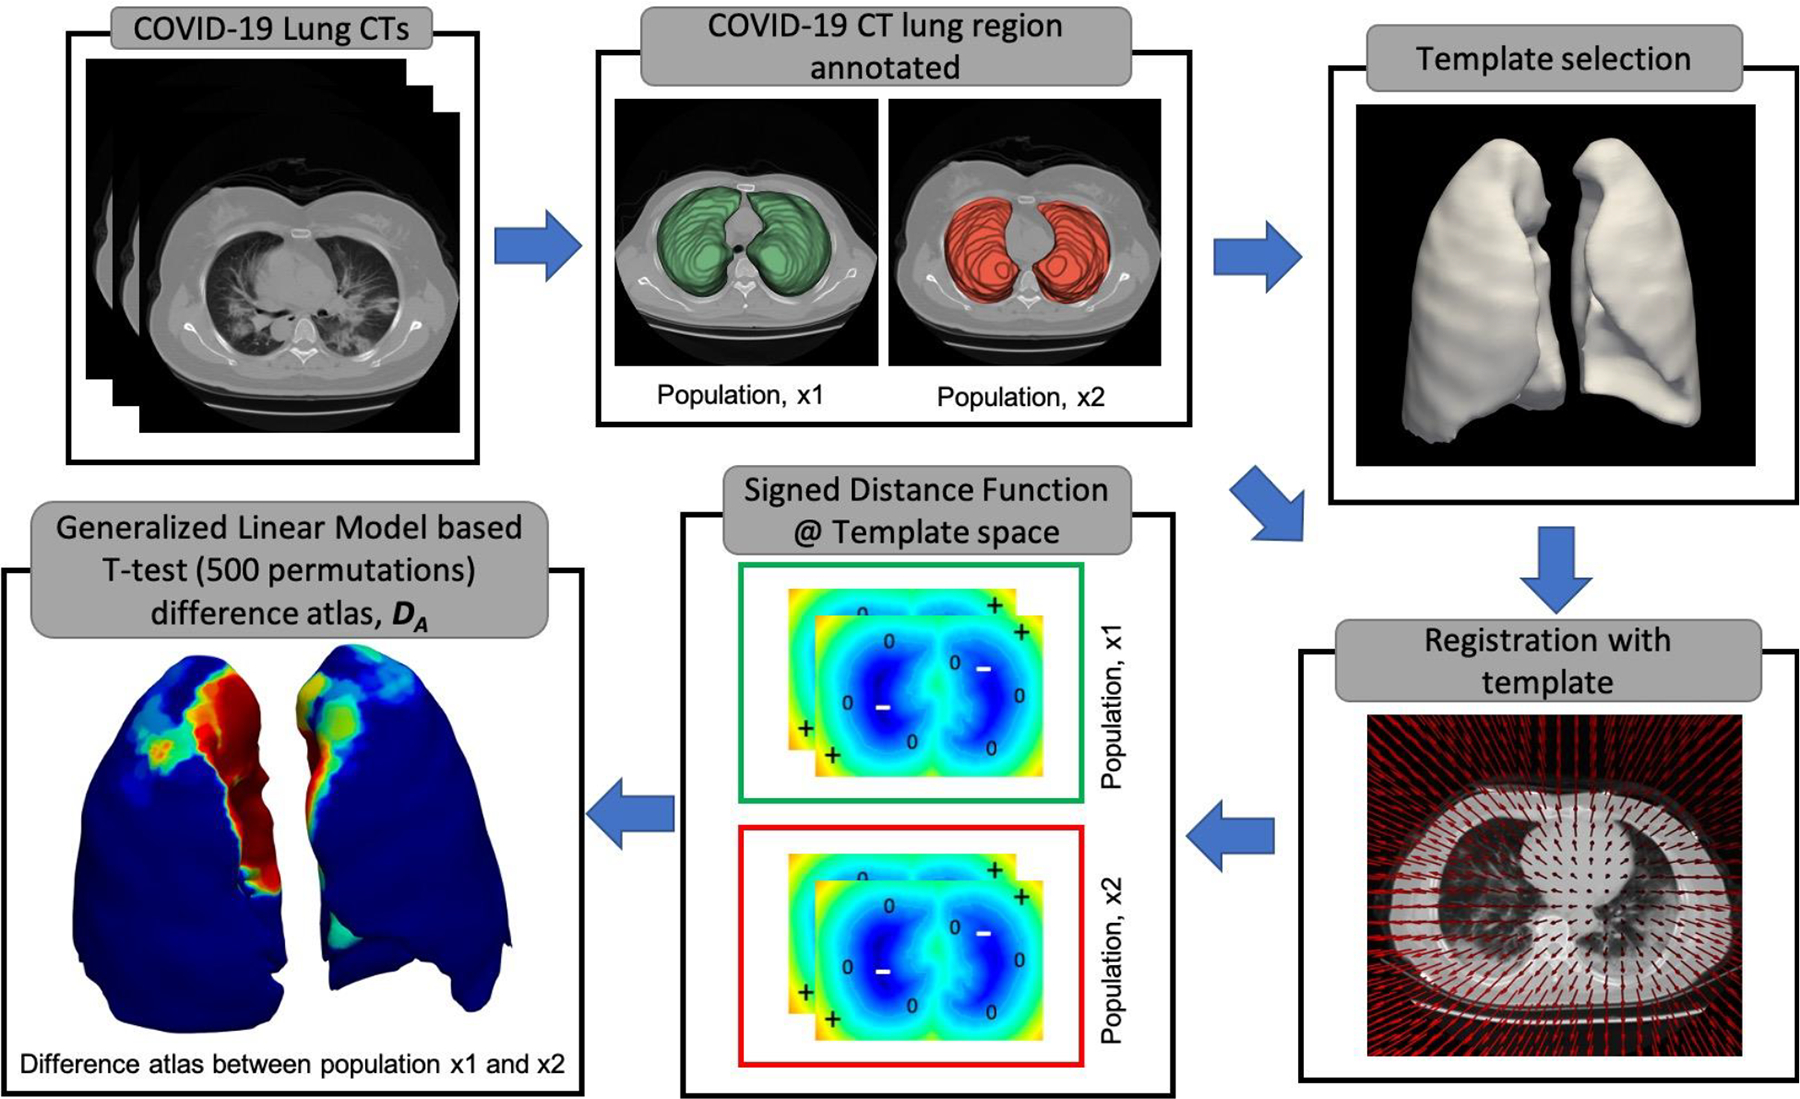
Population-based difference atlas construction identifying statistically significant shape differences between the two populations. At first, the lung regions in the chest CTs are manually annotated and a template is chosen based on the median lung volume of a particular population. As part of the second step, all the CT volumes are registered to the chosen template and corresponding transformations are applied to the lung masks. Subsequently, a signed distance function is calculated on all the lung masks in the template space to represent shape information as a volume. Finally, a difference atlas (DA) is generated using a generalized linear model-based T-test with 500 permutations.
Detailed steps of generating DA are given below;
Step 1: Population splits
COVID-19 CT scans were divided into two populations based on the severity of the disease; For example, patients with mild COVID-19 disease defined as one set of population and patients with severe COVID-19 disease requiring a mechanical ventilator as the other set of population.
Step 2: Template selection
A representative template T was chosen based on median lung volume from patients with milder disease among the two populations. For example, when constructing DA between mild and severe COVID-19 patients, a template is chosen from mild COVID-19 cohort. For, DA between healthy patients healthy and mild COVID-19 patients, template is chosen from the healthy cohort. Similarly, for constructing DA between healthy and severe COVID-19 patients, template is chosen from the healthy cohort.
Step 3: Registration of all CT scans to the template space, T
All CT scans were registered to a common canonical frame of reference, T. A rigid followed by a b-spline deformable co-registration was performed. For rigid registration, mattes mutual information was used as a similarity metric with number of histogram bins set to 32. The similarity metric was optimized using gradient descent, a maximum of 500 iterations per resolution. A linear interpolator was used for rigid registration. Subsequently, to initialize deformable registration manually segmented lung masks were given as inputs to registration framework to provide anatomical constraints and improve registration accuracy. The anatomical constraints would help in making sure that the lung CT was sufficiently registered at the same time not introducing unnatural deformations in the lung. For the deformable registration, standard gradient descent optimizer and normalized correlation coefficient to measure the similarity between fixed and transformed volumes (Ghose et al., 2017) was used. The step size along the search direction for gradient descent was determined as a decaying function of the iteration loop with scalar constant set at 25000 to attain a close fit. A multi-resolution approach with 5 different levels was used with the number of iterations for each resolution set at 2500. Elastix tool v4.9 was used to perform both rigid and deformable registrations in this study (Klein et al., 2010).
Step 4: Volumetric representation of the shape of the lung using signed distance function
All the registered volumes were first isotopically scaled to 2mm3 resolution. A signed distance function (SDF) was applied to the corresponding binary lung masks in the template space. As opposed to a binary representation of a lung mask where each voxel within the lung is represented as 1 and voxels outside the lung are represented as 0, the SDF is defined as;
Where ß represents the boundary of the lung, ß+ represents the voxels inside the boundary and ß− represents the voxels outside the boundary. −d(x1 x2) represents the Euclidean distance between the voxels x1 and x2. Python 3.11 with modules numpy (v1.26.4) and SimpleITK (v2.3.1) was used to apply SDF to volumetric images.
Step 5: Difference atlas (DA) using a non-parametric Generalized Linear Model (GLM) based t-test
As described in a previous study (Ghose et al., 2017), at each voxel location in the template space (T), distributions of voxel values (based on signed distance function) between CT scans of two populations were tested for statistical significance using Generalized Linear Model (GLM) based t-test. The statistical testing was performed with 500 random permutation testing correcting for multiple comparisons (Winkler et al., 2014). Threshold free cluster enhancement (TFCE) method was used to correct for multiple comparisons (Winkler et al., 2014). The categorical variable, patient population (for example mild or severe COVID-19 disease) was considered as an exploratory variable and the signed distance function as a dependent variable for GLM based t-test. A “randomize” function from “fsl” library (Woolrich et al., 2009) was used to perform GLM based t-test. The method provides a test statistic image and sets of p-values. The p-values obtained from the statistical test were further represented as DA.
2.3.2. Ensemble difference atlas (DEA) construction using multiple splits of training data
To make the process of DA construction more robust, populations were into three randomly selected overlapping subsets (~67% of total samples in each subset) and three different DAs were constructed. All the three DAs were further thresholded at p>0.05. Subsequently, an ensemble method with majority voting technique on the thresholded binary masks of DA to create a final ensemble difference atlas (DEA). The supplementary figure, Fig. S1, illustrates the process of generating DEA.
Considering pairs of populations, DEAs were constructed identifying regions of statistically lung shape differences between; a) healthy patients from D5 and mild COVID-19 patients from D1train, b) healthy patients from D5 and severe COVID-19 patients from D1train and c) mild and severe patients from D1train. Additionally, differences in lung volumes and mean intensities within the lung between the populations were also reported using violin plots.
2.4. AI based quantification of lung shape differences
At first, the ensemble difference atlas (DEA) constructed between mild and severe COVID-19 patients was transformed back from template space to the corresponding original image space using the registration approach as used for atlas creation. In this case, the moving image for registration was considered to be the ensemble difference atlas (DEA) while the corresponding input CT scans were considered as fixed images. Previous studies(Eppel, 2018) have shown that using binary mask of regions of interest (ROIs) as an additional channel (priors) along with an image input can help the network focus their attention on the ROIs while still extracting contextual information from the whole image. Similarly, in this study, a 3D CNN (M1) was used to characterize population lung shape differences for COVID-19 prognosis. At first, DEA constructed between mild and severe COVID-19 patients was used as a shape prior SP (Fig. 2). SP was used as an auxiliary channel along with chest CT scans to train M1 (Fig. 2). A 3-fold cross validation of M1 was performed on D1train and ensemble predictions (average predictions) of M1 from 3-fold cross validation was used to evaluate the model’s performance of the test sets D1test, D2, D3 and D4. Three different base CNN architectures 3D-SEResNet-50 (Hu et al., 2019; Kataoka et al., 2020), 3D-DenseNet-121 (Kataoka et al., 2020), 3D-ResNeXt-50 (Kataoka et al., 2020) were tested for evaluating architecture sensitivity. The architecture yielding the best cross-validation area under the receiver operating characteristic curve (AUC) on D1train was chosen as the final base architecture for M1. Data preprocessing and further implementation details of M1 are provided in the supplementary section, S2, S3. PyTorch v2.1.2 python module was used to train all CNNs for AI based quantification of lung shape differences (Paszke et al., 2019).
Figure 2:

Flowchart of CovSafeNet. CovSafeNet consists of two parallel 3D CNNs (M1, M2). While M1 encodes shape differences of the lung between mild and severe COVID-19 patients via a shape prior SP (top row), M2 encodes spatial information of automatically segmented lung infiltrates, IP (bottom row). The decisions from M1 and M2 are fused at the decision fusion node (NF) to obtain the final predictions predicting severity of COVID-19.
2.5. Automated segmentations of lung and lung infiltrates
A 3D U-Net (Isensee et al., 2018) model was used to segment lung and lung infiltrate regions on CT scans. All CT scans were first pre-processed by converting them from Hounsfield units to image intensities by assuming the air in the lungs corresponds to a zero-intensity value. To narrow the field of view to the lung within the chest CTs, intensities greater than −300HU were thresholded and subsequently a bounding box containing the largest connected component was extracted. The cropped region was further resized to 128×192×96 (x, y, z) and was provided as input to a 3D U-Net. PyTorch v2.1.2 python module was used to train all CNNs for 3D segmentations of lung and lung infiltrates.
2.6. CovSafeNet: Integrating lung shape difference biomarker with lung infiltrates
At first, separate 3D U-Net (Isensee et al., 2018) models were used for segmenting lung regions and lung infiltrates on CT. D1train was further divided into sub-cohorts D1train1 (N=367) and D1train2 (N=49) and the 3D U-Net models were trained on D1train1 and evaluated on D1train2 and were subsequently used to automatically segment the lung and lung infiltrate regions of D1test, D2, D3 and D4.
The segmentation maps outputted by the networks were used as infiltrate prior (IP) to evaluate detection performance of the network in detecting the infiltrate regions. A region was considered as being detected if ≥ 0.2 Dice similarity coefficient (DSC) overlap existed between the network segmentation map and the ground-truth delineation of that corresponding region. The segmentation accuracy of the detected regions was reported in terms of DSC on D1train2.
Subsequently, IP was then used as an auxiliary channel along with chest CT scans to train M2 (Fig. 2) to identify COVID-19 patients with severe disease. A 3-fold cross validation of M2 was performed on D1train and ensemble predictions (average predictions) of M2 from 3-fold cross validation was used to evaluate the model’s performance of the test sets D1test, D2, D3 and D4. Three different base CNN architectures 3D-SEResNet-50 (Hu et al., 2019; Kataoka et al., 2020), 3D-DenseNet-121 (Kataoka et al., 2020), 3D-ResNeXt-50 (Kataoka et al., 2020) were tested for architecture sensitivity. The architecture yielding the best cross-validation AUC on D1train was chosen as the final base architecture for M2. Data preprocessing and further implementation details of M2 are provided in the supplementary section, S2, S3.
Subsequently, CovSafeNet (Fig. 2) framework was built based on decision fusion of two different residual classifiers M1 and M2 (average predictions from M1 and M2). While M1 encoded lung structure differences of the lung between mild and severe COVID-19 patients via a shape prior SP (Fig. 2), M2 encoded spatial information of automatically segmented lung infiltrates, IP (Fig. 2). A similar 3-fold cross validation strategy on D1train was used on CovSafeNet and the ensemble predictions (average predictions) of CovSafeNet from 3-fold cross validation was used to evaluate the model’s performance of the test sets D1test, D2, D3 and D4. PyTorch v2.1.2 python module was used to train CovSafeNet (Paszke et al., 2019).
2.7. Comparison of CovSafeNet with clinical and radiomics based machine learning model
Radiomics model, MR
PyRadiomics (van Griethuysen et al., 2017) package was used to extract the radiomic features from regions of lung shape differences and lung infiltrates. Extracted features included first order statistics, 2D and 3D shape base features, Gray Level Cooccurence Matrix (GLCM), Gray Level Run Length Matrix (GLRLM), Gray Level Size Zone Matrix (GLSZM), Gray Level Dependence Matrix (GLDM), Neighboring Gray Tone Difference Matrix (NGTDM). All CT volumes were resampled to 2mm3 isotropic resolution prior to the feature extraction. Two different models MR1 and MR2 were trained on D1train with features extracted from regions of population lung shape differences and lung infiltrates, and subsequently evaluated on the test sets D1test, D2, D3 and D4. The final radiomic classifier MR was based on decision fusion of MR1 and MR2. (addition of predictions from MR1 and MR2). The following steps were involved in training the models MR1 and MR2 at each iteration on every cross-validation fold.
Step 1: Correlated features with a Pearson correlation > 0.9 were removed.
Step 2: Constant features which were repeated for more that 25% of the samples were removed.
Step 3: On the remaining features an outlier removal step was performed, allowing for clipping of the feature values between 1st and 99th percentile and resultant features were normalized in the range [0,1].
Step 4: A Least Absolute Shrinkage and Selection Operator (LASSO) (“Regression Shrinkage and Selection via the Lasso on JSTOR,” n.d.) feature selection strategy was applied to select the most optimal radiomic features.
Step 5: XGBoost classifier was trained based on the features selected based on LASSO feature selection.
Python module scikit-learn v1.3.2 was used to train the radiomics model MR.
Clinical Model, MC
Clinical data was not available for the dataset source D3. Therefore, clinical features common to D1train, D2 and D4 were selected for the analysis. Creatinine (Cr), aspartate aminotransferase (AST), alanine aminotransferase (ALT), neutrophils count (Neu), lymphocytes count (LYM) and procalcitonin (PCT) information was available for D1train, D2 and D4 cohorts. Subsequently, a similar preprocessing and model training strategy used for training the radiomics based classifiers was used to develop the clinical model MC. Python module scikit-learn v1.3.2 was used to train the clinical model MC.
2.8. Statistical analysis
Registration accuracies for atlas construction was evaluated using DSC between binary masks of lung regions of the fixed image (template mask) and moving image (image registered to the template) respectively. Additionally, DSC was also used to evaluate the performance of the automated segmentation of the lung and lung infiltrate regions using a 3D CNN. Detection performance of the lung infiltrate regions was evaluated by sensitivity and positive predictive value.
The outcome of interest in this study for disease severity was invasive mechanical ventilation/death vs. no invasive ventilation support (no respiratory distress, oxygen supplementation, non-invasive ventilation). Mean and standard deviation of AUC was used to indicate the cross-validation performance of all AI models on training set D1train. Further, AUC with 95% confidence intervals (CI) was used to capture performance of all AI models on test sets (D1test, D2, D3 and D4). The DeLong test (DeLong et al., 1988) was used to compare the statistical significance with respect to difference in AUCs between the two models. Optimal cut-off point on receiver operating characteristic curve (ROC) was chosen by maximizing F1 score on the D1train. Furthermore, sensitivity, specificity and F1 score were reported on test sets (D1test, D2, D3 and D4) based off the optimal cut-off point. pROC and cutpointr packages of R statistical software was used to perform the DeLong’s test and calculate optimizal cut-off point respectively.
3. Results
3.1. COVID-19 study population
A total of N=3230 patients acquired from four different sources (D1: N=835, D2: N=113, D3: N=2000, D4: N=282) were used in this study. An additional N=213 patients from the National Lung Screening Trial (NLST) Spiral CT abnormalities dataset (Clark et al., 2013; National Lung Screening Trial Research Team, 2013; National Lung Screening Trial Research Team et al., 2011) marked as “Other minor abnormality noted” were used as a control cohort (D5) for positive COVID-19 patients. Table 1 shows patient demographics. Median age with interquartile ranges among the cohorts D1 and D2 were found to be 59 (47 – 67) and 62 (53 – 72) respectively. Median ages for D3 and D4 could not be evaluated as accurate age information was not available for subjects within the cohorts D3 and D4. All patients from datasets D1-D5 were grouped into three categories based on severity; a) healthy patients (control cohort) with no COVID-19 disease, b) mildly affected COVID-19 patients (patients who did not require a mechanical ventilator), c) severely affected COVID-19 patients (patients who required a mechanical ventilator).
Table 1:
Patient demographics of datasets D1-D3. All the demographic information was available for cohorts D1, D2. Although cohort C had age information, they were specified as ranges. Hence median and interquartile range related statistics could not be calculated. No demographic information was available for dataset D4. μmol : micromoles; U : units; L : liter; ng: nanograms; mL: milliliter.
| Variables | D1 | D2 | D3 |
|---|---|---|---|
| Age Median (IQR) | 59 (47 – 67) | 62 (53 – 72) | - |
| Gender Male (%) | 46.30 | 45.31 | - |
| Laboratory findings Median (IQR) | |||
| Creatinine (Cr)(μmol/L) | 60.0 (50.0 – 72.0) | 99.0 (75.4 – 142.3) | 84.4 (69.0 – 110.9) |
| Aspartate aminotransferase (AST)(U/L) | 24.0 (19.0 – 37.0) | 30.0 (21.0 – 47.0) | 38.0 (26.0 – 61.0) |
| Alanine aminotransferase (ALT)(U/L) | 23.0 (16.0 – 39.0) | 21.0 (15.0 – 33.0) | 30.0 (19.0 – 54.0) |
| Neutrophils count (Neu) (109 L−1) | 3.63 (2.25 – 5.11) | 4.82 (2.75 – 6.17) | 5.3 (3.8 – 7.0) |
| Lymphocytes count (LYM) (109 L−1) | 1.21 (0.88 – 1.68) | 1.05 (0.77 – 1.30) | 0.89 (0.65 – 1.36) |
| Procalcitonin (PCT)(ng/mL) | 0.16 (0.055 – 0.24) | 0.17 (0.08 – 0.54) | 0.17 (0.09 – 0.34) |
The dataset from source D1 was stratified based on the severity, and randomly split into 50% training (D1train: N=416) and 50% testing (D1test: N = 419), while data from the sources D2, D3 and D4 were all used as an external independent test set to test our hypothesis. Supplementary table, Table S2 shows the distribution of mild and severe COVID-19 patients on the training (D1train) and test sets (D1test, D2, D3 and D4).
3.2. Chest CT reveals significant volume and lung shape differences between mild and severe COVID-19 patients
The registration accuracy for atlas creation, DA was observed to be high with a DSC of 0.91±0.08 between the template, T and the registered lung masks. Additionally, the supplementary figure, Fig. S2 depicts deformation fields of deformable registration performed by registering the CT scans to a template volume. One can notice that applying anatomic constraints helps in making sure that no unnatural deformations are introduced during the registration processing. Furthermore, from supplementary figure, Fig. S2, one can notice that the deformation fields are oriented towards the ground lung infiltrates (glass opacities and consolidation regions). Hence, this shows that a COVID-19 patient with severe disease with the existence of more lung infiltrates presents higher deformations as compared to patients with milder COVID-19 disease with little or no lung infiltrates. Statistically significant volume differences were found between healthy, mild and severe patients in D1train (Fig. 3). One can observe that lung volumes decreased with increasing severity of COVID-19 disease (Fig. 3). Similarly, it may also be observed that mean intensity values within the lung on CTs increased with increasing severity (Fig. 3). Additionally, we also conducted the same analysis separately for male patients and female patients and found the similar trends in lung volumes and mean CT intensities (supplementary figure, Fig. S3).
Figure 3:

Differences in lung volumes and mean intensities within in lung as seen on CTs between three different populations a) severe COVID-19 patients (patients who required a mechanical ventilator) from the training set D1train (green), b) mild COVID-19 patients (patients who did not require a mechanical ventilator) from the training set D1train (orange), c) healthy patients (no COVID-19) from D5 (blue). The plot shows that as the severity of COVID-19 disease increases, the lung volume decreases. Similarly, it can be observed that mean lung intensities increases as the severity of COVID-19 disease increases.
Population difference atlases (DA) and subsequently ensemble of population shape difference atlases (DEA) (Fig. 1 shows construction of DA and supplementary figure, Fig. S1 depicts construction of DEA) were constructed between pairs of populations (healthy, mild and severe COVID-19 patients). The DEA between mild and severe COVID-19 patients (Fig. 4) shows that the majority of the lung shape differences were observed at the mediastinal surface of both lungs. Furthermore, it may be observed that lung shape differences between healthy and severe COVID-19 patients (supplementary figure, Fig. S4) was extended to the basal surfaces of both the lungs along with mediastinal surfaces. However, lung shape differences were found only on the mediastinal surfaces for DEA between healthy and mild COVID-19 patients (supplementary figure, Fig. S5). Additionally, when DEA between healthy and mild COVID-19 patients, was compared with DEA between mild and severe COVID-19 patients, one can notice that differences between healthy and mild COVID-19 patients was more significant as compared to further worsening of the disease between mild and severe COVID-19 patients.
Figure 4:

Ensemble difference atlas (DEA) between mild (patients who did not require a mechanical ventilator) and severe (patients who required a mechanical ventilator) COVID-19 patients. Majority of the lung shape differences between V− and V+COVID-19 patients were found at the mediastinal surface of both lungs (Blue: No statistically significant shape difference between the populations. Red: Regions with statistically significant shape difference between the populations).
3.3. AI based quantification of lung shape differences associated with severity of COVID-19
A 3D CNN (M1: Fig. 2) was used to quantify the lung shape differences for predicting COVID-19 severity (distinguishing between mild and severe COVID-19 patients). Two channels were given as input to M1 (Fig. 2) with first being the lung CT volume and the second being a binary mask of regions with lung shape differences. The base architecture for M1 was chosen based on 3-fold cross-validation performance (AUC=0.810±0.045) on D1train (supplementary table, Table S3). M1 resulted in AUC of 0.850; 95% CI [0.814, 0.888], 0.714; 95% CI [0.612, 0.816], 0.709; 95% CI [0.681, 0.738] and 0.610; 95% CI [0.542, 0.678] on D1test, D2, D3 and D4 respectively. Additionally, M1 yielded AUC=0.655; 95% CI [0.633, 0.678] when evaluated on the combined dataset (D1test, D2, D3, D4).
Fig. 5 (top 2 rows) shows Gradient-weighted Class Activation Maps(Selvaraju et al., 2020) (Grad-CAM) interpretability results for M1. These activation maps depict that CNN is focus its attention on regions with significant lung shape differences during the classification phase.
Figure 5:

Grad-CAM interpretability results with binary masks, SP and IP encoded into M1 (1a-1h) and M2 (2a-2h) respectively as auxiliary channels to the network. These maps show that these auxiliary channels can aid the network in setting an attention region helping the network to focus on these regions, while at the same time, providing the context of the whole lung region. Blue regions indicate areas contributing to predictions as mild COVID-19 disease while red regions indicate areas contributing to severe COVID-19 disease. The color bar gradient corresponds to the strength of the contribution.
3.4. CovSafeNet: A novel framework integrating biomarkers of lung shape differences and lung infiltrates for COVID-19 prognosis
A 3D CNN architecture (M2: Fig. 2) was used for characterization of lung infiltrates. Details of lung infiltrates segmentation and segmentation results are presented in the supplementary section, S4. The supplementary figure, Fig. S6 shows some exemplar segmentations of lung and lung infiltrate regions. M2 resulted in a 3-fold cross validation AUC=0.815±0.005 on D1train (supplementary table, Table S3). Furthermore, M2 resulted in AUC of 0.867; 95% CI [0.833, 0.901], 0.770; 95% CI [0.667, 0.873], 0.697; 95% CI [0.666, 0.728] and 0.650; 95% CI [0.579, 0.723] on D1test, D2, D3 and D4 respectively. Additionally, M2 yielded AUC=0.680; 95% CI [0.658, 0.702] when evaluated on the combined test set (D1test, D2, D3, D4).
Gradient-weighted Class Activation Maps (Selvaraju et al., 2020) (Grad-CAM) (Fig. 5) results for M2 are presented in Fig. 5 (bottom two rows). Similar to M1, one can notice that the auxiliary channel can aid the network in focusing on regions of interest (here lung infiltrates) to make its final decisions. Additionally, from Fig.5 one may observe that M2 successfully classified a patient as having mild or severe COVID-19 even though lung infiltrates had similar appearance. For instance, from Fig. 5, mild COVID-19 patients (2a,2b) and severe COVID-19 patients (2e,2f) had similar appearance and size (smaller lung infiltrates), and M2 correctly identified the severity of the patients’ disease. Similarly, although mild COVID-19 patients (2c,2d) and severe COVID-19 patients (2g,2f) have similar appearance and sizes (larger lung infiltrates), M2 correctly identified them as mild versus severe COVID-19 patients.
Subsequently, CovSafeNet (Fig. 2) was constructed based on decision fusion of M1 and M2. CovSafeNet resulted in an improved performance over M1 and M2, yielding a 3-fold cross validation AUC of 0.838±0.015 on D1train. Similarly, from Table 2, it may be observed that CovSafeNet significantly outperforms M1 and M2 resulting in an AUC of 0.693; 95% confidence interval (CI) [0.671,0.716] on combined test set (D1test, D2, D3, D4).
Table 2.
Test set performance (AUC with 95% confidence intervals (CI)) of M1, M2 and CovSafeNet on D1test, D2, D3 and D4 datasets. The performance of CovSafeNet was compared with models M1 and M2 using DeLong’s test.
| Model AUC (95% CI) | D1test N=419 | D2 N=113 | D3 N=2000 | D4 N=282 | Combined N=2814 | |
|---|---|---|---|---|---|---|
| M1 | 0.850 (0.814, 0.888) | 0.714 (0.612, 0.816) | 0.709 (0.681, 0.738) | 0.610 (0.542, 0.678) | 0.655 (0.633, 0.678) | |
| M2 | 0.867 (0.833, 0.901) | 0.770 (0.667, 0.873) | 0.697 (0.666, 0.728) | 0.650 (0.579, 0.723) | 0.680 (0.658, 0.702) | |
| CovSafeNet | 0.890* (0.860, 0.921) | 0.769 (0.667, 0.870) | 0.732 (0.704, 0.761) | 0.654 (0.583, 0.724) | 0.693* (0.671, 0.716) | |
| DeLong’s Test with M1 | p=0.0342 | p= 0.9877 | p<0.0001 | p=0.812 | p=0.0123 | |
| DeLong’s Test with M2 | p=0.0001 | p=0.0589 | p=0.0548 | p=0.0558 | p<0.0001 |
indicates statistically significant improvement as indicated by DeLong’s test.
CovSafeNet’s performance evaluated on individual cohorts D1test, D2, D3 and D4 was found to be 0.890; 95% CI [0.860,1.921], 0.769; 95% CI [0.667, 0.870], 0.732; 95% CI [0.704,0.761] and 0.654; 95% CI [0.583, 0.724] respectively. CovSafeNet resulted in statistically significant improvement over M1 and M2 on D1test (AUC = 0.890; 95% CI [0.860,0.921]). However, similar statistically significant improvement was not found between M1 and M2 on cohorts D3 and D4 (Table 2). Also, on D2, CovSafeNet performed similar to M2 yielding an AUC=0.769; 95% CI [0.667,0.870]. Furthermore, other performance metrics such as sensitivity, specificity and F1 score are presented in the supplementary table, Table S4. CovSafeNet resulted in a sensitivity, specificity and F1 score of 86%, 36% and 51% respectively on the combined test set (D1test, D2, D3, D4).
3.5. Comparison of CovSafeNet with clinical and radiomics based machine learning model
Radiomics and clinical machine learning classifiers MR and MC were trained with radiomic and clinical features respectively. Clinical features were not available for cohort D3. Therefore, comparisons of MR and MC with CovSafeNet were only made with D1test, D2, and D4. Among the clinical features, aspartate aminotransferase (AST), neutrophils count (Neu), lymphocytes count (LYM) were selected as the most prominent clinical features. From Table 3 one can notice that CovSafeNet with an AUC=0.688 95% CI [0.653,0.724] significantly outperforms both MR (AUC= 0.651; 95% CI [0.614, 0.689]) and MC (AUC=0.607; 95% CI [0.568, 0.646]) on the combined cohorts D1test, D2, and D4. Additionally, the combination CovSafeNet with the clinical model (MC) by pooling the decisions (average of decisions from CovSafeNet and MC) yielded AUC=0.685; 95% CI [0.649, 0.721] with no statistically significant difference (p=0.6694) found compared to the performance of the CovSafeNet model. Additionally, by performing a multivariable analysis (Supplementary table, Table S5) we also show that CovSafeNet was independently associated with other clinical variables (age, Cr, AST, ALT, LYM, Neu, PCM).
Table 3.
Test set performance (AUC with 95% confidence intervals (CI)) of the radiomics based machine model (MR), and clinical based machine learning model (MC) and CovSafeNet on D1test, D2, D3 and D4 datasets. The performance of CovSafeNet was compared with models MR and MC using DeLong’s test.
| Model AUC (95% CI) | D1test N=419 | D2 N=113 | D3 N=2000 | D4 N=282 | Combined (D1test, D2, D3 D4) N=2814 | Combined (D1test, D2, D4) N = 814 | |
|---|---|---|---|---|---|---|---|
| Radiomics, MR | 0.893 (0.856, 0.931) | 0.641 (0.523, 0.752) | 0.723 (0.692, 0.742) | 0.579 (0.514, 0.648) | 0.662 (0.631, 0.684) | 0.674 (0.631, 0.703) | |
| Clinical, MC | 0.686 (0.638, 0.726) | 0.668 (0.549, 0.781) | - | 0.664 (0.599, 0.732) | - | 0.602 (0.568, 0.651) | |
| CovSafeNet | 0.890 (0.860, 0.921) | 0.769 (0.667, 0.870) | 0.732 (0.704, 0.761) | 0.654 (0.583, 0.724) | 0.693* (0.671, 0.716) | 0.688* (0.653, 0.724) | |
| DeLong’s Test with MR | (p=0.6028) | (p=0.0485) | (p=0.4116) | (p=0.0323) | (p<0.0001) | (p<0.0001) | |
| DeLong’s Test with clinical model MC | (p<0.0001) | (p=0.0925) | - | (p=0.6321) | - | (p<0.0001) |
indicates statistically significant improvement as indicated by DeLong’s test.
3.6. Ablation studies
3.6.1. Sensitivity of template selection to construct difference atlas
To understand the effect of template selection on quantification of lung shape differences, we constructed DEA using a randomly selected template (Tr), instead of template T chosen based off median lung volume. AI based quantification of lung shape differences using Tr as template was then compared to the quantification using T as the template. The resulting M1 trained using Tr as the template yielded an AUC of 0.847, 0.728, 0.689 and 0.569 on D1test, D2, D3 and D4 respectively. DeLong’s test indicated no significant differences (p>0.12) on D1test, D2, D3, except for D4 (p=0.0350).
3.6.2. 3D-CNN without shape and infiltrate priors
To evaluate the significance of shape prior (SP) or infiltrate prior (IP) provided to CNNs as an auxiliary channel, we trained a 3D-CNN with only chest CT volumes as the only input channel (without SP and IP). The 3D-CNN trained without SP and IP resulted in an AUC=0.792; 95% CI [0.77–0.82], AUC=0.645; 95% CI [0.60– 0.68], AUC=0.660; 95% CI[0.62– 0.69] and AUC=0.589; 95% CI[0.53– 0.63] on D1test, D2, D3 and D4 respectively. With respect to DeLong’s test, CovSafeNet (with SP and IP) performed significantly better than a 3D-CNN trained without SP and IP as auxiliary channels (p<0.0331).
3.6.3. Comparison of CovSafeNet architecture with vision transformers
We further compared the best 3D-CNN architecture (3D-Densenet-121) with 3D vision transformers (Dosovitskiy et al., 2021) (implementation from MONAI opensource package (Consortium, 2020)). The CovSafeNet with 3D vision transformers architecture achieved an AUC=0.697 on the combined test set (D1test, D2, D3 and D4) showing no significant difference from the 3D-Densenet-121 architecture (p=0.4321).
4. Discussion
While a number of previous studies have developed and applied artificial intelligence (AI) predictors for COVID-19 diagnosis and prognosis (Hiremath et al., 2021; Lee et al., 2021), there has not been, to our knowledge, a rigorous, comprehensive, and quantitative assessment of lung shape and deformation on account of COVID-19 and COVID-19 severity. Understand and predicting lung deformation and changes in lung shape could have long term implications for lung function. For instance, a study by Osanlouy et al. (Osanlouy et al., 2020, pp. 20–90) depicted that changes in lung shape could in turn affect lung function by causing aging. In this work AI based approaches were combined with statistical shape modeling based atlas approaches to (1) quantitatively capture lung morphological changes on account of COVID-19, (2) relate the changes in the shape and volume of the lung with severity of the disease and (3) combine deep learning with atlas based approaches to create integrated predictors of lung shape and lung infiltrates for COVID-19 severity prediction.
Previous studies (Luger et al., 2022) have shown that severe COVID-19 disease can have long-term sequelae such as subpleural reticulation and ground-glass opacities. Additionally, recent studies have also shown the mechanical deformations are introduced in the lungs due to severity of COVID-19 disease (Dimbath et al., 2021; Tonelli et al., 2021). Furthermore, extensive and persistent lung damage was also observed in a study with postmortem samples of 41 patients (Bussani et al., 2020) in patients with severe COVID-19 disease. These findings can be explained by the intense disruption of the normal lung parenchyma and interstitium with subsequent fibrosis. These damages caused to the lung may even lead to permanent loss of lung function (Wu et al., 2020). However, as previously mentioned, a quantitative assessment of the nature, extent and precise location of the COVID-19 induced lung deformation and associated damage has not been previously attempted.
Previous studies have developed various population-atlas based models to quantify shape differences of different organs on imaging and have illustrated their association with severity of various diseases (Asaeikheybari et al., 2021; Ghose et al., 2017; Ismail et al., 2022). To our knowledge, this is the first study to explore the association of COVID-19 severity with population lung shape differences. With pulmonary fibrosis proven as a long term sequelae of COVID-19 (McGroder et al., 2021), there are several possible factors such as reticulations, traction bronchiectasis or honeycombing which might be associated with changes in lung shape and morphology. Additionally, a previous study also indicated increased pulmonary arterial medial wall thickness among patients who died from COVID-19 pneumonia (“Potential long-term effects of SARS-CoV-2 infection on the pulmonary vasculature: a global perspective | Nature Reviews Cardiology,” n.d.). A related previous study by Lin et al. (Lin et al., 2021) has showed that micro-alveolar ruptures were associated with COVID-19 disease. These data appear to suggest that micro-alveolar ruptures in the mediastinal surfaces of the lung could lead to preferential pleural defects affecting lung shape and morphology. However, these studies (Lin et al., 2021; McGroder et al., 2021; “Potential long-term effects of SARS-CoV-2 infection on the pulmonary vasculature: a global perspective | Nature Reviews Cardiology,” n.d.) have been mostly qualitative in nature. Our study represents the largest one to date in the use of AI and statistical atlas modeling for quantitative assessment of disease severity as also lung shape related changes using chest CT scans on account COVID-19.
The new study presented in this work revealed that majority of lung shape related differences between mild and severe COVID-19 patients were found at the mediastinal surfaces of both lungs. Furthermore, when lung shape differences were evaluated between a healthy control cohort and severely affected COVID-19 patients, lung shape differences were found to extend to basal surfaces (supplementary figure, Fig. S5) as also mediastinal surfaces. This can be explained due to the fact that bilateral lower lobes are more commonly involved with high occurrence of lung infiltrates in severe COVID-19 patients (“Time Course of Lung Changes at Chest CT during Recovery from Coronavirus Disease 2019 (COVID-19) - Google Search,” n.d.). Additionally, it was also noted that initial shape differences (between control and mild COVID-19 patients) were more prominent compared to further worsening of the disease (between mild COVID-19 patients and severe COVID-19 patients). Therefore, early characterization of these physiological based changes can portend the possible long-term sequela of COVID-19 disease and help in better prognosis of COVID-19 patients.
Recently, a few previous studies have developed artificial intelligence (AI) based prognostic models to predict the severity of COVID-19 disease using convolutional neural networks (CNNs) (Meng et al., 2020) and radiomics based approaches (Chen et al., 2021). Furthermore, some of the previous approaches have even integrated CT based biomarkers with clinical and biological variables such as prothrombin time, albumin, age, sex, neutrophil counts etc (Hiremath et al., 2021; Lassau et al., 2021; Vaidya et al., 2021). However, most of these studies have focused only on target regions of interest (ROIs) in lung parenchyma such as lung infiltrates (ground-glass opacities (GGOs) and consolidation regions) for characterizing severity of COVID-19 disease. The unique aspect of this study involved combining statistical population shape difference atlas models with deep learning for COVID-19 prognosis prediction. Additionally, the study was unique in the employment of novel combination of deep learning derived features from both lung shape differences as well as lung infiltrates. Furthermore, the study presented in this work represents the largest multi-institutional study (Lassau et al., 2021; Wang et al., 2021, p. 19) involving application of AI for COVID-19 severity estimation with N=3230 patients from multiple sites. The presented framework, CovSafeNet yielded an AUC=0.89 on D1test, a center on which the model was trained and AUC in the range of 0.66 – 0.77 on external test sets from other institutions. The study also demonstrated that the combined population-atlas and deep learning approach outperformed radiomics (MR) and clinical based (MC) machine learning models. Additionally, combining MC with CovSafeNet resulted in a similar performance (AUC=0.685) as CovSafeNet with no statistically significant difference (p=0.6694). Although the study of post-acute sequelae of SARS CoV-2 (PASC), or “long COVID”, was beyond the scope of the study, the findings from our experiment also holds relevance for this long term complication of COVID-19 disease in light of its rising incidence and major healthcare consequences (Xie et al., 2021). Studies have implicated fibrosis as the inciting factor for lung disease in PASC, contributing to the long-term mortality. These findings support the results from our study (“SARS-CoV-2 infection produces chronic pulmonary epithelial and immune cell dysfunction with fibrosis in mice | Science Translational Medicine,” n.d.).
We acknowledge that our study did have its limitations. No improvement in CovSafeNet’s performance by integrating other clinical features may be attributed to the fact that many of the other important clinical factors such as lactate dehydrogenase (LDH), prothrombin time (PT), albumin (ALB) etc as indicated in the some of the previous studies (Hiremath et al., 2021; Vaidya et al., 2021) were not available across all the datasets (D1test, D2, and D4). Access to these additional clinical factors can further enhance the performance of CovSafeNet by providing valuable clinical information along with imaging biomarkers. Additionally, the drop in the performance of CovSafeNet on external test sets (D2, D3 and D4) as compared to the test set AV might be attributed to the fact that CT characteristics (mean intensities within the lung region) of mild COVID-19 patients from D2, D3 and D4 which were found to be statistically different from D1test (Supplementary Fig. S7). Additionally, transfer learning techiniques such as fine-tuning or domain specific batch normalization(Liu et al., 2020) of CovSafeNet over a small subset of data from each of these independent test cohorts may also help in capturing distribution and CT characteristics across different institutions, and hence will be explored as part of future work. Additionally, this study mainly focuses on identifying the regions in CT scans with significant shape differences between mild and severe COVID-19 patients and further use the texture and intensity information from those regions via 3D CNN to predict severity of COVID-19 disease. However, characterizing the shape of the lung directly via shape features such as analyzing surface normals and curvature will be considered part of future work. Also, our study was retrospective in nature and to ensure the clinical practicality of CovSafeNet, the tool needs to be validated prospectively by following patients until discharge.
In conclusion, we demonstrated that there are significant differences in lung shape and morphology between COVID-19 patients with mild and severe disease. Further, we showed that AI based quantification of these lung shape differences can help in COVID-19 prognosis. Additionally, integrating these biomarkers with lung infiltrate-based biomarkers through a novel AI framework, we illustrated that COVID-19 prognosis can further be improved. Furthermore, we also showed that CovSafeNet was able to outperform other state-of-the-art approaches including radiomics and clinical based machine learning models. Lastly, fibrosis, as implied in this study is also the main pathophysiology behind PASC. Therefore, future studies would entail exploring the role of lung shape differences among COVID-19 patients as a biomarker in the context of long COVID.
Supplementary Material
Highlights.
Lung volumes decrease with COVID-19 severity.
Lung shape differences at mediastinal surfaces observed based on COVID-19 severity.
New lung deformation-based imaging biomarker predicts COVID-19 severity.
Combining lung deformation and lung infiltrate biomarkers; better predict COVID-19 severity.
Acknowledgements
This work is made possible by the National Cancer Institute under award numbers R01CA249992-01A1, R01CA202752-01A1, R01CA208236-01A1, R01CA216579-01A1, R01CA220581-01A1, R01CA257612-01A1, 1U01CA239055-01, 1U01CA248226-01, 1U54CA254566-01, National Heart, Lung and Blood Institute 1R01HL15127701A1, R01HL15807101A1, National Institute of Biomedical Imaging and Bioengineering 1R43EB028736-01, National Center for Research Resources under award number 1 C06 RR12463-01, VA Merit Review Award IBX004121A from the United States Department of Veterans Affairs Biomedical Laboratory Research and Development Service, the Office of the Assistant Secretary of Defense for Health Affairs, through the Breast Cancer Research Program (W81XWH-19-1-0668), the Prostate Cancer Research Program (W81XWH-15-1-0558, W81XWH-20-1-0851), the Lung Cancer Research Program (W81XWH-18-1-0440, W81XWH-20-1-0595), the Peer Reviewed Cancer Research Program (W81XWH-18-1-0404, W81XWH-21-1-0345), the Kidney Precision Medicine Project (KPMP) Glue Grant, and sponsored research agreements from Bristol Myers-Squibb, Boehringer-Ingelheim, Eli-Lilly and Astrazeneca.
Declaration of interests
Anant Madabhushi reports financial support was provided by National Cancer Institute. Anant Madabhushi reports financial support was provided by Aiforia Inc. Anant Madabhushi reports financial support was provided by National Institute of Biomedical Imaging and Bioengineering. Anant Madabhushi reports financial support was provided by National Center for Research Resources. Anant Madabhushi reports financial support was provided by VA Merit Review Award. Anant Madabhushi reports financial support was provided by Breast Cancer Research Program. Anant Madabhushi reports financial support was provided by Prostate Cancer Research Program. Anant Madabhushi reports financial support was provided by Lung Cancer Research Program. Anant Madabhushi reports financial support was provided by Peer Reviewed Cancer Research Program. Anant Madabhushi reports financial support was provided by Kidney Precision Medicine Project. Anant Madabhushi reports financial support was provided by Glue Grant. Anant Madabhushi reports financial support was provided by Bristol Myers-Squibb. Anant Madabhushi reports financial support was provided by Boehringer-Ingelheim. Anant Madabhushi reports financial support was provided by Eli-Lilly. Anant Madabhushi reports financial support was provided by AstraZeneca. Anant Madabhushi reports a relationship with Picture Health that includes: board membership.
Abbreviations
- COVID-19
Coronavirus disease of 2019
- CT
Computed Tomography
- AI
Artificial Intelligence
- ARDS
Acute respiratory distress syndrome
- RT-PCR
Reverse transcription polymerase chain reaction
- NLST
National Lung Screening Trial
- CNN
convolutional neural network
- SDF
Signed distance function
- AUC
Area under the receiver operating characteristic curve
- DSC
Dice similarity coefficient
- GLCM
Gray Level Cooccurence Matrix
- GLRLM
Gray Level Run Length Matrix
- GLSZM
Gray Level Size Zone Matrix
- GLDM
Gray Level Dependence Matrix
- NGTDM
Neighboring Gray Tone Difference Matrix
- LASSO
Least Absolute Shrinkage and Selection Operator
- ROC
receiver operating characteristic curve
Footnotes
Publisher's Disclaimer: This is a PDF file of an unedited manuscript that has been accepted for publication. As a service to our customers we are providing this early version of the manuscript. The manuscript will undergo copyediting, typesetting, and review of the resulting proof before it is published in its final form. Please note that during the production process errors may be discovered which could affect the content, and all legal disclaimers that apply to the journal pertain.
References
- A.l. A, S. AH, S.s. VC, 2021. COVID-19 diagnosis and severity detection from CT-images using transfer learning and back propagation neural network. Journal of Infection and Public Health, Special Issue on COVID-19 – Vaccine, Variants and New Waves 14, 1435–1445. 10.1016/j.jiph.2021.07.015 [DOI] [PMC free article] [PubMed] [Google Scholar]
- Asaeikheybari G, Hiremath A, Shiradkar R, El-harasis M, Shoemaker MB, Barnard J, Gupta A, Chung MK, Madabhushi A, 2021. Abstract 14084: Computationally Identified Shape Differences In The Left Atrium On Pre-ablation Ct Scans Appear To Be Associated With Recurrence Of Atrial Fibrillation. Circulation 144, A14084–A14084. 10.1161/circ.144.suppl_1.14084 [DOI] [Google Scholar]
- Ashburner J, Hutton C, Frackowiak R, Johnsrude I, Price C, Friston K, 1998. Identifying global anatomical differences: Deformation-based morphometry. Human Brain Mapping 6, 348–357. [DOI] [PMC free article] [PubMed] [Google Scholar]
- Bussani R, Schneider E, Zentilin L, Collesi C, Ali H, Braga L, Volpe MC, Colliva A, Zanconati F, Berlot G, Silvestri F, Zacchigna S, Giacca M, 2020. Persistence of viral RNA, pneumocyte syncytia and thrombosis are hallmarks of advanced COVID-19 pathology. eBioMedicine 61. 10.1016/j.ebiom.2020.103104 [DOI] [PMC free article] [PubMed] [Google Scholar]
- Cardobi N, Benetti G, Cardano G, Arena C, Micheletto C, Cavedon C, Montemezzi S, 2021. CT radiomic models to distinguish COVID-19 pneumonia from other interstitial pneumonias. Radiol Med 126, 1037–1043. 10.1007/s11547-021-01370-8 [DOI] [PMC free article] [PubMed] [Google Scholar]
- Chamberlin JH, Aquino G, Schoepf UJ, Nance S, Godoy F, Carson L, Giovagnoli VM, Gill CE, McGill LJ, O’Doherty J, Emrich T, Burt JR, Baruah D, Varga-Szemes A, Kabakus IM, 2022. An Interpretable Chest CT Deep Learning Algorithm for Quantification of COVID-19 Lung Disease and Prediction of Inpatient Morbidity and Mortality. Academic Radiology. 10.1016/j.acra.2022.03.023 [DOI] [PMC free article] [PubMed] [Google Scholar]
- Chen H, Zeng M, Wang X, Su L, Xia Y, Yang Q, Liu D, 2021. A CT-based radiomics nomogram for predicting prognosis of coronavirus disease 2019 (COVID-19) radiomics nomogram predicting COVID-19. Br J Radiol 94, 20200634. 10.1259/bjr.20200634 [DOI] [PMC free article] [PubMed] [Google Scholar]
- Clark K, Vendt B, Smith K, Freymann J, Kirby J, Koppel P, Moore S, Phillips S, Maffitt D, Pringle M, Tarbox L, Prior F, 2013. The Cancer Imaging Archive (TCIA): Maintaining and Operating a Public Information Repository. J Digit Imaging 26, 1045–1057. 10.1007/s10278-013-9622-7 [DOI] [PMC free article] [PubMed] [Google Scholar]
- Consortium, T.M., 2020. Project MONAI. 10.5281/zenodo.4323059 [DOI]
- DeLong ER, DeLong DM, Clarke-Pearson DL, 1988. Comparing the areas under two or more correlated receiver operating characteristic curves: a nonparametric approach. Biometrics 44, 837–845. [PubMed] [Google Scholar]
- Dimbath E, Maddipati V, Stahl J, Sewell K, Domire Z, George S, Vahdati A, 2021. Implications of microscale lung damage for COVID-19 pulmonary ventilation dynamics: A narrative review. Life Sci 274, 119341. 10.1016/j.lfs.2021.119341 [DOI] [PMC free article] [PubMed] [Google Scholar]
- Dosovitskiy A, Beyer L, Kolesnikov A, Weissenborn D, Zhai X, Unterthiner T, Dehghani M, Minderer M, Heigold G, Gelly S, Uszkoreit J, Houlsby N, 2021. An Image is Worth 16×16 Words: Transformers for Image Recognition at Scale. 10.48550/arXiv.2010.11929 [DOI]
- Eppel S, 2018. Classifying a specific image region using convolutional nets with an ROI mask as input.
- Fedorov A, Beichel R, Kalpathy-Cramer J, Finet J, Fillion-Robin J-C, Pujol S, Bauer C, Jennings D, Fennessy F, Sonka M, Buatti J, Aylward S, Miller JV, Pieper S, Kikinis R, 2012. 3D Slicer as an image computing platform for the Quantitative Imaging Network. Magn Reson Imaging 30, 1323–1341. 10.1016/j.mri.2012.05.001 [DOI] [PMC free article] [PubMed] [Google Scholar]
- Ghose S, Shiradkar R, Rusu M, Mitra J, Thawani R, Feldman M, Gupta AC, Purysko AS, Ponsky L, Madabhushi A, 2017. Prostate shapes on pre-treatment MRI between prostate cancer patients who do and do not undergo biochemical recurrence are different: Preliminary Findings. Sci Rep 7, 15829. 10.1038/s41598-017-13443-8 [DOI] [PMC free article] [PubMed] [Google Scholar]
- Hiremath A, Bera K, Yuan L, Vaidya P, Alilou M, Furin J, Armitage K, Gilkeson R, Ji M, Fu P, Gupta A, Lu C, Madabhushi A, 2021. Integrated Clinical and CT Based Artificial Intelligence Nomogram for Predicting Severity and Need for Ventilator Support in COVID-19 Patients: A Multi-Site Study. IEEE J Biomed Health Inform 25, 4110–4118. 10.1109/JBHI.2021.3103389 [DOI] [PMC free article] [PubMed] [Google Scholar]
- Hu J, Shen L, Albanie S, Sun G, Wu E, 2019. Squeeze-and-Excitation Networks. arXiv:1709.01507 [cs]. [DOI] [PubMed] [Google Scholar]
- Isensee F, Kickingereder P, Wick W, Bendszus M, Maier-Hein KH, 2018. Brain Tumor Segmentation and Radiomics Survival Prediction: Contribution to the BRATS 2017 Challenge. arXiv:1802.10508 [cs]. [Google Scholar]
- Ismail M, Prasanna P, Bera K, Statsevych V, Virginia h, Singh G, Partovi S, Beig N, McGarry S, LaViolette PS, Ahluwalia M, Madabhushi A, Tiwari P, 2022. Radiomic Deformation and Textural Heterogeneity (R-DepTH) Descriptor to characterize Tumor Field Effect: Application to Survival Prediction in Glioblastoma. IEEE Trans Med Imaging. [DOI] [PMC free article] [PubMed] [Google Scholar]
- Jain VK, Iyengar KP, Ish P, 2021. Elucidating causes of COVID-19 infection and related deaths after vaccination. Diabetes Metab Syndr 15, 102212. 10.1016/j.dsx.2021.102212 [DOI] [PMC free article] [PubMed] [Google Scholar]
- Kanne JP, 2020. Chest CT Findings in 2019 Novel Coronavirus (2019-nCoV) Infections from Wuhan, China: Key Points for the Radiologist. Radiology 295, 16–17. 10.1148/radiol.2020200241 [DOI] [PMC free article] [PubMed] [Google Scholar]
- Kataoka H, Wakamiya T, Hara K, Satoh Y, 2020. Would Mega-scale Datasets Further Enhance Spatiotemporal 3D CNNs? arXiv:2004.04968 [cs]. [Google Scholar]
- Kingma DP, Ba J, 2014. Adam: A Method for Stochastic Optimization. arXiv:1412.6980 [cs].
- Klein S, Staring M, Murphy K, Viergever MA, Pluim JPW, 2010. elastix: a toolbox for intensity-based medical image registration. IEEE Trans Med Imaging 29, 196–205. 10.1109/TMI.2009.2035616 [DOI] [PubMed] [Google Scholar]
- Lassau N, Ammari S, Chouzenoux E, Gortais H, Herent P, Devilder M, Soliman S, Meyrignac O, Talabard M-P, Lamarque J-P, Dubois R, Loiseau N, Trichelair P, Bendjebbar E, Garcia G, Balleyguier C, Merad M, Stoclin A, Jegou S, Griscelli F, Tetelboum N, Li Y, Verma S, Terris M, Dardouri T, Gupta K, Neacsu A, Chemouni F, Sefta M, Jehanno P, Bousaid I, Boursin Y, Planchet E, Azoulay M, Dachary J, Brulport F, Gonzalez A, Dehaene O, Schiratti J-B, Schutte K, Pesquet J-C, Talbot H, Pronier E, Wainrib G, Clozel T, Barlesi F, Bellin M-F, Blum MGB, 2021. Integrating deep learning CT-scan model, biological and clinical variables to predict severity of COVID-19 patients. Nat Commun 12, 634. 10.1038/s41467-020-20657-4 [DOI] [PMC free article] [PubMed] [Google Scholar]
- Lee EH, Zheng J, Colak E, Mohammadzadeh M, Houshmand G, Bevins N, Kitamura F, Altinmakas E, Reis EP, Kim J-K, Klochko C, Han M, Moradian S, Mohammadzadeh A, Sharifian H, Hashemi H, Firouznia K, Ghanaati H, Gity M, Doğan H, Salehinejad H, Alves H, Seekins J, Abdala N, Atasoy Ç, Pouraliakbar H, Maleki M, Wong SS, Yeom KW, 2021. Deep COVID DeteCT: an international experience on COVID-19 lung detection and prognosis using chest CT. NPJ Digit Med 4, 11. 10.1038/s41746-020-00369-1 [DOI] [PMC free article] [PubMed] [Google Scholar]
- Lin KP, Stefaniak C, Bunch CM, March R, Zamlut M, Raza S, Osorio W, Korzan J, Show J, Mjaess N, Patel S, Zackariya S, Sualeh A, Wiarda G, Al-Fadhl H, Thomas AV, Khan RZ, Gillespie L, Walsh MM, 2021. Tension pneumomediastinum and diffuse subcutaneous emphysema with severe acute respiratory syndrome coronavirus 2 infection requiring operative management for impending airway collapse: A case report. Clin Case Rep 9, e04656. 10.1002/ccr3.4656 [DOI] [PMC free article] [PubMed] [Google Scholar]
- Liu Q, Dou Q, Yu L, Heng PA, 2020. MS-Net: Multi-Site Network for Improving Prostate Segmentation with Heterogeneous MRI Data. IEEE Trans. Med. Imaging 39, 2713–2724. 10.1109/TMI.2020.2974574 [DOI] [PubMed] [Google Scholar]
- Luger AK, Sonnweber T, Gruber L, Schwabl C, Cima K, Tymoszuk P, Gerstner AK, Pizzini A, Sahanic S, Boehm A, Coen M, Strolz CJ, Wöll E, Weiss G, Kirchmair R, Feuchtner GM, Prosch H, Tancevski I, Löffler-Ragg J, Widmann G, 2022. Chest CT of Lung Injury 1 Year after COVID-19 Pneumonia: The CovILD Study. Radiology 211670. 10.1148/radiol.211670 [DOI] [PMC free article] [PubMed] [Google Scholar]
- McGroder CF, Zhang D, Choudhury MA, Salvatore MM, D’Souza BM, Hoffman EA, Wei Y, Baldwin MR, Garcia CK, 2021. Pulmonary fibrosis 4 months after COVID-19 is associated with severity of illness and blood leucocyte telomere length. Thorax 76, 1242–1245. 10.1136/thoraxjnl-2021-217031 [DOI] [PMC free article] [PubMed] [Google Scholar]
- Meng L, Dong D, Li L, Niu M, Bai Y, Wang M, Qiu X, Zha Y, Tian J, 2020. A Deep Learning Prognosis Model Help Alert for COVID-19 Patients at High-Risk of Death: A Multi-Center Study. IEEE J Biomed Health Inform 24, 3576–3584. 10.1109/JBHI.2020.3034296 [DOI] [PMC free article] [PubMed] [Google Scholar]
- National Lung Screening Trial Research Team, 2013. Data from the National Lung Screening Trial (NLST). 10.7937/TCIA.HMQ8-J677 [DOI]
- National Lung Screening Trial Research Team, Aberle DR, Adams AM, Berg CD, Black WC, Clapp JD, Fagerstrom RM, Gareen IF, Gatsonis C, Marcus PM, Sicks JD, 2011. Reduced lung-cancer mortality with low-dose computed tomographic screening. N. Engl. J. Med 365, 395–409. 10.1056/NEJMoa1102873 [DOI] [PMC free article] [PubMed] [Google Scholar]
- Osanlouy M, Clark AR, Kumar H, King C, Wilsher ML, Milne DG, Whyte K, Hoffman EA, Tawhai MH, 2020. Lung and fissure shape is associated with age in healthy never-smoking adults aged 20–90 years. Sci Rep 10, 16135. 10.1038/s41598-020-73117-w [DOI] [PMC free article] [PubMed] [Google Scholar]
- Paszke A, Gross S, Massa F, Lerer A, Bradbury J, Chanan G, Killeen T, Lin Z, Gimelshein N, Antiga L, Desmaison A, Köpf A, Yang E, DeVito Z, Raison M, Tejani A, Chilamkurthy S, Steiner B, Fang L, Bai J, Chintala S, 2019. PyTorch: An Imperative Style, High-Performance Deep Learning Library. 10.48550/arXiv.1912.01703 [DOI]
- Potential long-term effects of SARS-CoV-2 infection on the pulmonary vasculature: a global perspective | Nature Reviews Cardiology [WWW Document], n.d. URL https://www.nature.com/articles/s41569-021-00640-2 (accessed 4.16.22). [DOI] [PMC free article] [PubMed]
- Rahman S, Rahman MM, Miah M, Begum MN, Sarmin M, Mahfuz M, Hossain ME, Rahman MZ, Chisti MJ, Ahmed T, Arifeen SE, Rahman M, 2022. COVID-19 reinfections among naturally infected and vaccinated individuals. Sci Rep 12, 1438. 10.1038/s41598-022-05325-5 [DOI] [PMC free article] [PubMed] [Google Scholar]
- Regression Shrinkage and Selection via the Lasso on JSTOR [WWW Document], n.d. URL https://www.jstor.org/stable/2346178?seq=1 (accessed 3.21.22).
- Ren Q, Zhou B, Tian L, Guo W, 2022. Detection of COVID-19 With CT Images Using Hybrid Complex Shearlet Scattering Networks. IEEE J Biomed Health Inform 26, 194–205. 10.1109/JBHI.2021.3132157 [DOI] [PubMed] [Google Scholar]
- Revel M-P, Boussouar S, de Margerie-Mellon C, Saab I, Lapotre T, Mompoint D, Chassagnon G, Milon A, Lederlin M, Bennani S, Molière S, Debray M-P, Bompard F, Dangeard S, Hani C, Ohana M, Bommart S, Jalaber C, El Hajjam M, Petit I, Fournier L, Khalil A, Brillet P-Y, Bellin M-F, Redheuil A, Rocher L, Bousson V, Rousset P, Grégory J, Deux J-F, Dion E, Valeyre D, Porcher R, Jilet L, Abdoul H, 2021. Study of Thoracic CT in COVID-19: The STOIC Project. Radiology 301, E361–E370. 10.1148/radiol.2021210384 [DOI] [PMC free article] [PubMed] [Google Scholar]
- Saltz Joel, Saltz Mary, Prasanna Prateek, Moffitt Richard, Hajagos Janos, Bremer Erich, Balsamo Joseph, Kurc Tahsin, 2021. Stony Brook University COVID-19 Positive Cases. 10.7937/TCIA.BBAG-2923 [DOI]
- SARS-CoV-2 infection produces chronic pulmonary epithelial and immune cell dysfunction with fibrosis in mice | Science Translational Medicine [WWW Document], n.d. URL https://www.science.org/doi/10.1126/scitranslmed.abo5070 (accessed 8.17.22). [DOI] [PMC free article] [PubMed]
- Scher AI, Xu Y, Korf ESC, White LR, Scheltens P, Toga AW, Thompson PM, Hartley SW, Witter MP, Valentino DJ, Launer LJ, 2007. Hippocampal shape analysis in Alzheimer’s disease: A population-based study. NeuroImage 36, 8–18. 10.1016/j.neuroimage.2006.12.036 [DOI] [PubMed] [Google Scholar]
- Selvaraju RR, Cogswell M, Das A, Vedantam R, Parikh D, Batra D, 2020. Grad-CAM: Visual Explanations from Deep Networks via Gradient-based Localization. Int J Comput Vis 128, 336–359. 10.1007/s11263-019-01228-7 [DOI] [Google Scholar]
- Serte S, Demirel H, 2021. Deep learning for diagnosis of COVID-19 using 3D CT scans. Comput Biol Med 132, 104306. 10.1016/j.compbiomed.2021.104306 [DOI] [PMC free article] [PubMed] [Google Scholar]
- SeyedAlinaghi S, Afsahi AM, MohsseniPour M, Behnezhad F, Salehi MA, Barzegary A, Mirzapour P, Mehraeen E, Dadras O, 2021. Late Complications of COVID-19; a Systematic Review of Current Evidence. Arch Acad Emerg Med 9, e14. 10.22037/aaem.v9i1.1058 [DOI] [PMC free article] [PubMed] [Google Scholar]
- The National Lung Screening Trial: Overview and Study Design | Radiology [WWW Document], n.d. URL https://pubs.rsna.org/doi/full/10.1148/radiol.10091808 (accessed 3.2.22). [DOI] [PMC free article] [PubMed]
- Time Course of Lung Changes at Chest CT during Recovery from Coronavirus Disease 2019 (COVID-19) - Google Search [WWW Document], n.d. URL https://www.google.com/search?q=Time+Course+of+Lung+Changes+at+Chest+CT+during+Recovery+from+Coronavirus+Disease+2019+(COVID-19)&oq=Time+Course+of+Lung+Changes+at+Chest+CT+during+Recovery+from+Coronavirus+Disease+2019+(COVID-19)&aqs=chrome..69i57.302j0j7&sourceid=chrome&ie=UTF-8 (accessed 3.14.22). [DOI] [PMC free article] [PubMed]
- Tonelli R, Marchioni A, Tabbì L, Fantini R, Busani S, Castaniere I, Andrisani D, Gozzi F, Bruzzi G, Manicardi L, Demurtas J, Andreani A, Cappiello GF, Samarelli AV, Clini E, 2021. Spontaneous Breathing and Evolving Phenotypes of Lung Damage in Patients with COVID-19: Review of Current Evidence and Forecast of a New Scenario. J Clin Med 10, 975. 10.3390/jcm10050975 [DOI] [PMC free article] [PubMed] [Google Scholar]
- Tuekprakhon A, Nutalai R, Dijokaite-Guraliuc A, Zhou D, Ginn HM, Selvaraj M, Liu C, Mentzer AJ, Supasa P, Duyvesteyn HME, Das R, Skelly D, Ritter TG, Amini A, Bibi S, Adele S, Johnson SA, Constantinides B, Webster H, Temperton N, Klenerman P, Barnes E, Dunachie SJ, Crook D, Pollard AJ, Lambe T, Goulder P, Paterson NG, Williams MA, Hall DR, Fry EE, Huo J, Mongkolsapaya J, Ren J, Stuart DI, Screaton GR, 2022. Antibody escape of SARS-CoV-2 Omicron BA.4 and BA.5 from vaccine and BA.1 serum. Cell 185, 2422–2433.e13. 10.1016/j.cell.2022.06.005 [DOI] [PMC free article] [PubMed] [Google Scholar]
- Vaidya P, Alilou M, Hiremath A, Gupta A, Bera K, Furin J, Armitage K, Gilkeson R, Yuan L, Fu P, Lu C, Ji M-Y, Madabhushi A, 2021. An End-to-End Integrated Clinical and CT Based Radiomics Nomogram for Predicting Disease Severity and Need for Ventilator Support in COVID-19 Patients: A Large Multi-Site Retrospective Study (SSRN Scholarly Paper No. ID 3878078). Social Science Research Network, Rochester, NY. 10.2139/ssrn.3878078 [DOI] [Google Scholar]
- van Griethuysen JJM, Fedorov A, Parmar C, Hosny A, Aucoin N, Narayan V, Beets-Tan RGH, Fillion-Robin J-C, Pieper S, Aerts HJWL, 2017. Computational Radiomics System to Decode the Radiographic Phenotype. Cancer Res. 77, e104–e107. 10.1158/00085472.CAN-17-0339 [DOI] [PMC free article] [PubMed] [Google Scholar]
- Wang F, Kream RM, Stefano GB, 2020. Long-Term Respiratory and Neurological Sequelae of COVID-19. Med Sci Monit 26, e928996. 10.12659/MSM.928996 [DOI] [PMC free article] [PubMed] [Google Scholar]
- Wang S, Dong D, Li L, Li H, Bai Y, Hu Y, Huang Y, Yu X, Liu S, Qiu X, Lu L, Wang M, Zha Y, Tian J, 2021. A Deep Learning Radiomics Model to Identify Poor Outcome in COVID-19 Patients With Underlying Health Conditions: A Multicenter Study. IEEE J Biomed Health Inform 25, 2353–2362. 10.1109/JBHI.2021.3076086 [DOI] [PMC free article] [PubMed] [Google Scholar]
- Winkler AM, Ridgway GR, Webster MA, Smith SM, Nichols TE, 2014. Permutation inference for the general linear model. Neuroimage 92, 381–397. 10.1016/j.neuroimage.2014.01.060 [DOI] [PMC free article] [PubMed] [Google Scholar]
- Woolrich MW, Jbabdi S, Patenaude B, Chappell M, Makni S, Behrens T, Beckmann C, Jenkinson M, Smith SM, 2009. Bayesian analysis of neuroimaging data in FSL. Neuroimage 45, S173–186. 10.1016/j.neuroimage.2008.10.055 [DOI] [PubMed] [Google Scholar]
- Wu D, Ellis D, Datta S, 2020. COVID-19: Reduced Lung Function and Increased Psycho-emotional Stress. Bioinformation 16, 293–296. 10.6026/97320630016293 [DOI] [PMC free article] [PubMed] [Google Scholar]
- Xie Y, Bowe B, Al-Aly Z, 2021. Burdens of post-acute sequelae of COVID-19 by severity of acute infection, demographics and health status. Nat Commun 12, 6571. 10.1038/s41467-021-26513-3 [DOI] [PMC free article] [PubMed] [Google Scholar]
- Yang Z, Shi J, He Z, Lü Y, Xu Q, Ye C, Chen S, Tang B, Yin K, Lu Y, Chen X, 2020. Predictors for imaging progression on chest CT from coronavirus disease 2019 (COVID-19) patients. Aging (Albany NY: ) 12, 6037–6048. 10.18632/aging.102999 [DOI] [PMC free article] [PubMed] [Google Scholar]
Associated Data
This section collects any data citations, data availability statements, or supplementary materials included in this article.