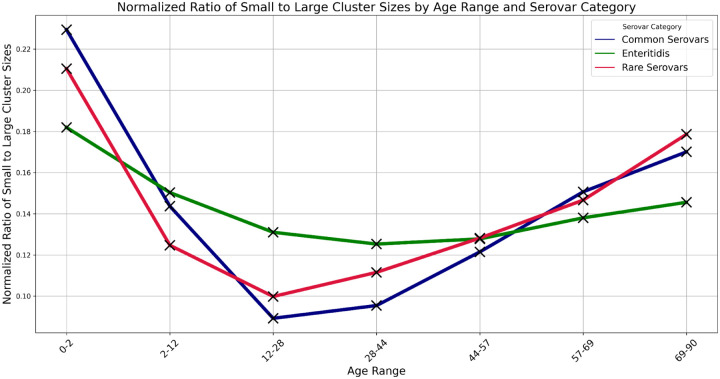
Figure 5.
Ratio of small to large cluster sizes by age range and serovar category
Ratio of the number of cases in small clusters (≤ 4) to the number in large clusters (> 20) by age range and serovar category. Common serovars were those that account for > 1.5% of the cases, excepting Enteritidis which is plotted separately. Rare serovars were those accounting for < 1.5% of the cases. The ratios for each serovar were normalized by summing across age ranges and dividing the ratio for a given age range by this sum.

