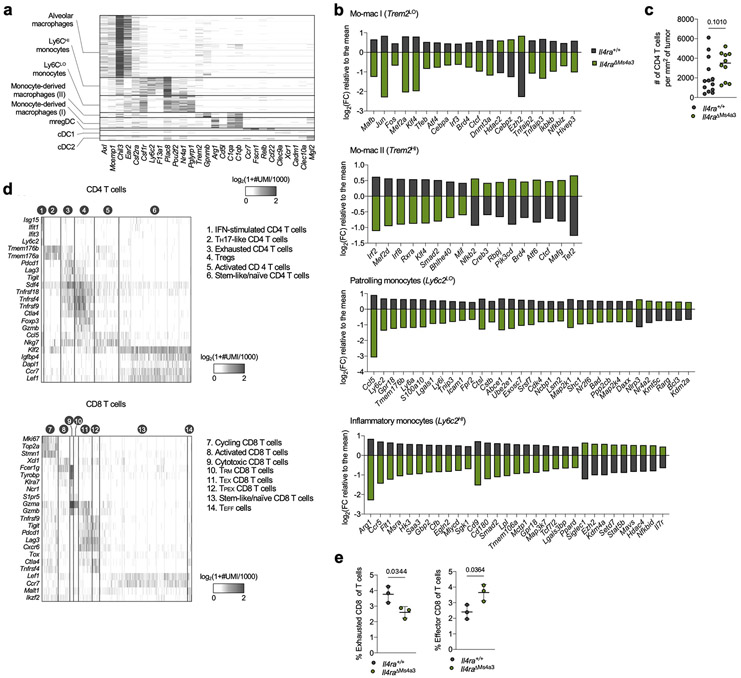
Extended Data Figure 2. Transcriptional and histological analyses of lung tumors in Il4ra+/+ and Il4raΔMs4a3 mice.
(a) Heatmap showing myeloid scRNA-seq clusters (y axis) along with cluster-defining genes (x axis). (b) Gene expression in indicated lung immune clusters of tumor-bearing Il4ra+/+ and Il4raΔMs4a3 mice (n=3 mice per group). One experiment. (c) Average number of CD4 T cells per mm2 of tumor in KP lesions of Il4ra+/+ (n=13) and Il4raΔMs4a3 (n=10) mice. Representative of three independent experiments. (d) Heatmap showing scRNA-seq clusters from sorted T cells (left) and fine-clustered CD4 (middle) and CD8 (right) T cells (y axis) along with cluster-defining genes (x axis). One experiment. (e) Proportion of the “Exhausted CD8” and “Effector CD8” clusters from panel d among all lung T cells in Il4ra+/+ and Il4raΔMs4a3 mice (n=3 mice per group). One experiment. Data are mean (b), median (c), or mean ± s.d (e). Mann-Whitney test (c) or unpaired two-tailed Student’s t-test (e).

