



Abstract
Background:
The biological mechanisms linking environmental exposures with cardiovascular disease (CVD) pathobiology are incompletely understood. We sought to identify circulating proteomic signatures of environmental exposures, and examine their associations with cardiometabolic and respiratory disease (CMD) in observational cohort studies.
Methods:
We tested the relations of >6500 circulating proteins with 29 environmental exposures across the built environment, green space, air pollution, temperature, and social vulnerability indicators in nearly 3000 participants of the Coronary Artery Risk Development in Young Adults (CARDIA) study across 4 centers using penalized and ordinary linear regression. In >3500 participants from the Framingham Heart Study (FHS) and Jackson Heart Study (JHS), we evaluated the prospective relations of proteomic signatures of the envirome with CVD and mortality using Cox models.
Results:
Proteomic signatures of the envirome identified novel/established CVD-relevant pathways including DNA damage, fibrosis, inflammation, and mitochondrial function. The proteomic signatures of the envirome were broadly related to CMD and respiratory phenotypes (e.g., body mass index, lipids, and left ventricular mass) in CARDIA, with replication in FHS/JHS. A proteomic signature of social vulnerability was associated with a composite of CVD/mortality (1428 events; FHS: HR=1.16, 95% CI 1.08–1.24, P=1.77e-05; JHS: HR=1.25 95% CI 1.13–1.38, P=6.38e-06; HR expressed as per 1 standard deviation increase in proteomic signature), robust to adjustment for known clinical risk factors.
Conclusions:
Environmental exposures are related to an inflammatory-metabolic proteome, which identifies individuals with CMD and respiratory phenotypes and outcomes. Future work examining the dynamic impact of the environment on human cardiometabolic health is warranted.
Keywords: Proteomics, Cardiovascular Disease, Risk Factors
Graphical Abstract

INTRODUCTION
For the last two decades, environmental exposures (built structures, air pollution, neighborhood resources, food availability, etc.) have been linked to the risk of cardiometabolic disease (CMD) defined as obesity, insulin resistance, hypertension, and vascular disease1–7. Alongside epidemiological investigations, studies in model systems have implicated certain exposures (e.g., fine particulate matter with median diameter < 2.5 μm, PM2.5) in canonical mechanisms of cardiometabolic disease, including endothelial homeostasis and vascular function8–10. These exposures are highly complex and integrative, with exposures with beneficial associations with health (e.g., proximity to greenspaces) potentially balancing effects from exposures considered more “adverse” (e.g., air pollution)11. These inherent complexities present challenges for the study of environmental exposure in large human populations, specifically limiting the ability to assign a relation between exposures across individuals and geographic locations and the host biochemical state. Furthermore, linkage of the various external exposures (termed the “envirome”) with molecular phenotypes and CMD mechanisms has been limited by the availability of concurrent data on human CMD phenotypes, exposures, risk factors (e.g., obesity), and molecular markers across broad, relevant pathways. Uniting these elements represents a critical next step in understanding the complex interactions between the environment, biochemistry, and human CMD.
We studied 2961 individuals from the Coronary Artery Risk Development in Young Adults study (CARDIA) across 4 geographically distinct field centers in the United States (Birmingham, AL; Oakland, CA; Minneapolis, MN; Chicago, IL) with concurrent quantification of select human environmental exposures and a broad circulating proteome (≈7000 proteins). Our objectives were three-fold: (1) to investigate the plasma proteomic correlates of a multi-dimensional human envirome including measures of the built environment, social vulnerability, temperature trends, and air pollution; (2) to study the relation of this “environmental proteome” with risk factors, phenotypes, and pathways central to CMD; (3) to study whether alteration of levels of these proteins presage cardiovascular disease (CVD) among participants in the Framingham Heart Study (FHS) and Jackson Heart Study (JHS). The geographic diversity across CARDIA centers allowed this “natural” experiment to begin to investigate biochemical correlates of a human envirome. Our overall aim was to connect the measurable envirome with variations in the circulating proteome at an epidemiologic scale, a critical next step in understanding environmental-individual interactions relevant to CMD.
METHODS
Data Availability.
Data are publicly available through the respective coordinating centers12,13, including data from CARDIA (www.cardia.dopm.uab.edu), the Framingham Heart Study (FHS; https://www.framinghamheartstudy.org/fhs-for-researchers/), and Jackson Heart Study (JHS; https://www.jacksonheartstudy.org/Research/Study-Data/Data-Access). Please see the Major Resources Table in the Supplemental Materials. The Institutional Review Board at each institution approved each study.
Study population.
CARDIA:
CARDIA is a prospective, cohort study of young White and Black adults (age 18–30 years recruited in 1985–1986 from 4 field centers in the United States: Birmingham, AL; Chicago, IL; Minneapolis, MN; and Oakland, CA) with a primary aim of studying risk factors for CVD in young adulthood14–17. For the present analysis, we included 2961 individuals with available measures of the human envirome and circulating proteome at Year 25 (2010–2011) after enrollment. We utilized standard CMD clinical and biochemical risk factors, imaging indices of cardiovascular and metabolic risk, and demographic data, the details of which have been reported (Supplemental Table 1)18–23.
Framingham Heart Study (FHS):
The enrollment and characteristics of the FHS Generation 2 (“Offspring”) cohort are detailed elsewhere24. For the present investigation, 1777 participants who underwent protein quantification at the 5th examination cycle without prevalent CVD who had complete data on covariates, incident CVD, and mortality were eligible for inclusion25. Definitions of CMD clinical and biochemical risk factors have been reported previously26–28. Cardiovascular disease events were defined as myocardial infarction, coronary death, angina pectoris, coronary insufficiency, heart failure, stroke or transient ischemic attack, or intermittent claudication29. All participants provided informed written consent, and all study protocols were approved by the Boston University Medical Center Institutional Review Board.
Jackson Heart Study (JHS):
JHS recruited 5306 Black adults (age 35–84 years old except in the family study which recruited age ≥21 years) from the Jackson, MS metropolitan area (Hinds, Madison, Rankin counties) between 2000–2004, with ongoing surveillance and adjudication for CVD risk factors and outcomes. In this analysis we included 1795 individuals with proteomics performed at the first examination in JHS (see Proteomics, below) and complete data on covariates, incident CVD, and mortality30. For this analysis, we defined incident CVD as fatal and non-fatal myocardial infarction, cardiac procedure, and stroke, as defined previously31.
Characterization of human environmental exposures.
We quantified different elements of the human envirome based on residential history, including measures of air pollution, temperature, built environment, food availability, green spaces, and community-level measures (Table 1). We included 5-year averages for pollutants and temperature exposure variables before each visit month. Methodology for quantification of environmental exposures is reproduced with minimal modification from CARDIA for scientific rigor and reproducibility (with attribution provided by this statement).
Table 1.
Definition and data sources of exposures in CARDIA.
| Exposure | Description | Source |
|---|---|---|
| CDC Social Vulnerability Index | CDC Social Vulnerability Index | CDC37 |
| Normalized difference vegetation index (NDVI) | NDVI is an indicator of vegetation. Defined within 5km buffer | NASA (https://search.earthdata.nasa.gov/search) |
| Dist. to river | Distance to nearest river from participant’s address | National Hydrography dataset (https://www.sciencebase.gov/catalog/item/5ea068ae82cefae35a12a120) |
| Dist. to shoreline | Distance to nearest shoreline from participant’s address | NOAA (https://shoreline.noaa.gov/data/datasheets/medres.html) |
| Dist. to park | Distance to nearest major park from participant’s address | USA parks (https://www.arcgis.com/home/item.html?id=578968f975774d3fab79fe56c8c90941) |
| Fast food within 3km | Number of fast-food restaurants within 3 km of participant’s residence | Dun and Bradstreet, a commercial data set of US businesses38 |
| Grocer within 3km | Number of grocery stores within 3km of participant’s residence | |
| Slow food within 3km | Number of slow food restaurants within 3km of participant’s residence | |
| Mini-mart within 3km | Number of convenience stores within 3km of participant’s residence | |
| Any food within 3km | Access to any food facilities within 3km of participant’s residence | |
| School within 3km | Number of educational facilities within 3km of participant’s residence | |
| Public rec. within 3km | Number of public recreation facilities within 3km of participant’s residence | |
| Road length within 3km | Total road length within 3km of participant’s residence | Tele Atlas StreetMap Premium for ArcGIS - North America (https://hub.arcgis.com/content/d3c77c670f924bd189befa4af4a9ca3c/about) |
| PM10 | 5-year average concentration prior to a visit estimated at a participant’s address. | U.S. EPA Air Quality System34 |
| Ozone | ||
| NO2 | ||
| SO2 | ||
| CO | ||
| PM2.5 (5-yr avg.) | Dalhousie University Atmospheric Composition Analysis Group / GEOS-Chem32,33 | |
| Black carbon in PM2.5 (5-yr avg.) | ||
| Ammonium in PM2.5 (5-yr avg.) | ||
| Nitrate in PM2.5 (5-yr avg.) | ||
| Organic matter in PM2.5 (5-yr avg.) | ||
| Sulfate in PM2.5 (5-yr avg.) | ||
| Mineral dust in PM2.5 (5-yr avg.) | ||
| Sea salt in PM2.5 (5-yr avg.) | ||
| Summer temp. (5-yr avg.) | Average temperature of the past 5 summers prior to a visit | North America Land Data Assimilation System36 |
| Winter temp. (5-yr avg.) | Average temperature of the past 5 winters prior to a visit | |
| Temperature (5-yr avg.) | Average temperature of the past 5 years prior to a visit |
Air pollution:
We utilize a validated product by the Dalhousie University Atmospheric Composition Analysis Group32 for PM2.5 and PM2.5 species in CARDIA, which employs a hybrid approach (satellite remote-sensing data, MODIS and MISR), chemical transport modeling, and ground monitors) to predict PM2.5 concentrations at 1-kilometer resolution32. For PM2.5 species (black and organic carbon, sulfate, nitrate, ammonium, mineral dust, sea salt particles) from 2000 onwards, GEOS-Chem (a global 3D chemical transport modeling) simulation integrated additional ground-based constraints via geographic weighted regression (GWR)33. For other pollutants (PM10, ozone [O3], nitrogen dioxide [NO2], sulfur dioxide [SO2], and carbon monoxide [CO]), data since the 1980s were obtained from the U.S. EPA Air Quality System34. To assign exposures to each CARDIA participant, we utilized annual averages of interpolated values derived from a spatiotemporal kriging method35 based on residential history that use both spatial and temporal information to predict exposures at participants’ residential addresses.
Weather:
We obtained weather variable data from the North America Land Data Assimilation System (NLDAS), which integrates the most reliable weather observations and model outputs36. This comprehensive system offers high-resolution weather parameters spanning from 1979 to the present. In our study, we specifically derived annual, summer, and winter averages to represent temperature exposures.
Green and blue spaces:
We derived two metrics for exposure to greenspaces: (1) Normalized Difference Vegetation Index (NDVI; downloaded from NASA; https://search.earthdata.nasa.gov/search) and (2) distance to the nearest major park. For NDVI data using in this study, we used the Moderate Resolution Imaging Spectroradiometer (MODIS). We also derived distance to the nearest river (a natural flowing watercourse) and shore (a boundary where a body of water (e.g., lakes) meets the land) from participants’ residential address.
Neighborhood-level contextual variables:
We used the Social Vulnerability Index (SVI) developed by the Centers for Disease Control and Prevention (CDC). The SVI is a comprehensive measure that takes into account factors such as socioeconomic status, household composition, minority status, language proficiency, and housing type37.
Food environments:
We finally considered proximity and availability of various types of food stores near their residential locations. We specifically used the counts of different types of food stores within a 3-kilometer radius of each respondent previously developed in CARDIA38, including fast food stores, “slow service” (sit-down service) food stores, grocery stores, and convenience stores. We incorporated other factors related to the built environment and community resources, including presence of educational facilities, public recreation amenities, and the total length of roads.
Quantification of the circulating proteome
Proteomic quantification was performed using the aptamer-based technology for all studies included in this report (SomaScan; Somalogic, Boulder, CO). The CARDIA study utilized the SomaScan 7k platform, which quantified 7291 aptamers. Sixty-eight participants had >1 sample run for proteomics, protein data for these subjects was averaged for use in models. Protein data were examined for batch effects, of which none were detected. We excluded 61 aptamers with a coefficient of variation >20%. No participant outliers were identified in multivariate approaches using principal components analysis. Proteomics data were log-transformed and standardized (mean 0, variance 1) for analysis.
Protein quantification in FHS and JHS was performed with earlier versions of the SomaScan platform (≈1000–1300 aptamers). We used previously described methods to normalize protein levels in FHS and JHS25,39. Briefly, given differences in collection batch in FHS and JHS, protein levels were standardized within each batch, pooled, and rank normalized across all samples, with subsequent residualization against assay plate before analysis to remove plate-based effects, as described25.
Statistical analysis
An overview of the study design and statistical methods is shown in Figure 1A. We subset the CARDIA sample into derivation (70%) and validation (30%) sets that were balanced by center for each exposure. Given the differences in missingness of exposure variables, unique derivation and validation sets were created for each exposure’s models. Independent and dependent variables were standardized (mean 0, variance 1), separately in derivation and validation samples. We constructed two sets of models: (1) linear models with each protein as a function of each environmental exposure with adjustments for age, sex, and race (to understand the association of exposures with proteins); (2) penalized (least absolute shrinkage and selection operator [LASSO]) regression models for exposures as a function of the proteome (to develop signatures of each exposure as a function of the proteome). A 5% false discovery rate (FDR, Benjamini-Hochberg method) was used to address type 1 error across all non-penalized models. All models were estimated separately in the derivation and validation set (with proteins passing 5% FDR in derivation tested in the validation set). Of note, we purposefully did not adjust for clinical center in models relating proteins to exposures given that broad exposure variability by center was essential to define proteomic correlates. For each exposure, we selected proteins with FDR < 5% and performed pathway analysis respectively. We used R package clusterProfiler40 and performed enrichment analysis based on selected proteins’ gene symbol IDs on WikiPathways database using all genes in WikiPathways as the background41 (prioritizing an approach that assigns proteins to pathways, recognizing potential bias of enrichment P value). The top 5 most enriched pathways mapped with at least 5 significant proteins in each exposure were selected for data visualization by heatmap (Figure 4). Penalized regression models (LASSO; R package caret42) were trained using the derivation sample and model fit was tested in the validation sample. Results from penalized regression were used to create protein “scores” of environmental exposures by summing the products of a participant’s standardized protein levels by the model coefficients.
Figure 1: Study design and correlations between environmental exposures.

(A) We derived circulating proteomic signatures of a variety of environmental exposures. These proteomic signatures were then examined for their relation with cardiorespiratory and metabolic outcomes in 3 separate cohorts. (B) Heatmap of Spearman correlation coefficients between all the environmental exposures. CDC = Centers for Disease Control and Prevention; NDVI = normalized difference vegetation index; Dist. = distance; NO2 = nitrogen dioxide; SO2 = sulfur dioxide; CO = carbon monoxide; PM10 = particulate matter with median diameter < 10 μm; PM2.5 = particulate matter with median diameter < 2.5 μm; avg. = average; temp. = temperature.
Figure 4: Pathway analyses plots.

Pathway enrichment analysis was performed on WikiPathways for significant proteins (FDR ≤ 0.05) in each exposure. Heatmaps were made based on negative log10 transformed adjusted p values for the top 5 most enriched pathways mapped with at least 5 significant proteins in each exposure. Rows represent pathways and columns represent exposures and the white to red colors in the heatmap represents the level of enrichment. Grey color means none of the significant proteins in the exposure can be mapped to the pathway.
We tested the LASSO model-predicted environmental exposures (e.g., proteomic signatures of each exposure) and the parent environmental phenotypes themselves in relation to cardiometabolic and respiratory outcomes (Supplementary Table 1). To mitigate confounding effects of traditional risk factors, these models were adjusted for age, sex, race, center (to account for differences in outcomes across centers), body mass index (BMI), systolic and diastolic blood pressure, use of anti-hypertensive medication, diabetes, lifetime pack-years of smoking, estimated glomerular filtration rate, total cholesterol, and high-density lipoprotein (HDL). In models where the phenotype was part of the adjustments (e.g., total cholesterol), the phenotype was not included as part of the adjustments. Models for blood pressure and cholesterol/lipoproteins were additionally adjusted for anti-hypertensive or lipid-lowering medication use, respectively. We selected canonical scores within each exposure category (e.g., PM2.5 from pollutants) based on their relations with cardiometabolic and respiratory phenotypes for translation into JHS and FHS.
To assess the clinical importance of the envirome-prioritized proteome, we tested proteomic signatures of environmental exposure for association with incident CVD and mortality in JHS and FHS in survival (Cox) models. Use of protein scores in JHS and FHS required recalibration as not all proteins measured in CARDIA were available. We identified the intersection of proteins among the 3 cohorts through matching on UniProt identifier (not SomaScan identifier as these may change between generations of SomaScan panels). We used recursive feature elimination (R package caret42) with a 5% tolerance to recalibrate protein scores in CARDIA using the reduced set of proteins. Protein scores were then examined for relations with cardiometabolic and respiratory phenotypes in JHS and FHS along with relations with incident cardiovascular disease (defined above for JHS and FHS) and all-cause death. Cox models were adjusted for age, sex, BMI, smoking, diabetes, systolic blood pressure, use of anti-hypertensive medication, total cholesterol, and HDL. Participants who did not experience the outcome were censored at the time of last contact.
RESULTS
Study populations.
Our study included 2961 CARDIA study participants from the Year 25 exam (Table 2). The CARDIA sample had a median age of 51 years (56% women; 46% Black individuals), with a moderate prevalence of obesity, hypertension, diabetes, and coronary artery calcification. As expected, environmental exposures differed by CARDIA center (Table 3; Supplemental Figure 1). For example, participants from Birmingham had on average greater indices of social vulnerability, distances to green spaces, exposure to PM2.5 and summer temperature. We observed modest correlations among exposures, with blocks of higher correlation for measures of the built environment and some measures of air pollution (Figure 1B). Characteristics of the JHS and FHS samples are shown in Table 4. Overall, we studied 3572 participants with a median age in the mid-50s (58% women; JHS comprised of all Black individuals, FHS comprised of predominantly White individuals), with a moderate to high 10-year predicted risk of CVD events.
Table 2:
Baseline characteristics of the CARDIA study population.
| Characteristic | Overall N = 2,961 |
Birmingham, AL N = 688 |
Chicago, IL N = 691 |
Minneapolis, MN N = 795 |
Oakland, CA N = 787 |
p-value |
|---|---|---|---|---|---|---|
| Age | 51.0 (47.0, 53.0); 0% | 50.0 (47.0, 53.0); 0% | 50.0 (47.0, 53.0); 0% | 51.0 (48.0, 53.5); 0% | 51.0 (47.0, 53.0); 0% | 0.001 |
| Female | 1,655 (56%); 0% | 377 (55%); 0% | 388 (56%); 0% | 422 (53%); 0% | 468 (59%); 0% | 0.073 |
| Race | 7.20e-15 | |||||
| Black | 1,375 (46%); 0% | 387 (56%); 0% | 314 (45%); 0% | 282 (35%); 0% | 392 (50%); 0% | |
| White | 1,586 (54%); 0% | 301 (44%); 0% | 377 (55%); 0% | 513 (65%); 0% | 395 (50%); 0% | |
| Body mass index (kg/m2) | 29 (25, 34); 0.2% | 30 (26, 35); 0.1% | 28 (25, 34); 0.1% | 29 (25, 33); 0.4% | 28 (25, 34); 0% | 1.50e-06 |
| Systolic blood pressure (mmHg) | 117 (108, 127); 0.1% | 118 (109, 128); 0.1% | 115 (106, 127); 0% | 117 (108, 126); 0.1% | 117 (108, 127); 0.3% | 0.026 |
| Diastolic blood pressure (mmHg) | 73 (66, 81); 0.2% | 73 (66, 80); 0.1% | 73 (65, 81); 0% | 73 (66, 80); 0.1% | 74 (67, 82); 0.4% | 0.111 |
| Treated for hypertension | 816 (28%); 0% | 277 (40%); 0% | 155 (22%); 0% | 163 (21%); 0% | 221 (28%); 0% | 3.10e-18 |
| Diabetes | 437 (15%); 0% | 141 (20%); 0% | 94 (14%); 0% | 87 (11%); 0% | 115 (15%); 0% | 3.75e-06 |
| Lifetime pack-years of cigarettes | 0 (0, 7); 0% | 0 (0, 6); 0% | 0 (0, 6); 0% | 1 (0, 13); 0% | 0 (0, 3); 0% | 1.47e-15 |
| eGFR (ml/min/1.73m2) | 94 (82, 108); <0.1% | 96 (83, 110); 0% | 93 (80, 107); 0% | 95 (84, 109); 0.1% | 93 (83, 107); 0.1% | 0.019 |
| Total cholesterol (mg/dL) | 189 (166, 214); 0% | 184 (161, 207); 0% | 189 (169, 218); 0% | 190 (166, 215); 0% | 194 (170, 217); 0% | 6.13e-06 |
| High-density lipoprotein (mg/dL) | 55 (45, 67); 0% | 53 (44, 63); 0% | 56 (46, 70); 0% | 54 (44, 67); 0% | 57 (46, 68); 0% | 3.22e-05 |
| On lipid lowering medication | 478 (16%); 0% | 147 (21%); 0% | 100 (14%); 0% | 115 (14%); 0% | 116 (15%); 0% | 4.22e-04 |
| LV mass index (2D) (g/m) | 33 (28, 38); 4.0% | 34 (29, 40); 4.7% | 32 (27, 37); 3.0% | 32 (28, 37); 4.5% | 33 (28, 38); 3.8% | 6.13e-06 |
| LV mass index (M-mode) (g/m) | 39 (32, 46); 7.9% | 41 (34, 48); 5.4% | 37 (31, 44); 4.1% | 39 (33, 46); 14% | 39 (32, 46); 7.1% | 3.31e-08 |
| LV GLS (%) | −15.07 (−16.70, −13.51); 13% | −14.60 (−16.35, −13.05); 20% | −15.34 (−16.89, −13.80); 7.4% | −15.03 (−16.60, −13.38); 11% | −15.15 (−16.67, −13.68); 13% | 1.37e-04 |
| Total CAC (HU) | 0 (0, 5); 0.2% | 0 (0, 3); 0% | 0 (0, 6); 0.7% | 0 (0, 7); 0% | 0 (0, 4); 0.1% | 0.407 |
| Total AAC (HU) | 2 (0, 95); 2.5% | 2 (0, 104); 0.6% | 1 (0, 77); 2.0% | 4 (0, 142); 3.8% | 1 (0, 65); 3.3% | 0.009 |
| Visceral fat vol. (cm3) | 120 (78, 172); 1.0% | 118 (81, 165); 0.1% | 119 (80, 171); 0.7% | 123 (79, 181); 2.8% | 118 (71, 171); 0.1% | 0.250 |
| Subcutaneous fat vol. (cm3) | 303 (208, 442); 1.0% | 341 (231, 493); 0.1% | 282 (193, 408); 0.7% | 292 (203, 427); 2.8% | 302 (211, 436); 0.1% | 4.07e-09 |
| VAT:SAT ratio | 0.38 (0.26, 0.57); 1.0% | 0.35 (0.24, 0.52); 0.1% | 0.41 (0.28, 0.61); 0.7% | 0.42 (0.28, 0.62); 2.8% | 0.36 (0.25, 0.55); 0.1% | 1.02e-11 |
| Hemoglobin A1c (%) | 5.50 (5.30, 5.80); 1.2% | 5.60 (5.30, 6.00); 1.6% | 5.50 (5.30, 5.90); 0.7% | 5.50 (5.20, 5.80); 1.0% | 5.50 (5.30, 5.80); 1.4% | 3.05e-05 |
| FEV1 (L) | 2.64 (2.19, 3.18); 15% | 2.51 (2.12, 3.09); 16% | 2.65 (2.17, 3.29); 18% | 2.73 (2.30, 3.23); 18% | 2.64 (2.17, 3.11); 9.8% | 4.74e-05 |
| FVC (L) | 3.45 (2.83, 4.19); 15% | 3.25 (2.65, 3.98); 16% | 3.52 (2.81, 4.34); 18% | 3.65 (3.02, 4.39); 18% | 3.38 (2.83, 4.03); 9.8% | 1.75e-11 |
| FEV1/FVC | 0.78 (0.73, 0.81); 16% | 0.79 (0.75, 0.83); 16% | 0.77 (0.73, 0.81); 18% | 0.76 (0.72, 0.80); 19% | 0.79 (0.75, 0.82); 9.8% | 5.94e-19 |
| Sum of AHA Life Simple 7 | 9.00 (7.00, 10.00); 22% | 8.00 (7.00, 10.00); 16% | 9.00 (7.00, 11.00); 13% | 9.00 (7.00, 10.00); 27% | 9.00 (8.00, 11.00); 31% | 6.39e-13 |
| Pooled cohort equation risk score | 0.03 (0.01, 0.06); 1.5% | 0.03 (0.01, 0.07); 0.9% | 0.03 (0.01, 0.05); 1.0% | 0.03 (0.01, 0.05); 1.8% | 0.03 (0.01, 0.05); 2.0% | 1.02e-05 |
Baseline demographics and characteristics of the CARDIA study population. Measures at the Year 25 exam are reported, except for FEV1, FVC and FEV1/FVC ratio which were reported at Year 30. Continuous variables are reported as median (interquartile range); missingness. Categorical variables are reported as n (%); missingness. P-values are for the Kruskal-Wallis rank sum test for continuous variables and Chi-squared test for categorical variables. For pairwise testing between centers, please refer to Supplemental Table 2. eGFR = estimated glomerular filtration rate; LVEDD = left ventricular end diastolic diameter; LV = left ventricular; GLS = global longitudinal strain; CAC = coronary artery calcification; AAC = abdominal aortic calcification; vol. = volume; VAT = visceral abdominal tissue; SAT = subcutaneous abdominal tissue; FEV1 = forced expiratory volume in 1 second; FVC = forced vital capacity; AHA = American Heart Association; CVD = cardiovascular disease.
Table 3:
Distribution of environmental exposures across CARDIA center.
| Exposure | Birmingham, AL N = 688 |
Chicago, IL N = 691 |
Minneapolis, MN N = 795 |
Oakland, CA N = 787 |
p-value |
|---|---|---|---|---|---|
| CDC Social Vulnerability Index | 0.53 (0.21, 0.79); 0% | 0.40 (0.17, 0.75); 0% | 0.39 (0.13, 0.68); 0% | 0.43 (0.21, 0.71); 0% | 5.68e-06 |
| NDVI | 0.52 (0.43, 0.60); 0% | 0.34 (0.22, 0.43); 0% | 0.42 (0.18, 0.54); 0% | 0.33 (0.27, 0.42); 0% | 8.23e-125 |
| Dist. to river (km) | 0.33 (0.18, 0.68); 0% | 1.81 (0.49, 5.36); 0% | 1.14 (0.47, 1.98); 0% | 0.57 (0.26, 1.32); 0% | 1.72e-113 |
| Dist. to shoreline (km) | 308 (297, 321); 0% | 7 (3, 19); 0% | 210 (202, 217); 0% | 4 (2, 12); 0% | <2.2e-308 |
| Dist. to park (km) | 7,965 (4,902, 12,416); 0% | 4,086 (1,788, 6,820); 0% | 2,527 (1,532, 4,647); 0% | 2,251 (1,322, 3,987); 0% | 2.26e-134 |
| Fast food within 3km | 15 (6, 26); 21% | 55 (32, 83); 24% | 33 (21, 57); 20% | 44 (24, 70); 20% | 8.77e-119 |
| Grocer within 3km | 8 (4, 16); 21% | 27 (10, 92); 24% | 17 (7, 35); 20% | 27 (10, 49); 20% | 8.44e-75 |
| Slow food within 3km | 13 (7, 24); 21% | 54 (29, 91); 24% | 26 (14, 54); 20% | 57 (24, 106); 20% | 2.79e-117 |
| Mini-mart within 3km | 16 (8, 29); 21% | 34 (17, 60); 24% | 17 (10, 25); 20% | 23 (13, 35); 20% | 1.88e-55 |
| Any food within 3km | 74 (39, 119); 21% | 250 (140, 451); 24% | 133 (81, 272); 20% | 233 (122, 414); 20% | 2.29e-117 |
| School within 3km | 14 (7, 25); 21% | 66 (32, 102); 24% | 38 (21, 65); 20% | 54 (27, 97); 20% | 5.86e-135 |
| Public rec. within 3km | 1.0 (0.0, 3.0); 21% | 6.0 (3.0, 15.0); 24% | 4.0 (1.0, 7.0); 20% | 6.0 (2.0, 12.0); 20% | 3.95e-111 |
| Road length within 3km (km) | 211,597 (140,014, 293,747); 0% | 305,810 (225,600, 416,752); 0% | 325,532 (210,848, 382,564); 0% | 311,189 (205,385, 385,450); 0% | 8.74e-58 |
| PM10 (μg/m3) | 22.2 (18.2, 24.1); 1.2% | 21.5 (19.0, 26.1); 0.6% | 19.0 (16.7, 23.6); 2.3% | 19.4 (15.9, 21.4); 1.9% | 1.30e-42 |
| Ozone (ppm) | 0.030 (0.027, 0.031); 20% | 0.031 (0.024, 0.033); 0.4% | 0.029 (0.024, 0.032); 28% | 0.031 (0.025, 0.034); 0.6% | 2.45e-07 |
| NO2 (ppm) | 8.9 (7.1, 9.9); 26% | 12.6 (11.0, 17.2); 4.8% | 8.5 (6.1, 10.5); 86% | 7.9 (5.9, 11.9); 6.9% | 1.21e-108 |
| SO2 (ppm) | 2.31 (1.86, 2.61); 2.9% | 1.91 (1.69, 2.11); 2.9% | 0.36 (0.23, 0.73); 4.0% | 0.75 (0.70, 0.89); 5.8% | <2.2e-308 |
| CO (ppm) | 0.35 (0.33, 0.40); 4.8% | 0.38 (0.35, 0.41); 2.9% | 0.30 (0.28, 0.32); 59% | 0.32 (0.29, 0.41); 5.3% | 2.26e-102 |
| PM2.5 (5-yr avg.; μg/m3) | 13.74 (13.28, 13.96); 0% | 12.84 (11.64, 13.52); 0.1% | 10.07 (9.79, 10.27); 0.1% | 10.25 (9.00, 10.66); 0% | <2.2e-308 |
| PM2.5-Black carbon (5-yr avg.; μg/m3) | 1.51 (1.46, 1.54); 0% | 0.93 (0.83, 1.01); 0.1% | 0.77 (0.69, 0.82); 0.1% | 1.02 (0.74, 1.12); 0% | 9.81e-300 |
| PM2.5-Ammonium (5-yr avg.; μg/m3) | 1.25 (1.22, 1.31); 0% | 1.67 (1.47, 1.75); 0.1% | 1.26 (1.24, 1.28); 0.1% | 0.64 (0.60, 0.74); 0% | 1.89e-313 |
| PM2.5-Nitrate (5-yr avg.; μg/m3) | 0.70 (0.66, 0.74); 0% | 2.38 (2.20, 2.54); 0.1% | 2.11 (1.99, 2.24); 0.1% | 1.92 (1.38, 2.12); 0% | 6.91e-301 |
| PM2.5-Organic matter (5-yr avg.; μg/m3) | 5.28 (5.12, 5.37); 0% | 3.45 (3.00, 3.76); 0.1% | 3.25 (2.52, 3.76); 0.1% | 4.76 (3.49, 5.15); 0% | 2.60e-235 |
| PM2.5-Sulfate (5-yr avg.; μg/m3) | 3.93 (3.78, 4.07); 0% | 2.77 (2.58, 2.94); 0.1% | 2.01 (1.94, 2.09); 0.1% | 0.98 (0.89, 1.02); 0% | <2.2e-308 |
| PM2.5-Mineral dust (5-yr avg.; μg/m3) | 1.09 (1.04, 1.11); 0% | 0.58 (0.51, 0.62); 0.1% | 0.46 (0.44, 0.47); 0.1% | 0.41 (0.37, 0.45); 0% | <2.2e-308 |
| PM2.5-Sea salt PM2.5 (5-yr avg.; μg/m3) | 0.23 (0.22, 0.24); 0% | 0.26 (0.22, 0.28); 0.1% | 0.16 (0.15, 0.17); 0.1% | 1.44 (0.77, 1.75); 0% | <2.2e-308 |
| Summer temp. (5-yr avg.; Celsius) | 27.9 (27.8, 28.0); 0% | 22.7 (22.5, 22.7); 0.1% | 22.4 (22.2, 22.6); 0.1% | 19.6 (17.7, 21.9); 0% | <2.2e-308 |
| Winter temp. (5-yr avg.; Celsius) | 7 (7, 7); 0% | −4 (−4, −3); 0.1% | −9 (−10, −9); 0.1% | 11 (9, 11); 0% | <2.2e-308 |
| Temperature (5-yr avg.; Celsius) | 17.8 (17.6, 17.9); 0% | 10.3 (10.1, 10.5); 0.1% | 7.7 (7.5, 7.9); 0.1% | 14.6 (14.0, 15.4); 0% | <2.2e-308 |
Distribution of environmental exposures across centers in CARDIA. Variables are reported as median (interquartile range); missingness. P-values are for the Kruskal-Wallis rank sum test. For pairwise testing between centers, please refer to Supplemental Table 3. CDC = Centers for Disease Control and Prevention; NDVI = normalized difference vegetation index; Dist. = distance; NO2 = nitrogen dioxide; SO2 = sulfur dioxide; CO = carbon monoxide; PM10 = particulate matter with median diameter < 10 μm; PM2.5 = particulate matter with median diameter < 2.5 μm; avg. = average; temp. = temperature; IQR = interquartile range.
Table 4:
Baseline Characteristics of FHS and JHS.
| Characteristic | JHS N = 1795 |
FHS N = 1777 |
|---|---|---|
| Age (years) | 55 (45, 64); 0% | 54 (47, 62); 0% |
| Women | 1,106 (62%); 0% | 978 (55%); 0% |
| Ever smoker | 589 (33%); 0% | 349 (20%); 0%* |
| Body mass index (kg/m2) | 30 (27, 35); 0% | 27 (24, 30); 0% |
| Treated for hypertension | 906 (50%); 0% | 300 (17%); 0% |
| Systolic blood pressure (mmHg) | 126 (116, 136); 0% | 124 (112, 138); 0% |
| Diastolic blood pressure (mmHg) | 76 (70, 82); 0% | 74 (68, 81); 0% |
| Hemoglobin A1c (%) | 5.70 (5.30, 6.10); 0%% | NA |
| Fasting glucose (mg/dL) | NA | 95 (89, 103); 0.8% |
| Total cholesterol (mg/dL) | 197 (172, 224); 0% | 204 (181, 227); 0% |
| High-density lipoprotein (md/dL) | 49 (41, 60); 0% | 48 (39, 59); 0% |
| Pooled cohort equation 10-yr risk | 0.09 (0.04, 0.17); 15% | 0.05 (0.02, 0.10); <0.1% |
| CVD events | 460 (26%); 0% | 905 (51%); 0% |
| Years to CVD event or censoring | 13.6 (12.1, 14.6); 0% | 23.3 (13.8, 26.5); 0% |
Baseline characteristics of the FHS and JHS study population. Continuous variables are reported as median (interquartile range); missingness. Categorical variables are reported as n (%); missingness. CVD = cardiovascular disease; HF = heart failure; NA = not available.
Association between human proteome and the envirome and its relation to CMD.
Our approach relies on understanding the joint variation between an exposure and circulating protein levels in a geographically diverse population, with the hypothesis that such conjoint variation may begin to represent a host biochemical profile reflective of the environment. Our first approach was to construct linear models for individual proteins as a function of each environmental exposure (adjusted for age, sex, and race; Data Supplement SD03 and SD04 for full regression results). Across 29 environmental exposure measures in our discovery sample, a broad range of the human proteome (N=6685 proteins) was related to the envirome (most frequent associations with distance to shore, N=5915; least with PM10; N=4).
Given the complex inter-relations within the proteome, we next fit multi-protein models for each environmental exposure (LASSO) in our derivation sample (N=1412–2074 across all exposures) and tested its fit (R2) in our validation sample (N=602–887 across all exposures; Figure 2, Supplemental Table 4). We observed a broad range of model fits (R2=0.02–0.26), with a more modest fit for measures of the built environment and the best fit for temperature and social vulnerability (for details regarding the composition of these proteomic signatures please refer to Data Supplement SD05). The relation of these proteomic “signatures” of human envirome (and parent exposure variables) are shown in Figure 3. All models were adjusted for age, sex, race, center, and CMD risk factors (as noted in legend), given potential differences in phenotype across center and by CMD risk factors. Overall, while the environmental exposure phenotype had limited relations after adjustment (Figure 3A), we observed consistent relations between proteomics of all four environmental exposure categories with LV mass, obesity/regional adiposity, pulmonary function, and lipids (Figure 3B), even with adjustment for traditional risk factors, BMI, and CARDIA field center. Notably, regression estimates for models of CMD phenotypes (in Figure 3) vs. envirome exposure measures were modestly correlated with those for proteomic signatures of these exposures (Pearson r=0.53), though with significant variation across phenotypes (Figure 3C).
Figure 2. Model fit of protein scores for exposures.

(left) Barplot of the R2 from linear models of exposure (outcome) as a function of its protein score (predictor) in the validation sample, which was not used to train the model. (right) Barplot of the number of proteins included in each protein score. CDC = Centers for Disease Control and Prevention; NDVI = normalized difference vegetation index; Dist. = distance; NO2 = nitrogen dioxide; SO2 = sulfur dioxide; CO = carbon monoxide; PM10 = particulate matter with median diameter < 10 μm; PM2.5 = particulate matter with median diameter < 2.5 μm; avg. = average; temp. = temperature.
Figure 3: Relation of environmental exposures and their corresponding protein scores with cardiometabolic and respiratory phenotypes in CARDIA.
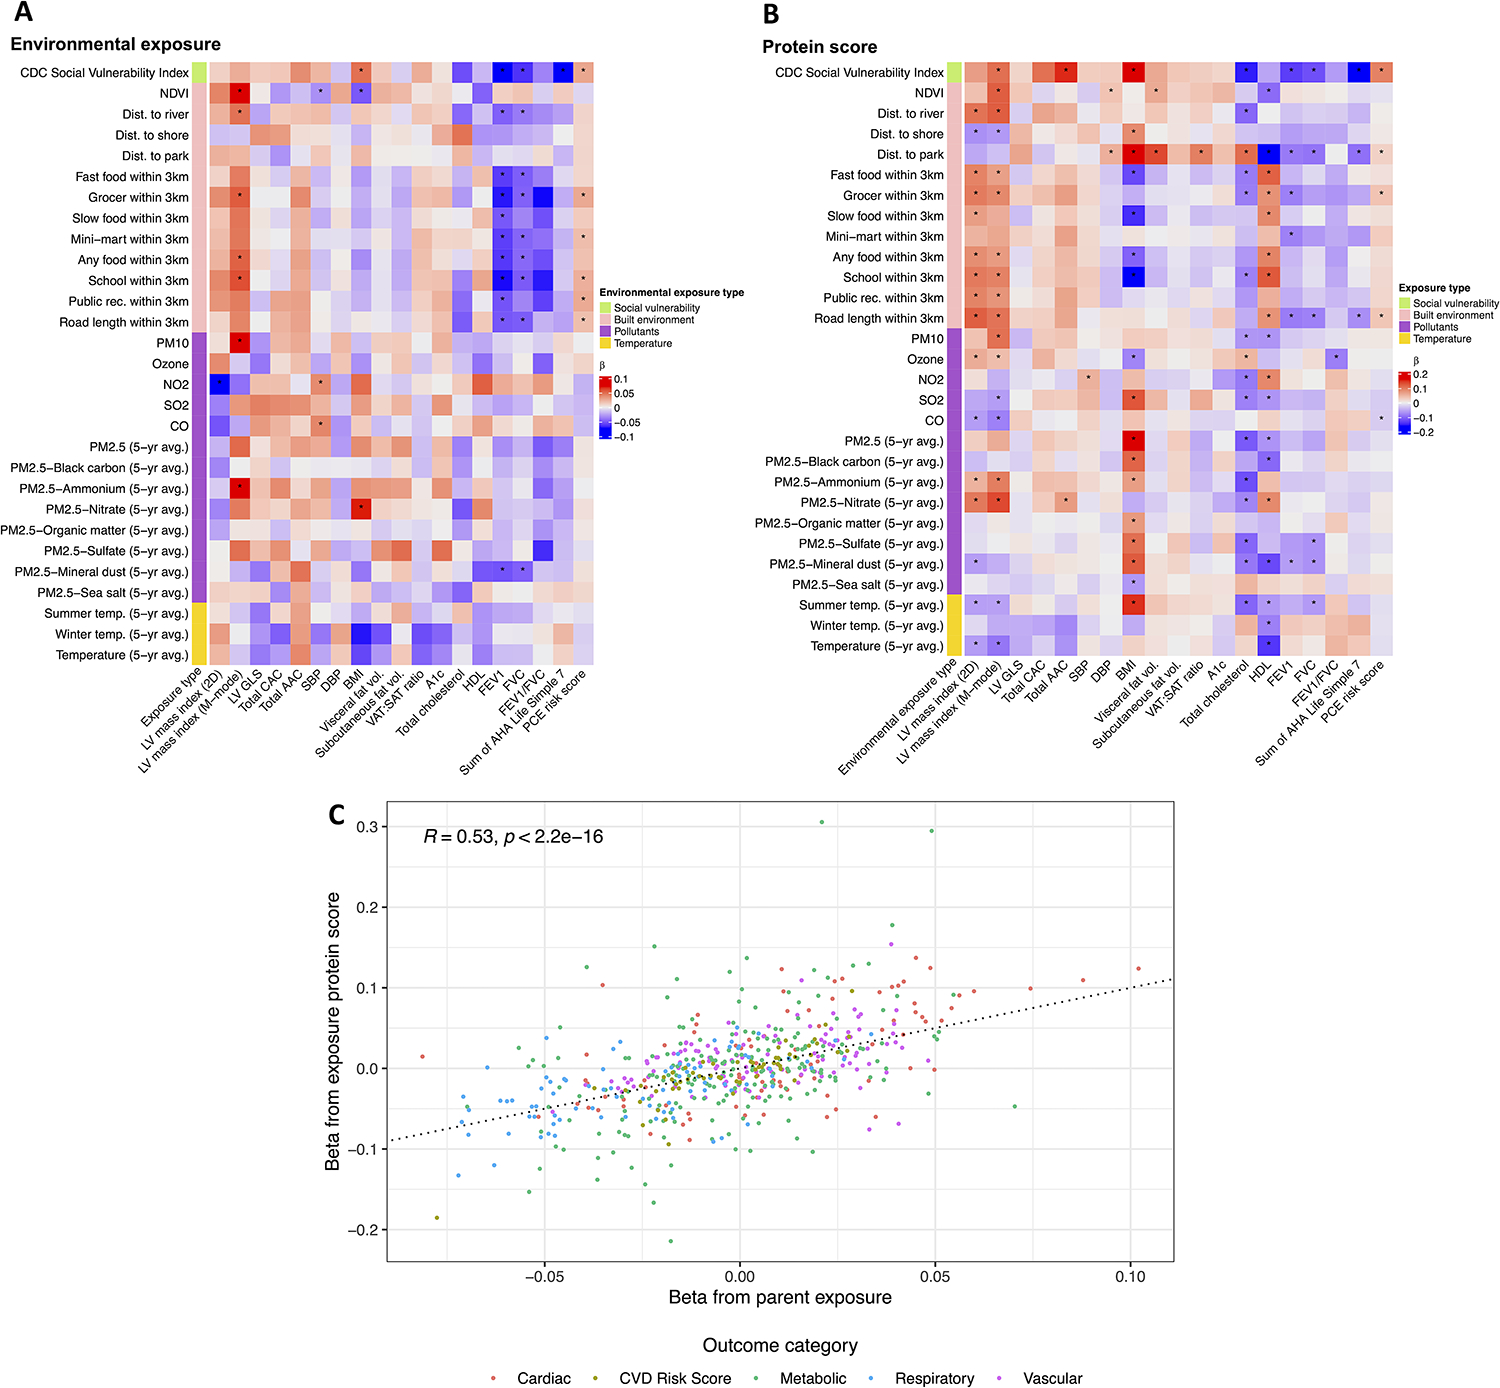
Heatmap of beta coefficients for cardiometabolic and respiratory phenotypes as a function of the environmental exposure (A) or protein score (B) in the entire CARDIA dataset. Phenotype measures from the Year 25 exam are used, except for FEV1, FVC and FEV1/FVC ratio which were measured at Year 30. Protein scores and continuous phenotypes were standardized to mean 0, and variance 1, for use in models. Models were adjusted for age, sex, race, center, BMI, systolic and diastolic blood pressure, anti-hypertensive medication use, diabetes, lifetime pack-years of smoking, estimated glomerular filtration rate, total cholesterol and high-density lipoprotein. Models for cholesterol/lipoproteins were also adjusted for lipid-lowering medication use. For models where the outcome was part of the adjustments (e.g., BMI) the outcome was removed from the adjustments. (C) Comparison of regression coefficients for CMD-exposure vs. CMD-proteomic signature of exposure across the entire CARDIA sample, demonstrating significant variability in association magnitude. Color represents the model outcome: cardiac (LV mass, GLS), vascular (CAC, AAC, SBP, DBP), metabolic (BMI, VAT, SAT, VAT:SAT, HbA1c, total cholesterol, HDL), respiratory (FEV1, FVC, FEV1/FVC), and CVD risk scores (AHA Life Simple 7, pooled cohort equation). CDC = Centers for Disease Control and Prevention; NDVI = normalized difference vegetation index; Dist. = distance; NO2 = nitrogen dioxide; SO2 = sulfur dioxide; CO = carbon monoxide; PM10 = particulate matter with median diameter < 10 μm; PM2.5 = particulate matter with median diameter < 2.5 μm; avg. = average; temp. = temperature. LV = left ventricular; GLS = global longitudinal strain; CAC = coronary artery calcification; AAC = abdominal aortic calcification; vol. = volume; VAT = visceral abdominal tissue; SAT = subcutaneous abdominal tissue; SBP = systolic blood pressure; DBP = diastolic blood pressure; BMI = body mass index; HDL = high-density lipoprotein; FEV1 = forced expiratory volume in 1 second; FVC = forced vital capacity; AHA = American Heart Association; PCE = pooled cohort equation.
*false discovery rate <5% (Benjamini-Hochberg
Human proteome-envirome relations implicate broad pathways relevant to CMD
We next explored molecular pathways associated with environmental exposures (via their proteomic relations; Figure 4). Overall, proteomic association with air pollution, climate, or built environment included broad pathways of angiogenesis and endothelial survival (VEGFA-VEGFR2), regulation of cell growth (EGF-EGFR, PI3K-Akt signaling pathways), and inflammatory and adaptive immunity (Figure 4). While a deep survey per-protein exposition is out of scope for this report, we did note overlap across environmental exposures in pathways relevant to CMD that were consistent with the pathway analysis. For example, proteins related to the built environment included downstream mediators of broad fibrosis and immune signaling pathways, including TGF-beta signaling (SMAD2/343), PI3K signaling (GSK3A/B44), innate immunity (STAT345), MAP kinase signaling (MAPKAPK246, MAPK10), and mitochondrial function and oxidative stress (PRDX347). Moreover, top proteins related to pollution exposures (specifically PM2.5) were in pathways of DNA damage repair (APEX148, a main AP endonuclease; RECQL49), mitochondrial metabolism (COQ950), proteins at the lung-pollutant interface (pulmonary surfactant-associated protein D, STFPD51), inflammation, and transcriptional/translational processing (ribosomal and nuclear proteins). Both unbiased analysis and per-protein review did not suggest a predominant pathway signature of the social vulnerability proteome but did include several mediators previously implicated in CMD pathogenesis (GDF1552, RARRES253, and THBS254, among them). Molecular pathways implicated by temperature appeared analogous to the pollution and built environmental proteome, likely reflecting some correlation between measures of temperature, elements of pollution, and built structures (Figure 1B).
Proteomics of environmental exposure and CMD in two geographically distinct centers
We selected representative proteomic signatures from each exposure category based on its relations with CMD phenotypes in CARDIA (Figure 3B) and tested their relations with CMD and respiratory phenotypes and long-term outcomes in 2 external cohorts. As the proteomic coverage in FHS and JHS differed from CARDIA, translation of the proteomic scores required recalibration (for details regarding the composition of these recalibrated proteomic signatures please refer to Data Supplement SD08). After comprehensive adjustment in both FHS and JHS, we observed similar patterns as in CARDIA, specifically with the proteomic correlates of social vulnerability and distances to green spaces related to CMD and respiratory phenotypes (FEV1, FVC) (Figure 5). Over a median follow-up of 13.6 years (25th-75th percentile 12.1–14.6 years), we observed 248 deaths and 212 CVD events in JHS; in FHS, over a median follow up of 23.3 years (25th-75th percentile 13.8–26.5 years) there were 683 deaths and 573 CVD events. Models with age and sex adjustment (Model 1) demonstrated the relations of protein scores of greenspaces and social vulnerability with CVD and its composite with mortality in both geographies, with directionally consistent associations with air pollution metrics and higher summer temperatures (Figure 5; Supplemental Table 5). The association between a protein score of social vulnerability and outcome was robust to multivariable adjustment (BMI, smoking, diabetes, anti-hypertensive medication use, systolic blood pressure, total and high-density lipoprotein cholesterol; Model 2), with distances to greenspaces, higher summer temperatures, and air pollution exhibiting directionally consistent effect size.
Figure 5: Relations of protein scores with cardiometabolic and respiratory phenotypes, and outcomes in FHS and JHS.

(A) Representative protein scores (predictors) from each exposure category were examined in FHS and JHS for their relations with cardiometabolic and respiratory phenotypes (outcomes) in linear models adjusted for age, sex, BMI, smoking, diabetes, use of anti-hypertensive medications, systolic blood pressure, total cholesterol, and HDL. (B) Protein scores were entered into Cox regression models for incident CVD (left) and incident CVD plus all-cause death (right). The CDC Social Vulnerability Index (SVI) protein score was consistently related to outcomes in both FHS and JHS, robust to adjustment for traditional CVD risk factors. Definitions of incident CVD for FHS and JHS are reported in Methods. Model 1 is adjusted for age and sex. Model 2 is further adjusted for BMI, smoking, diabetes, use of anti-hypertensive medication, systolic blood pressure, total cholesterol, and HDL. Protein score composition is reported in Data Supplement SD08, and full Cox model results are reported in Supplemental Table 5. CDC = Centers for Disease Control and Prevention; dist. = distance; avg. = average; temp. = temperature; LV = left ventricular; CAC = coronary artery calcification; AAC = abdominal aortic calcification; BMI = body mass index; VAT = visceral abdominal tissue; SAT = subcutaneous abdominal tissue; HDL = high-density lipoprotein; FEV1 = forced expiratory volume in 1 second; FVC = forced vital capacity; PCE = pooled cohort equation.
*false discovery rate <5% (Benjamini-Hochberg)
The robust association of the proteomic score of social vulnerability with outcomes in JHS led us to explore its relations with neighborhood-level factors uniquely captured in that study (Figure 6). At the population level, a protein score for social vulnerability was associated with more neighborhood violence, poverty, neighborhood problems (e.g., excessive noise, heavy traffic, and litter), lower socioeconomic status, and social cohesion.
Figure 6: Relations of neighborhood factors with the protein score of CDC Social Vulnerability Index.

Provided the relation of SVI protein score with incident CVD and death, we further explored the relationship between the protein score and neighborhood factors available in JHS. The figure presents beta coefficients from models where the SVI protein score is the outcome and the neighborhood factor is the predictor, adjusted for age and sex. Dot size reflects the variance explained in the SVI protein score by the neighborhood factor using a type 1 ANOVA test with age and sex having priority in accounting for variance. Error bars are 1.96 x the standard error of the beta estimate. Faded items have a p value ≥0.05.
DISCUSSION
Here, we examined the relations between a human envirome composed of built, natural, and social environments across four American cities with a broad circulating proteome to define host biochemical profiles of environmental exposure and their links to CMD. Proteins related to measured environmental exposures specified shared pathways of cellular resilience, including angiogenesis, cell growth and turnover, and inflammation. Multivariable proteomic signatures of tested environmental exposures exhibited a wide range of fit (social vulnerability and select measures of air pollution displayed best fit) and they were consistently associated with key CMD phenotypes and subclinical measures of CVD, including cardiac hypertrophy, adiposity, and pulmonary function, robust to adjustment for standard risk factors and geography. Furthermore, in two geographically distinct populations (JHS and FHS), we observed relations between protein scores of each environmental exposure category (specifically social vulnerability) with CMD phenotypes and long-term CVD and mortality. Collectively, these results provide insight into joint variation between the natural, social, and built environment with the host proteome and its ramification on long-term cardiac health.
The human envirome has expanded over the last two decades to include a growing number of factors linked to human disease (stress/lifestyle, infectious disease, diet/activity, built and social environments, pollution, climate, among others)55,56. There has been substantial progress in linking the envirome to CVD risk at a population level, highlighting the fundamental importance of and complexity in how the environment affects biochemical underpinnings of cardiometabolic risk. It is increasingly recognized that structural factors (e.g., rurality, social determinants of health linked to healthcare disparity), geography, policy, and community investment may influence environmental exposures and underlying risk. Certainly, environmental exposures do not act in isolation, contributing complexity to disentangling their joint effects. Identifying biochemical and phenotypic features that contribute to “allostasis”—an individual’s metabolic resilience to environmental stress—has been offered to approach an actionable endophenotype of external exposures57 (e.g., with epidemiologic, epigenetic, and transcriptional studies of air pollution58–60 and heavy metal studies of obesity and hypertension61–64). In addition, most studies have focused on molecules in biofluids that directly reflect external exposure (e.g., microplastics, disinfectants, pesticides)65–72, not necessarily capturing a broad host biological response to these exposures. Finally, model system studies have offered important insights into potential mechanisms73, though whether their findings apply to broader geographically diverse populations in the real world remains less unclear.
The results of our study address these opportunities by providing a biological context to several key epidemiologic observations of the environment and CMD. From the broadest perspective, we observed pathway overlap across multiple domains of environmental exposure, principally involving axes of inflammation and immune activation, tissue remodeling and angiogenesis, mitochondrial function, and cell growth and signaling, consistent with phenotypic associations (fully adjusted) observed here that implicated proteomics of each environmental exposure in CMD. Indeed, these provide some biological rationale for prior observations linking certain exposures (e.g., greenness, air pollution) to CMD and its underlying mechanisms74,75. Strikingly, PM2.5 exposure was linked to pathways of DNA damage and transcriptional and protein turnover, consistent with data from model systems suggesting the impact of PM2.5 exposure on DNA damage via increased oxidative stress and free radical production73. Moreover, exposure to air pollution has been linked to pre- and post-transcriptional gene regulation (via rmethylation76 or non-coding RNA77), consistent with its association with proteins involved in transcription observed here. In this context, we observed the association of pulmonary surfactant-associated protein D (STFPD) with air pollution measures, consistent with the potential modulation of surfactant biology directly by air pollution78. While these findings are observational and subject to confounding, the biological consistency between epidemiologic findings and biological observations (e.g., DNA damage) and pathway consistency between CMD pathogenesis and the environmental proteome is strongly suggestive of direct links warranting further study.
A key limitation of this study is the assessment of the proteome and the envirome at the same exam cycle in CARDIA, limiting any inference related to causality (“reverse” causation). Social determinants, community-individual resources, and access to healthy living spaces exhibit complex, critical interactions (e.g., rurality, social vulnerability, availability of health care) broadly linked to risk factor development79, CVD, and mortality80,81, even from a young age82. Indeed, a bidirectional relation between community-level social vulnerability and an individual’s health within that community is likely to exist, such that individuals residing in less resourced and more vulnerable areas may suffer from more adverse environmental exposure and higher chronic disease burden83. Proteomics of the environmental exposure, in this case, may reflect the exposure and greater disease susceptibility. Mediation approaches have been advanced to begin to address these issues, though they are complex in the setting of multivariate omics data. In addition, pathway analyses here may be limited given joint variation in exposures across CARDIA center and clinical risk factors (not necessarily related to exposures), introducing the potential for confounding. Certainly, as noted above for PM2.5, some proteomic associations may indeed be biologically plausible. Nevertheless, while “reverse causation” may challenge directional claims of causality among exposure, health, and the proteome, it does not detract from the notion that proteomics (1) provides a precision biomarker related to both the exposure and the health outcome at an individual level and (2) begins to underscore the joint importance of social determinants and the environment in CVD risk. Indeed, epidemiology has been a rich source of data in the exposome field84, and future studies that map molecular phenotypes to the exposome an early stage in development—at a point where significant confounding (by decades of aging and exposure) may not supervene—will be a critical next step.
Of note, we observed best fit in proteomic models for social vulnerability and the greatest transportability of this proteomic signature for outcomes in both JHS and FHS, highlighting its importance in CMD. Higher social vulnerability—reflecting decreased community resourcing and resilience to natural, biological, or man-made emergencies (e.g., extreme weather, pandemic, floods, etc.)—has been linked to increased mortality and chronic disease burden85, obesity (as early as childhood86), and CVD death81. The association between the social vulnerability index with proteins reflecting inflammation, oxidative stress, and fibrosis—and the downstream relation of this proteome to phenotypes and/or outcomes in CARDIA, JHS, and FHS—suggest the importance of social determinants and community resourcing in CMD development. Importantly, in JHS, we observed associations between host proteomics of social vulnerability and neighborhood-level variables of cohesion, violence, noise, and poverty. These associations are consistent with reports linking this category of community-level exposures to heart disease30 and support calls for enhanced community investment to interrupt CMD in at-risk communities.
The implications of our work should be viewed in the context of its design. Our study was a cross-sectional analysis of host proteomics and environmental exposure across four field centers. Variability across geographically distinct field centers was a unique feature that enabled variability in the envirome to facilitate regression with proteomics. Nevertheless, we attempted to address potential confounding due to differences in sociodemographic and clinical indices across centers in regression, though residual confounding remains possible. We used broad measures of the envirome which facilitates replication which are crude estimates of individual-level exposure. Future studies with serial measures and the inclusion of personal-level metrics (e.g., activity and dietary trends) would be helpful. Use of seasonal averages for temperature (e.g., 5-year summer average) may dilute extreme exposures and reduce meaningful differences in exposure to extreme weather. In addition, inclusion of additional environmental exposures (e.g., water pollution) would likely yield meaningful insights. With adjustment for sources of confounding thought to influence the proteome, we interpreted proteome-envirome relations as reflecting a “host profile” related to the environment. We are careful not to claim this is a true “response” to the environment, as there is no perturbation and pre- and post-proteomic/environmental measures. Nevertheless, it is important to note that randomized studies at large scale with perturbation in the environment are challenging in humans, and the pathways observed here are biologically consistent with smaller studies (e.g., air pollution). The pathway analysis is limited by the breadth of proteins surveyed, may be confounded by differences in clinical characteristics across center, and those results should be viewed as exploratory but does support the hypothesis that exposures are related to inflammation, angiogenesis, and cell cycle regulation. While the multivariable fit of proteomics to the environment is weak, it is in the range of genomic phenotypic predictors (≈10% variance explained), and the relations of each proteomic signature to phenotypes were stronger than the parent environmental exposure. The breadth of circulating proteins quantified in FHS and JHS (≈1300) was considerably smaller than in CARDIA (≈7000), requiring model recalibration. Importantly, our goal was not to identify surrogate measures of the envirome but rather to identify potential protein correlates. In that regard, there are concerns about the specificity of aptamer-based methods87. Future studies incorporating a range of circulating molecules (proteomics, metabolomics, transcriptomics etc.) with precision exposure phenotyping in very large populations are necessary to elucidate molecular mediators, and their complex interactions, along the pathway of exposure to disease.
In conclusion, in a large community-based cohort of American adults, we employed broad host proteomics to define correlates of broad environmental exposures (the human “envirome”), demonstrating their relation to CMD phenotypes, biology, and long-term CMD outcomes in companion studies. These studies suggest a plausible framework for a serial tissue and circulating multi-omic study that integrates a broader human exposome with comprehensive biochemical readouts of exposure and disease susceptibility over time to examine the dynamic impact of the environment on human cardiometabolic health.
Supplementary Material
NOVELTY AND SIGNIFICANCE.
What Is Known?
Environmental exposures can have a physiologic impact on metabolism and heart disease.
Broad population-based studies linking environmental exposure, high-dimensional molecular profiling, and cardiometabolic disease are not widely reported.
What New Information Does This Article Contribute?
The relation between host cardiometabolic disease and the human “envirome” may be reflected in the circulating proteome, with pathways plausibly related to cardiometabolic disease.
Proteomics of exposure were broadly related to cardiometabolic phenotypes, incident cardiovascular disease, and mortality.
While it is widely known that environmental exposures can impact human health, molecular markers to characterize these exposures are not well defined. Integrating broad molecular profiling with environmental exposures in 4 geographically distinct areas, we identified new and established pathways implicated in cardiometabolic disease development. Proteomic signatures of environmental exposures were related to cardiometabolic phenotypes and development of cardiovascular disease.
SOURCES OF FUNDING
This work was supported by the American Heart Association (20SFRN35120123). FHS is supported by the National Heart, Lung, and Blood Institute (NHLBI) at the National Institutes of Health (NIH; contracts N01-HC-25195, HHSN268201500001I, and 75N92019D00031). JHS is supported and conducted in collaboration with Jackson State University (HHSN268201800013I), Tougaloo College (HHSN268201800014I), the Mississippi State Department of Health (HHSN268201800015I) and the University of Mississippi Medical Center (HHSN268201800010I, HHSN268201800011I and HHSN268201800012I) contracts from the NHLBI and the National Institute on Minority Health and Health Disparities (NIMHD). The authors also wish to thank the staff and participants of the JHS. Support for proteomic quantification in JHS was provide by a grant to Dr. Robert Gerszten from the NHLBI (R01HL133870). CARDIA is conducted and supported by the NHLBI in collaboration with the University of Alabama at Birmingham (HHSN268201800005I & HHSN268201800007I), Northwestern University (HHSN268201800003I), University of Minnesota (HHSN268201800006I), and Kaiser Foundation Research Institute (HHSN268201800004I). Support for quantification of the human envirome in CARDIA was provided in part by grants awarded to Dr. Kai Zhang and Dr. Lifang Hou from the American Heart Association (19TPA34830085) and the National Institute of Aging (R01AG081244). Proteomics quantification was funded by the NHLBI (HL122477; PI Kalhan). This manuscript has been reviewed by CARDIA for scientific content. The views expressed in this manuscript are those of the authors and do not necessarily represent the views of the NHLBI; the NIH; or the U.S. Department of Health and Human Services.
DISCLOSURES
R.V.S. and V.L.M. have received grant support from Siemens Healthineers, NIDDK, NIA, NHLBI and AHA. V.L.M. has received other research support from NIVA Medical Imaging Solutions. V.L.M.owns stock in Eli Lilly, Johnson & Johnson, Merck, Bristo-Myers Squibb, Pfizer and stock options in Ionetix. V.L.M. has received research grants and speaking honoraria from Quart Medical. M.N. received speaking honoraria from Cytokinetics. M.N. is supported by the NIH and by a Career Investment Award from the Department of Medicine, Boston University School of Medicine. B.C. is supported by the NIH and American Heart Association. M.B.R. is supported by the NIH and reports fees from the Conservation Law Foundation. R.V.S. has served as a consultant for Amgen, Cytokinetics, Myokardia, and Best Doctors. R.V.S. is a co-inventor on a patent for ex-RNAs signatures of cardiac remodeling.
Nonstandard Abbreviations and Acronyms
- CMD
cardiometabolic disease
- PM2.5
fine particulate matter with median diameter < 2.5 μm
- PM10
fine particulate matter with median diameter < 10 μm
- CARDIA
Coronary Artery Risk Development in Young Adults
- CVD
cardiovascular disease
- FHS
Framingham Heart Study
- JHS
Jackson Heart Study
- O3
ozone
- NO2
nitrogen dioxide
- SO2
sulfur dioxide
- CO
carbon monoxide
- EPA
Environmental Protection Agency
- NLDAS
North America Land Data Assimilation System
- NDVI
Normalized Difference Vegetation Index
- NASA
National Aeronautics and Space Administration
- MODIS
Moderate Resolution Imaging Spectroradiometer
- SVI
Social Vulnerability Index
- CDC
Centers for Disease Control and Prevention
- LASSO
least absolute shrinkage and selection operato
- FDR
false discovery rate
- HDL
high-density lipoprotein
- BMI
body mass index
Footnotes
The remaining authors have no disclosures.
REFERENCES
- 1.Papas MA, Alberg AJ, Ewing R, Helzlsouer KJ, Gary TL, Klassen AC. The built environment and obesity. Epidemiol Rev. 2007;29:129–143. doi: 10.1093/epirev/mxm009 [DOI] [PubMed] [Google Scholar]
- 2.Auchincloss AH, Diez Roux AV, Brown DG, Erdmann CA, Bertoni AG. Neighborhood resources for physical activity and healthy foods and their association with insulin resistance. Epidemiology. 2008;19:146–157. doi: 10.1097/EDE.0b013e31815c480 [DOI] [PubMed] [Google Scholar]
- 3.Li F, Harmer P, Cardinal BJ, Bosworth M, Johnson-Shelton D, Moore JM, Acock A, Vongjaturapat N. Built environment and 1-year change in weight and waist circumference in middle-aged and older adults: Portland Neighborhood Environment and Health Study. Am J Epidemiol. 2009;169:401–408. doi: 10.1093/aje/kwn398 [DOI] [PMC free article] [PubMed] [Google Scholar]
- 4.Li F, Harmer P, Cardinal BJ, Bosworth M, Johnson-Shelton D. Obesity and the built environment: does the density of neighborhood fast-food outlets matter? Am J Health Promot. 2009;23:203–209. doi: 10.4278/ajhp.071214133 [DOI] [PMC free article] [PubMed] [Google Scholar]
- 5.Bhatnagar A Environmental cardiology: studying mechanistic links between pollution and heart disease. Circ Res. 2006;99:692–705. doi: 10.1161/01.RES.0000243586.99701.cf [DOI] [PubMed] [Google Scholar]
- 6.Brook RD, Rajagopalan S, Pope CA 3rd, Brook JR, Bhatnagar A, Diez-Roux AV, Holguin F, Hong Y, Luepker RV, Mittleman MA, et al. Particulate matter air pollution and cardiovascular disease: An update to the scientific statement from the American Heart Association. Circulation. 2010;121:2331–2378. doi: 10.1161/CIR.0b013e3181dbece1 [DOI] [PubMed] [Google Scholar]
- 7.Lamas GA, Bhatnagar A, Jones MR, Mann KK, Nasir K, Tellez-Plaza M, Ujueta F, Navas-Acien A, American Heart Association Council on E, Prevention, et al. Contaminant Metals as Cardiovascular Risk Factors: A Scientific Statement From the American Heart Association. J Am Heart Assoc. 2023;12:e029852. doi: 10.1161/JAHA.123.029852 [DOI] [PMC free article] [PubMed] [Google Scholar]
- 8.Pope CA 3rd, Bhatnagar A, McCracken JP, Abplanalp W, Conklin DJ, O’Toole T. Exposure to Fine Particulate Air Pollution Is Associated With Endothelial Injury and Systemic Inflammation. Circ Res. 2016;119:1204–1214. doi: 10.1161/CIRCRESAHA.116.309279 [DOI] [PMC free article] [PubMed] [Google Scholar]
- 9.Krishnan RM, Adar SD, Szpiro AA, Jorgensen NW, Van Hee VC, Barr RG, O’Neill MS, Herrington DM, Polak JF, Kaufman JD. Vascular responses to long- and short-term exposure to fine particulate matter: MESA Air (Multi-Ethnic Study of Atherosclerosis and Air Pollution). J Am Coll Cardiol. 2012;60:2158–2166. doi: 10.1016/j.jacc.2012.08.973 [DOI] [PMC free article] [PubMed] [Google Scholar]
- 10.O’Toole TE, Hellmann J, Wheat L, Haberzettl P, Lee J, Conklin DJ, Bhatnagar A, Pope CA 3rd. Episodic exposure to fine particulate air pollution decreases circulating levels of endothelial progenitor cells. Circ Res. 2010;107:200–203. doi: 10.1161/CIRCRESAHA.110.222679 [DOI] [PMC free article] [PubMed] [Google Scholar]
- 11.Riggs DW, Yeager R, Conklin DJ, DeJarnett N, Keith RJ, DeFilippis AP, Rai SN, Bhatnagar A. Residential proximity to greenness mitigates the hemodynamic effects of ambient air pollution. Am J Physiol Heart Circ Physiol. 2021;320:H1102–H1111. doi: 10.1152/ajpheart.00689.2020 [DOI] [PMC free article] [PubMed] [Google Scholar]
- 12.Lehallier B, Gate D, Schaum N, Nanasi T, Lee SE, Yousef H, Moran Losada P, Berdnik D, Keller A, Verghese J, et al. Undulating changes in human plasma proteome profiles across the lifespan. Nat Med. 2019;25:1843–1850. doi: 10.1038/s41591-019-0673-2 [DOI] [PMC free article] [PubMed] [Google Scholar]
- 13.Ferkingstad E, Sulem P, Atlason BA, Sveinbjornsson G, Magnusson MI, Styrmisdottir EL, Gunnarsdottir K, Helgason A, Oddsson A, Halldorsson BV, et al. Large-scale integration of the plasma proteome with genetics and disease. Nat Genet. 2021;53:1712–1721. doi: 10.1038/s41588-021-00978-w [DOI] [PubMed] [Google Scholar]
- 14.Wagenknecht LE, Perkins LL, Cutter GR, Sidney S, Burke GL, Manolio TA, Jacobs DR Jr., Liu, Friedman, Hughes, et al. Cigarette smoking behavior is strongly related to educational status: the CARDIA study. Preventive medicine. 1990;19:158–169. [DOI] [PubMed] [Google Scholar]
- 15.Dyer AR, Cutter GR, Liu KQ, Armstrong MA, Friedman GD, Hughes GH, Dolce JJ, Raczynski J, Burke G, Manolio T. Alcohol intake and blood pressure in young adults: the CARDIA Study. Journal of clinical epidemiology. 1990;43:1–13. [DOI] [PubMed] [Google Scholar]
- 16.Bild DE, Jacobs DR Jr., Sidney S, Haskell WL, Anderssen N, Oberman A. Physical activity in young black and white women. The CARDIA Study. Ann Epidemiol. 1993;3:636–644. [DOI] [PubMed] [Google Scholar]
- 17.Sidney S, Jacobs DR Jr., Haskell WL, Armstrong MA, Dimicco A, Oberman A, Savage PJ, Slattery ML, Sternfeld B, Van Horn L. Comparison of two methods of assessing physical activity in the Coronary Artery Risk Development in Young Adults (CARDIA) Study. Am J Epidemiol. 1991;133:1231–1245. [DOI] [PubMed] [Google Scholar]
- 18.Carr JJ, Jacobs DR Jr., Terry JG, Shay CM, Sidney S, Liu K, Schreiner PJ, Lewis CE, Shikany JM, Reis JP, Goff DC Jr. Association of Coronary Artery Calcium in Adults Aged 32 to 46 Years With Incident Coronary Heart Disease and Death. JAMA cardiology. 2017;2:391–399. doi: 10.1001/jamacardio.2016.5493 [DOI] [PMC free article] [PubMed] [Google Scholar]
- 19.Shah RV, Murthy VL, Colangelo LA, Reis J, Venkatesh BA, Sharma R, Abbasi SA, Goff DC Jr., Carr JJ, Rana JS, et al. Association of Fitness in Young Adulthood With Survival and Cardiovascular Risk: The Coronary Artery Risk Development in Young Adults (CARDIA) Study. JAMA internal medicine. 2016;176:87–95. doi: 10.1001/jamainternmed.2015.6309 [DOI] [PMC free article] [PubMed] [Google Scholar]
- 20.Brittain EL, Nwabuo C, Xu M, Gupta DK, Hemnes AR, Moreira HT, De Vasconcellos HD, Terry JG, Carr JJ, Lima JA. Echocardiographic Pulmonary Artery Systolic Pressure in the Coronary Artery Risk Development in Young Adults (CARDIA) Study: Associations With Race and Metabolic Dysregulation. Journal of the American Heart Association. 2017;6. doi: 10.1161/JAHA.116.005111 [DOI] [PMC free article] [PubMed] [Google Scholar]
- 21.Kishi S, Reis JP, Venkatesh BA, Gidding SS, Armstrong AC, Jacobs DR Jr., Sidney S, Wu CO, Cook NL, Lewis CE, et al. Race-ethnic and sex differences in left ventricular structure and function: the Coronary Artery Risk Development in Young Adults (CARDIA) Study. Journal of the American Heart Association. 2015;4:e001264. doi: 10.1161/JAHA.114.001264 [DOI] [PMC free article] [PubMed] [Google Scholar]
- 22.Kishi S, Armstrong AC, Gidding SS, Colangelo LA, Venkatesh BA, Jacobs DR Jr., Carr JJ, Terry JG, Liu K, Goff DC Jr., Lima JA. Association of obesity in early adulthood and middle age with incipient left ventricular dysfunction and structural remodeling: the CARDIA study (Coronary Artery Risk Development in Young Adults). JACC Heart failure. 2014;2:500–508. doi: 10.1016/j.jchf.2014.03.001 [DOI] [PMC free article] [PubMed] [Google Scholar]
- 23.Gidding SS, Rana JS, Prendergast C, McGill H, Carr JJ, Liu K, Colangelo LA, Loria CM, Lima J, Terry JG, et al. Pathobiological Determinants of Atherosclerosis in Youth (PDAY) Risk Score in Young Adults Predicts Coronary Artery and Abdominal Aorta Calcium in Middle Age: The CARDIA Study. Circulation. 2016;133:139–146. doi: 10.1161/CIRCULATIONAHA.115.018042 [DOI] [PMC free article] [PubMed] [Google Scholar]
- 24.Kannel WB, Feinleib M, McNamara PM, Garrison RJ, Castelli WP. An investigation of coronary heart disease in families. The Framingham offspring study. Am J Epidemiol. 1979;110:281–290. doi: 10.1093/oxfordjournals.aje.a112813 [DOI] [PubMed] [Google Scholar]
- 25.Nayor M, Short MI, Rasheed H, Lin H, Jonasson C, Yang Q, Hveem K, Felix JF, Morrison AC, Wild PS, et al. Aptamer-Based Proteomic Platform Identifies Novel Protein Predictors of Incident Heart Failure and Echocardiographic Traits. Circ Heart Fail. 2020;13:e006749. doi: 10.1161/CIRCHEARTFAILURE.119.006749 [DOI] [PMC free article] [PubMed] [Google Scholar]
- 26.Levy D, Garrison RJ, Savage DD, Kannel WB, Castelli WP. Left ventricular mass and incidence of coronary heart disease in an elderly cohort. The Framingham Heart Study. Ann Intern Med. 1989;110:101–107. [DOI] [PubMed] [Google Scholar]
- 27.Levy D, Garrison RJ, Savage DD, Kannel WB, Castelli WP. Prognostic implications of echocardiographically determined left ventricular mass in the Framingham Heart Study. N Engl J Med. 1990;322:1561–1566. doi: 10.1056/NEJM199005313222203 [DOI] [PubMed] [Google Scholar]
- 28.Shah RV, Yeri AS, Murthy VL, Massaro JM, D’Agostino R Sr., Freedman JE, Long MT, Fox CS, Das S, Benjamin EJ, et al. Association of Multiorgan Computed Tomographic Phenomap With Adverse Cardiovascular Health Outcomes: The Framingham Heart Study. JAMA Cardiol. 2017;2:1236–1246. doi: 10.1001/jamacardio.2017.3145 [DOI] [PMC free article] [PubMed] [Google Scholar]
- 29.D’Agostino RB Sr., Vasan RS, Pencina MJ, Wolf PA, Cobain M, Massaro JM, Kannel WB. General cardiovascular risk profile for use in primary care: the Framingham Heart Study. Circulation. 2008;117:743–753. doi: 10.1161/CIRCULATIONAHA.107.699579 [DOI] [PubMed] [Google Scholar]
- 30.Barber S, Hickson DA, Wang X, Sims M, Nelson C, Diez-Roux AV. Neighborhood Disadvantage, Poor Social Conditions, and Cardiovascular Disease Incidence Among African American Adults in the Jackson Heart Study. Am J Public Health. 2016;106:2219–2226. doi: 10.2105/AJPH.2016.303471 [DOI] [PMC free article] [PubMed] [Google Scholar]
- 31.Keku E, Rosamond W, Taylor HA, Garrison R, Wyatt SB, Richard M, Jenkins B, Reeves L, Sarpong D. Cardiovascular Disease Event Classification in the Jackson Heart Study Methods and Procedures. Ethnicity & Disease. 2005;15:62–70. [PubMed] [Google Scholar]
- 32.van Donkelaar A, Martin RV, Spurr RJ, Burnett RT. High-Resolution Satellite-Derived PM2.5 from Optimal Estimation and Geographically Weighted Regression over North America. Environ Sci Technol. 2015;49:10482–10491. [DOI] [PubMed] [Google Scholar]
- 33.Weagle CL, Snider G, Li C, van Donkelaar A, Philip S, Bissonnette P, Burke J, Jackson J, Latimer R, Stone E, et al. Global Sources of Fine Particulate Matter: Interpretation of PM2.5 Chemical Composition Observed by SPARTAN using a Global Chemical Transport Model. Environmental Science & Technology. 2018;52:11670–11681. doi: 10.1021/acs.est.8b01658 [DOI] [PubMed] [Google Scholar]
- 34.US EPA. Air Quality System. https://www.epa.gov/aqs. 2019. Accessed January 15.
- 35.Kumar N, Liang D, Comellas A, Chu AD, Abrams T. Satellite-based PM concentrations and their application to COPD in Cleveland, OH. J Expos Sci Environ Epidemiol. 2013;23:637–646. doi: 10.1038/jes.2013.52 [DOI] [PMC free article] [PubMed] [Google Scholar]
- 36.Rodell M. LDAS | Land Data Assimilation Systems. NASA; 2018. [Google Scholar]
- 37.Flanagan BE, Gregory EW, Hallisey EJ, Heitgerd JL, Lewis B. A Social Vulnerability Index for Disaster Management. Journal of Homeland Security and Emergency Management. 2011;8. doi: doi: 10.2202/1547-7355.1792 [DOI] [Google Scholar]
- 38.Boone-Heinonen J, Gordon-Larsen P, Kiefe CI, Shikany JM, Lewis CE, Popkin BM. Fast Food Restaurants and Food Stores: Longitudinal Associations With Diet in Young to Middle-aged Adults: The CARDIA Study. Archives of Internal Medicine. 2011;171:1162–1170. doi: 10.1001/archinternmed.2011.283 [DOI] [PMC free article] [PubMed] [Google Scholar]
- 39.Katz DH, Tahir UA, Ngo D, Benson MD, Gao Y, Shi X, Nayor M, Keyes MJ, Larson MG, Hall ME, et al. Multiomic Profiling in Black and White Populations Reveals Novel Candidate Pathways in Left Ventricular Hypertrophy and Incident Heart Failure Specific to Black Adults. Circ Genom Precis Med. 2021;14:e003191. doi: 10.1161/CIRCGEN.120.003191 [DOI] [PMC free article] [PubMed] [Google Scholar]
- 40.Wu T, Hu E, Xu S, Chen M, Guo P, Dai Z, Feng T, Zhou L, Tang W, Zhan L, et al. clusterProfiler 4.0: A universal enrichment tool for interpreting omics data. Innovation (Camb). 2021;2:100141. doi: 10.1016/j.xinn.2021.100141 [DOI] [PMC free article] [PubMed] [Google Scholar]
- 41.Martens M, Ammar A, Riutta A, Waagmeester A, Slenter Denise N, Hanspers K, A. Miller R, Digles D, Lopes Elisson N, Ehrhart F, et al. WikiPathways: connecting communities. Nucleic Acids Research. 2020;49:D613–D621. doi: 10.1093/nar/gkaa1024 [DOI] [PMC free article] [PubMed] [Google Scholar]
- 42.Kuhn M. Building Predictive Models in R Using the caret Package. Journal of Statistical Software. 2008;28:1–26. doi: 10.18637/jss.v028.i0527774042 [DOI] [Google Scholar]
- 43.Schmierer B, Hill CS. TGFbeta-SMAD signal transduction: molecular specificity and functional flexibility. Nat Rev Mol Cell Biol. 2007;8:970–982. doi: 10.1038/nrm2297 [DOI] [PubMed] [Google Scholar]
- 44.Hermida MA, Dinesh Kumar J, Leslie NR. GSK3 and its interactions with the PI3K/AKT/mTOR signalling network. Adv Biol Regul. 2017;65:5–15. doi: 10.1016/j.jbior.2017.06.003 [DOI] [PubMed] [Google Scholar]
- 45.Hillmer EJ, Zhang H, Li HS, Watowich SS. STAT3 signaling in immunity. Cytokine Growth Factor Rev. 2016;31:1–15. doi: 10.1016/j.cytogfr.2016.05.001 [DOI] [PMC free article] [PubMed] [Google Scholar]
- 46.Soni S, Anand P, Padwad YS. MAPKAPK2: the master regulator of RNA-binding proteins modulates transcript stability and tumor progression. J Exp Clin Cancer Res. 2019;38:121. doi: 10.1186/s13046-019-1115-1 [DOI] [PMC free article] [PubMed] [Google Scholar]
- 47.Sonn SK, Song EJ, Seo S, Kim YY, Um JH, Yeo FJ, Lee DS, Jeon S, Lee MN, Jin J, et al. Peroxiredoxin 3 deficiency induces cardiac hypertrophy and dysfunction by impaired mitochondrial quality control. Redox Biol. 2022;51:102275. doi: 10.1016/j.redox.2022.102275 [DOI] [PMC free article] [PubMed] [Google Scholar]
- 48.Li J, Zhao H, McMahon A, Yan S. APE1 assembles biomolecular condensates to promote the ATR-Chk1 DNA damage response in nucleolus. Nucleic Acids Res. 2022;50:10503–10525. doi: 10.1093/nar/gkac853 [DOI] [PMC free article] [PubMed] [Google Scholar]
- 49.Sharma S, Sommers JA, Choudhary S, Faulkner JK, Cui S, Andreoli L, Muzzolini L, Vindigni A, Brosh RM Jr. Biochemical analysis of the DNA unwinding and strand annealing activities catalyzed by human RECQ1. J Biol Chem. 2005;280:28072–28084. doi: 10.1074/jbc.M500264200 [DOI] [PubMed] [Google Scholar]
- 50.Lohman DC, Forouhar F, Beebe ET, Stefely MS, Minogue CE, Ulbrich A, Stefely JA, Sukumar S, Luna-Sanchez M, Jochem A, et al. Mitochondrial COQ9 is a lipid-binding protein that associates with COQ7 to enable coenzyme Q biosynthesis. Proc Natl Acad Sci U S A. 2014;111:E4697–4705. doi: 10.1073/pnas.1413128111 [DOI] [PMC free article] [PubMed] [Google Scholar]
- 51.Hoffmann-Petersen B, Suffolk R, Petersen JJH, Petersen TH, Brasch-Andersen C, Host A, Halken S, Sorensen GL, Agertoft L. Association of serum surfactant protein D and SFTPD gene variants with asthma in Danish children, adolescents, and young adults. Immun Inflamm Dis. 2022;10:189–200. doi: 10.1002/iid3.560 [DOI] [PMC free article] [PubMed] [Google Scholar]
- 52.Rochette L, Dogon G, Zeller M, Cottin Y, Vergely C. GDF15 and Cardiac Cells: Current Concepts and New Insights. Int J Mol Sci. 2021;22. doi: 10.3390/ijms22168889 [DOI] [PMC free article] [PubMed] [Google Scholar]
- 53.Er LK, Hsu LA, Juang JJ, Chiang FT, Teng MS, Tzeng IS, Wu S, Lin JF, Ko YL. Circulating Chemerin Levels, but not the RARRES2 Polymorphisms, Predict the Long-Term Outcome of Angiographically Confirmed Coronary Artery Disease. Int J Mol Sci. 2019;20. doi: 10.3390/ijms20051174 [DOI] [PMC free article] [PubMed] [Google Scholar]
- 54.Lee CH, Wu MZ, Lui D, Fong C, Ren QW, Yu SY, Yuen M, Chow WS, Huang JY, Xu A, et al. Prospective associations of circulating thrombospondin-2 level with heart failure hospitalization, left ventricular remodeling and diastolic function in type 2 diabetes. Cardiovasc Diabetol. 2022;21:231. doi: 10.1186/s12933-022-01646-x [DOI] [PMC free article] [PubMed] [Google Scholar]
- 55.Rappaport SM, Smith MT. Epidemiology. Environment and disease risks. Science. 2010;330:460–461. doi: 10.1126/science.1192603 [DOI] [PMC free article] [PubMed] [Google Scholar]
- 56.Bhatnagar A. Environmental Determinants of Cardiovascular Disease. Circ Res. 2017;121:162–180. doi: 10.1161/CIRCRESAHA.117.306458 [DOI] [PMC free article] [PubMed] [Google Scholar]
- 57.Logan AC, Prescott SL, Haahtela T, Katz DL. The importance of the exposome and allostatic load in the planetary health paradigm. J Physiol Anthropol. 2018;37:15. doi: 10.1186/s40101-018-0176-8 [DOI] [PMC free article] [PubMed] [Google Scholar]
- 58.Collaborators GBDCoD. Global, regional, and national age-sex-specific mortality for 282 causes of death in 195 countries and territories, 1980–2017: a systematic analysis for the Global Burden of Disease Study 2017. Lancet. 2018;392:1736–1788. doi: 10.1016/S0140-6736(18)32203-7 [DOI] [PMC free article] [PubMed] [Google Scholar]
- 59.Shi Y, Zhao T, Yang X, Sun B, Li Y, Duan J, Sun Z. PM(2.5)-induced alteration of DNA methylation and RNA-transcription are associated with inflammatory response and lung injury. Sci Total Environ. 2019;650:908–921. doi: 10.1016/j.scitotenv.2018.09.085 [DOI] [PubMed] [Google Scholar]
- 60.Wang H, Shen X, Liu J, Wu C, Gao J, Zhang Z, Zhang F, Ding W, Lu Z. The effect of exposure time and concentration of airborne PM(2.5) on lung injury in mice: A transcriptome analysis. Redox Biol. 2019;26:101264. doi: 10.1016/j.redox.2019.101264 [DOI] [PMC free article] [PubMed] [Google Scholar]
- 61.Padilla MA, Elobeid M, Ruden DM, Allison DB. An examination of the association of selected toxic metals with total and central obesity indices: NHANES 99–02. Int J Environ Res Public Health. 2010;7:3332–3347. doi: 10.3390/ijerph7093332 [DOI] [PMC free article] [PubMed] [Google Scholar]
- 62.Rothenberg SE, Korrick SA, Fayad R. The influence of obesity on blood mercury levels for U.S. non-pregnant adults and children: NHANES 2007–2010. Environ Res. 2015;138:173–180. doi: 10.1016/j.envres.2015.01.018 [DOI] [PMC free article] [PubMed] [Google Scholar]
- 63.Nie X, Wang N, Chen Y, Chen C, Han B, Zhu C, Chen Y, Xia F, Cang Z, Lu M, et al. Blood cadmium in Chinese adults and its relationships with diabetes and obesity. Environ Sci Pollut Res Int. 2016;23:18714–18723. doi: 10.1007/s11356-016-7078-2 [DOI] [PubMed] [Google Scholar]
- 64.Harlan WR, Landis JR, Schmouder RL, Goldstein NG, Harlan LC. Blood lead and blood pressure. Relationship in the adolescent and adult US population. JAMA. 1985;253:530–534. doi: 10.1001/jama.253.4.530 [DOI] [PubMed] [Google Scholar]
- 65.Gonzalez-Dominguez R, Jauregui O, Queipo-Ortuno MI, Andres-Lacueva C. Characterization of the Human Exposome by a Comprehensive and Quantitative Large-Scale Multianalyte Metabolomics Platform. Anal Chem. 2020;92:13767–13775. doi: 10.1021/acs.analchem.0c02008 [DOI] [PubMed] [Google Scholar]
- 66.Bessonneau V, Gerona RR, Trowbridge J, Grashow R, Lin T, Buren H, Morello-Frosch R, Rudel RA. Gaussian graphical modeling of the serum exposome and metabolome reveals interactions between environmental chemicals and endogenous metabolites. Sci Rep. 2021;11:7607. doi: 10.1038/s41598-021-87070-9 [DOI] [PMC free article] [PubMed] [Google Scholar]
- 67.Walker DI, Mallon CT, Hopke PK, Uppal K, Go YM, Rohrbeck P, Pennell KD, Jones DP. Deployment-Associated Exposure Surveillance With High-Resolution Metabolomics. J Occup Environ Med. 2016;58:S12–21. doi: 10.1097/JOM.0000000000000768 [DOI] [PMC free article] [PubMed] [Google Scholar]
- 68.Walker DI, Valvi D, Rothman N, Lan Q, Miller GW, Jones DP. The metabolome: A key measure for exposome research in epidemiology. Curr Epidemiol Rep. 2019;6:93–103. [PMC free article] [PubMed] [Google Scholar]
- 69.Walker DI, Juran BD, Cheung AC, Schlicht EM, Liang Y, Niedzwiecki M, LaRusso NF, Gores GJ, Jones DP, Miller GW, Lazaridis KN. High-Resolution Exposomics and Metabolomics Reveals Specific Associations in Cholestatic Liver Diseases. Hepatol Commun. 2022;6:965–979. doi: 10.1002/hep4.1871 [DOI] [PMC free article] [PubMed] [Google Scholar]
- 70.Hu X, Walker DI, Liang Y, Smith MR, Orr ML, Juran BD, Ma C, Uppal K, Koval M, Martin GS, et al. A scalable workflow to characterize the human exposome. Nat Commun. 2021;12:5575. doi: 10.1038/s41467-021-25840-9 [DOI] [PMC free article] [PubMed] [Google Scholar]
- 71.Walker DI, Lane KJ, Liu K, Uppal K, Patton AP, Durant JL, Jones DP, Brugge D, Pennell KD. Metabolomic assessment of exposure to near-highway ultrafine particles. J Expo Sci Environ Epidemiol. 2019;29:469–483. doi: 10.1038/s41370-018-0102-5 [DOI] [PMC free article] [PubMed] [Google Scholar]
- 72.Silva EL, Walker DI, Coates Fuentes Z, Pinto-Pacheco B, Metz CN, Gregersen PK, Mahalingaiah S. Untargeted metabolomics reveals that multiple reproductive toxicants are present at the endometrium. Sci Total Environ. 2022;843:157005. doi: 10.1016/j.scitotenv.2022.157005 [DOI] [PMC free article] [PubMed] [Google Scholar]
- 73.de Oliveira Alves N, Martins Pereira G, Di Domenico M, Costanzo G, Benevenuto S, de Oliveira Fonoff AM, de Souza Xavier Costa N, Ribeiro Junior G, Satoru Kajitani G, Cestari Moreno N, et al. Inflammation response, oxidative stress and DNA damage caused by urban air pollution exposure increase in the lack of DNA repair XPC protein. Environ Int. 2020;145:106150. doi: 10.1016/j.envint.2020.106150 [DOI] [PubMed] [Google Scholar]
- 74.Dadvand P, Bartoll X, Basagana X, Dalmau-Bueno A, Martinez D, Ambros A, Cirach M, Triguero-Mas M, Gascon M, Borrell C, Nieuwenhuijsen MJ. Green spaces and General Health: Roles of mental health status, social support, and physical activity. Environ Int. 2016;91:161–167. doi: 10.1016/j.envint.2016.02.029 [DOI] [PubMed] [Google Scholar]
- 75.Mitchell R, Popham F. Effect of exposure to natural environment on health inequalities: an observational population study. Lancet. 2008;372:1655–1660. doi: 10.1016/S0140-6736(08)61689-X [DOI] [PubMed] [Google Scholar]
- 76.Rider CF, Carlsten C. Air pollution and DNA methylation: effects of exposure in humans. Clin Epigenetics. 2019;11:131. doi: 10.1186/s13148-019-0713-2 [DOI] [PMC free article] [PubMed] [Google Scholar]
- 77.Sima M, Rossnerova A, Simova Z, Rossner P Jr. The Impact of Air Pollution Exposure on the MicroRNA Machinery and Lung Cancer Development. J Pers Med. 2021;11. doi: 10.3390/jpm11010060 [DOI] [PMC free article] [PubMed] [Google Scholar]
- 78.Wang F, Liu J, Zeng H. Interactions of particulate matter and pulmonary surfactant: Implications for human health. Adv Colloid Interface Sci. 2020;284:102244. doi: 10.1016/j.cis.2020.102244 [DOI] [PMC free article] [PubMed] [Google Scholar]
- 79.Javed Z, Valero-Elizondo J, Maqsood MH, Mahajan S, Taha MB, Patel KV, Sharma G, Hagan K, Blaha MJ, Blankstein R, et al. Social determinants of health and obesity: Findings from a national study of US adults. Obesity (Silver Spring). 2022;30:491–502. doi: 10.1002/oby.23336 [DOI] [PubMed] [Google Scholar]
- 80.Turecamo SE, Xu M, Dixon D, Powell-Wiley TM, Mumma MT, Joo J, Gupta DK, Lipworth L, Roger VL. Association of Rurality With Risk of Heart Failure. JAMA Cardiol. 2023;8:231–239. doi: 10.1001/jamacardio.2022.5211 [DOI] [PMC free article] [PubMed] [Google Scholar]
- 81.Khan SU, Javed Z, Lone AN, Dani SS, Amin Z, Al-Kindi SG, Virani SS, Sharma G, Blankstein R, Blaha MJ, et al. Social Vulnerability and Premature Cardiovascular Mortality Among US Counties, 2014 to 2018. Circulation. 2021;144:1272–1279. doi: 10.1161/CIRCULATIONAHA.121.054516 [DOI] [PubMed] [Google Scholar]
- 82.Ohri-Vachaspati P, DeLia D, DeWeese RS, Crespo NC, Todd M, Yedidia MJ. The relative contribution of layers of the Social Ecological Model to childhood obesity. Public Health Nutr. 2015;18:2055–2066. doi: 10.1017/S1368980014002365 [DOI] [PMC free article] [PubMed] [Google Scholar]
- 83.Chamberlain AM, St Sauver JL, Finney Rutten LJ, Fan C, Jacobson DJ, Wilson PM, Boyd CM, Rocca WA. Associations of Neighborhood Socioeconomic Disadvantage With Chronic Conditions by Age, Sex, Race, and Ethnicity in a Population-Based Cohort. Mayo Clin Proc. 2022;97:57–67. doi: 10.1016/j.mayocp.2021.09.006 [DOI] [PMC free article] [PubMed] [Google Scholar]
- 84.Knapp EA, Kress AM, Parker CB, Page GP, McArthur K, Gachigi KK, Alshawabkeh AN, Aschner JL, Bastain TM, Breton CV, et al. The Environmental Influences on Child Health Outcomes (ECHO)-Wide Cohort. Am J Epidemiol. 2023;192:1249–1263. doi: 10.1093/aje/kwad071 [DOI] [PMC free article] [PubMed] [Google Scholar]
- 85.Islam N, Lacey B, Shabnam S, Erzurumluoglu AM, Dambha-Miller H, Chowell G, Kawachi I, Marmot M. Social inequality and the syndemic of chronic disease and COVID-19: county-level analysis in the USA. J Epidemiol Community Health. 2021. doi: 10.1136/jech-2020-215626 [DOI] [PubMed] [Google Scholar]
- 86.Aris IM, Perng W, Dabelea D, Padula AM, Alshawabkeh A, Velez-Vega CM, Aschner JL, Camargo CA Jr., Sussman TJ, Dunlop AL, et al. Associations of Neighborhood Opportunity and Social Vulnerability With Trajectories of Childhood Body Mass Index and Obesity Among US Children. JAMA Netw Open. 2022;5:e2247957. doi: 10.1001/jamanetworkopen.2022.47957 [DOI] [PMC free article] [PubMed] [Google Scholar]
- 87.Katz DH, Robbins JM, Deng S, Tahir UA, Bick AG, Pampana A, Yu Z, Ngo D, Benson MD, Chen ZZ, et al. Proteomic profiling platforms head to head: Leveraging genetics and clinical traits to compare aptamer- and antibody-based methods. Sci Adv. 2022;8:eabm5164. doi: 10.1126/sciadv.abm5164 [DOI] [PMC free article] [PubMed] [Google Scholar]
- 88.Gardin JM, Wagenknecht LE, Anton-Culver H, Flack J, Gidding S, Kurosaki T, Wong ND, Manolio TA. Relationship of cardiovascular risk factors to echocardiographic left ventricular mass in healthy young black and white adult men and women. The CARDIA study. Coronary Artery Risk Development in Young Adults. Circulation. 1995;92:380–387. doi: 10.1161/01.cir.92.3.380 [DOI] [PubMed] [Google Scholar]
- 89.Moreira HT, Nwabuo CC, Armstrong AC, Kishi S, Gjesdal O, Reis JP, Schreiner PJ, Liu K, Lewis CE, Sidney S, et al. Reference Ranges and Regional Patterns of Left Ventricular Strain and Strain Rate Using Two-Dimensional Speckle-Tracking Echocardiography in a Healthy Middle-Aged Black and White Population: The CARDIA Study. J Am Soc Echocardiogr. 2017;30:647–658 e642. doi: 10.1016/j.echo.2017.03.010 [DOI] [PMC free article] [PubMed] [Google Scholar]
- 90.Carr JJ, Nelson JC, Wong ND, McNitt-Gray M, Arad Y, Jacobs DR Jr., Sidney S, Bild DE, Williams OD, Detrano RC. Calcified coronary artery plaque measurement with cardiac CT in population-based studies: standardized protocol of Multi-Ethnic Study of Atherosclerosis (MESA) and Coronary Artery Risk Development in Young Adults (CARDIA) study. Radiology. 2005;234:35–43. doi: 10.1148/radiol.2341040439 [DOI] [PubMed] [Google Scholar]
- 91.Odegaard AO, Jacobs DR Jr, Van Wagner LB, Pereira MA. Levels of abdominal adipose tissue and metabolic-associated fatty liver disease (MAFLD) in middle age according to average fast-food intake over the preceding 25 years: the CARDIA Study. The American Journal of Clinical Nutrition. 2022;116:255–262. doi: 10.1093/ajcn/nqac079 [DOI] [PMC free article] [PubMed] [Google Scholar]
- 92.Kalhan R, Dransfield MT, Colangelo LA, Cuttica MJ, Jacobs DR Jr., Thyagarajan B, Estepar RSJ, Harmouche R, Onieva JO, Ash SY, et al. Respiratory Symptoms in Young Adults and Future Lung Disease. The CARDIA Lung Study. Am J Respir Crit Care Med. 2018;197:1616–1624. doi: 10.1164/rccm.201710-2108OC [DOI] [PMC free article] [PubMed] [Google Scholar]
Associated Data
This section collects any data citations, data availability statements, or supplementary materials included in this article.
Supplementary Materials
Data Availability Statement
Data are publicly available through the respective coordinating centers12,13, including data from CARDIA (www.cardia.dopm.uab.edu), the Framingham Heart Study (FHS; https://www.framinghamheartstudy.org/fhs-for-researchers/), and Jackson Heart Study (JHS; https://www.jacksonheartstudy.org/Research/Study-Data/Data-Access). Please see the Major Resources Table in the Supplemental Materials. The Institutional Review Board at each institution approved each study.