Abstract
Alzheimer's disease (AD), the most prevalent neurodegenerative disorder worldwide, is clinically characterized by cognitive deficits. Neuropathologically, AD brains accumulate deposits of amyloid‐β (Aβ) and tau proteins. Furthermore, these misfolded proteins can propagate from cell to cell in a prion‐like manner and induce native proteins to become pathological. The entorhinal cortex (EC) is among the earliest areas affected by tau accumulation along with volume reduction and neurodegeneration. Neuron–glia interactions have recently come into focus; however, the role of microglia and astroglia in the pathogenesis of AD remains unclear. Proteomic approaches allow the determination of changes in the proteome to better understand the pathology underlying AD. Bioinformatic analysis of proteomic data was performed to compare ECs from AD and non‐AD human brain tissue. To validate the proteomic results, western blot, immunofluorescence, and confocal studies were carried out. The findings revealed that the most disturbed signaling pathway was synaptogenesis. Because of their involvement in synapse function, relationship with Aβ and tau proteins and interactions in the pathway analysis, three proteins were selected for in‐depth study: HSP90AA1, PTK2B, and ANXA2. All these proteins showed colocalization with neurons and/or astroglia and microglia and with pathological Aβ and tau proteins. In particular, ANXA2, which is overexpressed in AD, colocalized with amoeboid microglial cells and Aβ plaques surrounded by astrocytes. Taken together, the evidence suggests that unbalanced expression of HSP90AA1, PTK2B, and ANXA2 may play a significant role in synaptic homeostasis and Aβ pathology through microglial and astroglial cells in the human EC in AD.
Keywords: amyloid‐β, ANXA2, astroglia, GFAP, IBA1, microglia, neurodegeneration, PYK2, synapse, tau
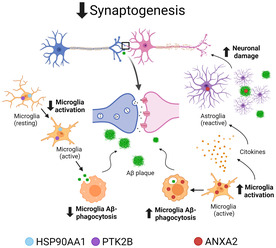
A proteomic analysis revealed synaptogenesis as the most disturbed signaling pathway in the human entorhinal cortex in Alzheimer's disease. HSP90AA1, PTK2B and ANXA2 proteins are highlighted as key factors that could promote synaptic decline via microglia. Unbalanced expression of HSP90AA1 and PTK2B could decrease microglia activation and Aβ‐clearance. ANXA2 upregulation could promote Aβ‐mediated microglial activation and subsequently induce Aβ degradation and activate neurotoxic astrocytes, pointing to a dual neuroprotective and neurotoxic role of ANXA2.
1. INTRODUCTION
Alzheimer's disease (AD) is the most prevalent neurodegenerative disorder worldwide, and its prevalence is rapidly growing owing to the aging population [1]. This disease is clinically characterized by cognitive deficits and memory dysfunction. Neuropathologically, deposits of amyloid‐β (Aβ) and tau proteins are found in AD brains [2]. These misfolded proteins can act in a prion‐like manner, propagating from cell to cell through neurons and/or glial cells and inducing native proteins to become pathological [3, 4]. Accumulating evidence points to a prominent role of astroglia and microglia in AD pathogenesis [5]. However, whether both glial cell populations facilitate the clearance [6, 7] and/or the spread [8, 9, 10] of Aβ and tau pathological proteins remains unclear.
Since tau accumulation occurs in a predictable manner, six neuropathological stages have been established for AD [11]. Along with the locus coeruleus, the entorhinal cortex (EC) is one of the earliest areas involved in tauopathy (Braak stage I). From the EC, tau aggregates spread out from within the medial temporal lobe to the rest of the cortex. Importantly, the EC is the principal entrance of cortical information into the hippocampus through the perforant pathway [12]. Because of its unique location in the cortico‐hippocampal circuit, the EC constitutes an essential connectomic hub [13] for memory encoding, consolidation, and retrieval [14, 15]. In fact, medial temporal lobe atrophy, especially in the hippocampus and EC, is one of the hallmarks of AD and is used as a diagnostic criterion [16].
Neuronal loss and volume reduction in the EC have been widely reported [17, 18]. There is a clinical need to identify diagnostic biomarkers and therapeutic strategies to protect against EC degeneration. Determining changes in the proteome is a potential tool to better understand the pathology underlying AD [19, 20, 21, 22]. Studies applying proteomic approaches to the human EC have been scarce, but have identified alterations related to protein phosphorylation [23] and ion transport function [24] in patients with AD. A recent proteomic study revealed an interesting profile of upregulated (S100A6, PPP1R1B, BAG3, and PRDX6) and downregulated (GSK3B, SYN1, DLG4, and RAB3A) proteins related to neurodegeneration and astrogliosis in the human EC in AD [18].
In this study, a bioinformatic analysis of proteomic data was performed in the EC in AD. Heat shock protein HSP 90‐alpha (HSP90AA1), protein‐tyrosine kinase 2‐beta (PTK2B), and annexin‐2 (ANXA2) were selected because of their involvement in synaptic function, their potential interaction with Aβ and tau pathological proteins, and their connections in the pathway analysis. Finally, we thoroughly analyzed the specific expression patterns of these proteins in neurons, astroglia, and microglia to disentangle cell‐type‐specific contributions to disease pathology.
2. METHODS
2.1. Human samples
Postmortem human brain samples were provided by the Institut d'Investigacions Biomèdiques August Pi i Sunyer (IDIBAPS), Biobanco en Red de la Región de Murcia (BIOBANC‐MUR), Biobanco de Tejidos de la Fundación CIEN (BTCIEN), and Biobanco del Principado de Asturias (BPA), which are integrated in the Spanish National Biobanks Network. The samples were then processed following standard operating procedures with the approval of the Clinical Research Ethics Committee of Ciudad Real University Hospital (PID2019‐108659RBI00). Two experimental groups were used: N = 12 non‐AD cases and N = 12 AD cases neuropathologically diagnosed with Braak stages V or VI. Fresh frozen tissue from five cases per experimental group were used to perform protein extraction and western blotting (mean age ± standard error of the mean [SEM]: 75.60 ± 3.265, n = 5 non‐AD; 78.60 ± 5.085, n = 5 AD; p value = 0.793). Formalin‐fixed tissue from the seven other cases per experimental group were used for histological procedures, colocalization studies, and fluorescence quantification (mean age ± SEM: 67.80 ± 6.224, n = 5 non‐AD; 80.20 ± 3.056, n = 5 AD; p value = 0.396). Information about the cases used is detailed in Table 1.
TABLE 1.
Demographic and clinic‐pathological features of the individuals used in this study.
| Case | DxAP | Assay | Braak stage | Sex | Age (years) | PMD (hh:mm) | Brain weight (g) | Original fixation | Cause of death |
|---|---|---|---|---|---|---|---|---|---|
| 1 | AD | IF | VI | F | 87 | 15:30 | 990 | Formaldehyde | Sepsis |
| 2 | AD | IF, Q | V | F | 80 | 4:00 | 910 | Formaldehyde | Respiratory infection |
| 3 | AD | IF | VI | F | 85 | 2:00 | 1150 | Formaldehyde | Cardiorespiratory arrest |
| 4 | AD | IF, Q | VI | M | 77 | 5:00 | 1330 | Formaldehyde | Sepsis of bacterial origin |
| 5 | AD | IF, Q | VI | M | 77 | 6:00 | 1060 | Formaldehyde | Acute respiratory infection |
| 6 | AD | IF, Q | V | M | 75 | 3:00 | 1050 | Formaldehyde | Multi‐organic failure |
| 7 | AD | IF, Q | VI | M | 92 | 6:00 | 960 | Formaldehyde | n.a. |
| 8 | AD | WB | VI | M | 90 | 4:30 | 1070 | Frozen no‐fix | Cardiorespiratory arrest |
| 9 | AD | WB | V‐VI | F | 91 | 5:00 | n.a. | Frozen no‐fix | n.a. |
| 10 | AD | WB | VI | F | 76 | 11:10 | 900 | Frozen no‐fix | Cardiorespiratory arrest |
| 11 | AD | WB | VI | M | 69 | 2:25 | n.a. | Frozen no‐fix | Multi‐organic failure |
| 12 | AD | WB | VI | F | 67 | 4:15 | n.a. | Frozen no‐fix | Bronchopneumonia |
| 13 | NAD | IF | n.a. | F | 75 | 10:30 | 1050 | Formaldehyde | Cardiogenic shock |
| 14 | NAD | IF, Q | II | F | 81 | 5:00 | 1100 | Formaldehyde | Multi‐organic failure |
| 15 | NAD | IF | II | F | 62 | 2:00 | 1050 | Formaldehyde | Cardiorespiratory arrest |
| 16 | NAD | IF, Q | II | M | 84 | 3:00 | 1400 | Formaldehyde | Cardiorespiratory arrest |
| 17 | NAD | IF, Q | I | M | 53 | 5:00 | 1300 | Formaldehyde | Cardiorespiratory arrest |
| 18 | NAD | IF, Q | I | M | 58 | 6:00 | 1500 | Formaldehyde | Acute myocardial infarction |
| 19 | NAD | IF, Q | I | M | 63 | 2:00 | 1400 | Formaldehyde | Cardiorespiratory arrest |
| 20 | NAD | WB | II | F | 83 | 7:20 | 1320 | Frozen no‐fix | Intestinal ischemia |
| 21 | NAD | WB | n.a. | M | 77 | 10:31 | n.a. | Frozen no‐fix | n.a. |
| 22 | NAD | WB | n.a. | M | 68 | 4:10 | 1350 | Frozen no‐fix | Sepsis |
| 23 | NAD | WB | n.a. | F | 82 | 4:00 | 800 | Frozen no‐fix | Respiratory failure |
| 24 | NAD | WB | n.a. | M | 68 | 4:00 | 1220 | Frozen no‐fix | Cardiorespiratory arrest |
Abbreviations: AD, Alzheimer's disease; DxAP, neuropathological diagnosis; F, Female; IF, Immunofluorescence; M, Male; n.a., not available; NAD, non‐Alzheimer's disease; PMD, post‐mortem delay; Q, Quantification; WB, Western Blot.
To standardize sample conditions from different brain banks, all formalin‐fixed tissues were postfixed by immersion in 4% paraformaldehyde. For cryoprotection, blocks were submerged in a phosphate‐buffered (PB) solution of 2% dimethyl sulfoxide (DMSO) and 10% glycerol for 48 h and then in a PB solution of 2% DMSO and 20% glycerol for 48 h. Later, tissue was cut with a freezing sliding microtome into a series of 50‐μm‐thick coronal sections. The first series was used for Nissl staining. The remaining series were stored in cryoprotective solution and kept at −20°C until further processing.
2.2. Proteomic data analysis
The human EC proteins data analyzed in the present investigation (Dataset S1a) come from a proteomic study previously reported by our group [18]. Briefly, global protein profiles were obtained by sequential window acquisition of all theoretical fragment ion spectra mass spectrometry (SWATH‐MS) and were analyzed using data‐dependent acquisition shotgun nanoscale liquid chromatography coupled to tandem mass spectrometry (nanoLC‐MS/MS) runs. The mass spectrometry proteomics data are available in the ProteomeXchange Consortium (http://proteomecentral.proteomexchange.org) via the PRIDE partner repository with the dataset identifier PXD029359.
Prior to the bioinformatics analysis of proteomic data, Excel was used to normalize protein abundance by log transformation and to filter according to fold change and/or p value. After an unpaired two‐tailed t test was applied, differentially expressed proteins (DEPs) were defined as those that met a p value threshold <0.01 and a fold change threshold of ≥1.8 for upregulation or ≤0.55 for downregulation.
2.3. Bioinformatic analysis
Interactome and pathway analyses were performed using QIAGEN's machine learning‐based bioinformatic tool Ingenuity Pathway Analysis (IPA, QIAGEN Redwood City, www.qiagen.com/ingenuity). SYNGO (Synaptic Gene Ontologies, https://syngoportal.org/) was applied to analyze synapse function. BioGRID 4.4 (a database of protein, genetic, and chemical interactions, https://thebiogrid.org/) was consulted as a repository of protein interactions with pathological markers (APP and MAPT). Finally, Venn diagrams of the data were constructed using Venny (https://bioinfogp.cnb.csic.es/tools/venny/).
2.4. Protein extraction and western blotting
Frozen tissue samples (Table 1) were disrupted with a pellet pestle (Sigma–Aldrich) and homogenized in ice‐cold radioimmunoprecipitation assay (RIPA) buffer (50 mM Tris–HCl pH 7.4, 150 mM NaCl, 0.1% Triton X‐100, 0.1% SDS, 0.5% Na‐deoxycholate) with a protease inhibitor cocktail (Sigma–Aldrich). Homogenates were then shaken for 2 h at 4°C, followed by centrifugation at 12,000g for 5 min at 4°C. Subsequently, supernatants were collected. Protein concentration was determined using a Bicinchoninic Acid Kit for Protein Determination (Sigma–Aldrich) and a Multiskan FC Microplate Photometer (Thermo Fisher Scientific).
Equal amounts of lysate proteins (30 μg) from human samples (Table 1) were loaded onto 10% polyacrylamide gels for SDS–PAGE and electrophoretically transferred to nitrocellulose (HSP90AA1) or PVDF (ANXA2 and PTK2B) membranes. All values were normalized to the housekeeping protein GAPDH. The membranes were blocked with nonfat dry milk in TTBS (0.1% Tween‐20, 0.06 M NaCl, and 0.2 M Tris‐hydroxymethyl‐aminomethane pH 8.8) for 1 h and incubated with primary antibodies (Table 2) overnight at 4°C. The membranes were then washed with TTBS and incubated with the appropriate peroxidase‐conjugated secondary antibodies (1:5000). Band intensity was imaged with a Syngene G:Box (GeneSys software) after incubation with Enhanced Chemiluminescence reagents (Thermo Fisher Scientific) and analyzed with ImageJ.
TABLE 2.
Details of antibodies used in this study.
| Antigen | Manufacturer | Catalog n° | Species | Assay | Dilution | Blocking buffer | Secondary antibody |
|---|---|---|---|---|---|---|---|
| Iba‐1 | Abcam | ab5076 | Goat polyclonal | IF | 1:1000 | TBS + 0.3% TX‐100 + 10% NDS | Alexa Fluor® 647 donkey |
| GFAP | Abcam | ab53554 | Goat polyclonal | IF | 1:500 | TBS + 0.3% TX‐100 + 10% NDS | Alexa Fluor® 647 donkey |
| β‐Amyloid | Cell Signaling | 2454 | Rabbit polyclonal | IF | 1:250 | PBS + 0.3% TX‐100 + 2% NDS | Alexa Fluor® 488 donkey |
| β‐Amyloid | Cell Signaling | 2450 | Mouse monoclonal | IF | 1:1000 | TBS + 0.3% TX‐100 + 10% NDS | Alexa Fluor® 568 donkey |
| Tau | Cell Signaling | 46,687 | Rabbit monoclonal | IF | 1:100 | PBS + 0.3% TX‐100 | Alexa Fluor® 488 donkey |
| Tau | Cell Signaling | 4019 | Mouse monoclonal | IF | 1:800 | TBS + 0.3% TX‐100 + 10% NDS | Alexa Fluor® 568 donkey |
| Neuro‐Chrom™ Pan Neuronal | Sigma–Aldrich | MAB2300 | Mouse monoclonal | IF | 1:100 | TBS + 0.3% TX‐100 + 10% NDS | Alexa Fluor® 568 donkey |
| ANXA2 | Abcam | ab41803 | Rabbit polyclonal | IF; WB | 1:100; 1:1000 | TBS + 0.3% TX‐100 + 10% NDS; milk 5% | Alexa Fluor® 488 donkey; polyclonal goat immunoglobulins/HRP |
| HSP90α | Invitrogen | MA3‐010 | Mouse monoclonal | IF; WB | 1:20; 1:500 | TBS + 0.3% TX‐100 + 10% NDS; milk 5% | Alexa Fluor® 568 donkey; goat IgG (H + L) HRP‐conjugated |
| PYK2 | Abcam | ab32571 | Rabbit monoclonal | IF; WB | 1:100; 1:2000 | TBS + 0.3% TX‐100 + 10% NDS; milk 5% | Alexa Fluor® 488 donkey; polyclonal goat immunoglobulins/HRP |
| GAPDH | Cell Signaling | 2118 | Rabbit monoclonal | WB | 1:2000 | Milk 5% | Polyclonal goat immunoglobulins/HRP |
Abbreviations: IF, Immunofluorescence; PBS, phosphate‐buffered saline; TBS, tris‐buffered saline; WB, Western Blot.
2.5. Immunofluorescence
For immunofluorescence, epitopes from formaldehyde‐fixed human samples (Table 1) were unmasked by boiling tissue sections under pressure for 2 min in citrate buffer. After this unmasking step, the sections were immersed in formic acid for 3 min and rinsed in phosphate‐buffered saline (PBS) or tris‐buffered saline (TBS; 0.05 M NaCl, 0.05 M Tris, HCl pH 7.6). Endogenous peroxidase activity was inhibited using 1% H2O2 for 20 min. Tissue was then immersed in blocking buffer for 30 min at room temperature and incubated overnight at 4°C with primary antibodies (for details, see Table 2). Then, sections were incubated for 2 h at room temperature with Alexa Fluor 488, 568, or 647 antibodies against multiple species (1:200 in TBS with 0.3% Triton X‐100; Invitrogen), counterstained with DAPI (0.01% in TBS, Sigma–Aldrich) for 5 min in the dark, and coverslipped with PVA‐DABCO (Sigma–Aldrich).
2.6. Quantification of fluorescence intensity
Labeling of HSP90AA1, PTK2B, and ANXA2 markers was stereologically quantified in 10 cases (5 non‐AD and 5 AD cases, for details see Table 1). Sections from levels 16.0 to 23.9 mm from bregma were selected [25]. This method included random point selection in the EC, photography, and confocal microscopy analysis.
Briefly, the EC was outlined on immunofluorescence‐stained slides by consulting parallel Nissl‐stained slides. We performed an unbiased protocol: first, a transparent millimetric grid was randomly overlapped with the slide, and the crossing points of the grid were used to select the points on the slide to take the pictures. Second, three tissue sections per case were selected, and three random images per section were captured with a Zeiss LSM 800 confocal microscope using a 20× objective (Plan‐Apochromat 20×/0.8 M27). Third, images (HSP90AA1, n = 90; PTK2B, n = 90; and ANXA2, n = 90) were analyzed with Zen blue 3.3 software supplied by Carl Zeiss. The same conditions and parameters of background and threshold were maintained between non‐AD and AD cases for each channel. The mean intensity value of each image was measured with the graphics tool of Zen software. The total fluorescence signal intensity was quantified as the average across labeled pictures for each case.
2.7. Colocalization studies
Double or triple immunofluorescence staining of selected proteins with microglial (IBA1), astroglial (GFAP) or neuronal (PAN) markers and Aβ and tau pathological markers was analyzed with a Zeiss LSM 800 confocal microscope coupled to Zen blue 3.3 software. Spatial colocalization was analyzed using high‐magnification images and z‐stacks obtained with a 40× objective (Plan‐Apochromat 40×/0.95 Korr M27) and a 63× objective (Plan‐Apochromat 63×/1.40 Oil DIC M27).
2.8. Statistics
All statistical analyses were conducted using GraphPad Prism 6 Software (GraphPad Inc., San Diego, CA, USA, v.6). Data are expressed as the mean ± SD, and statistical comparisons were made using t tests or Mann–Whitney U tests for normally or nonnormally distributed data, respectively. The statistical significance level was set at α = 0.05.
3. RESULTS
3.1. Synaptogenesis is the most disturbed signaling pathway in the EC
Starting from a total of 1635 identified proteins in the human EC, the number of DEPs was 139, with 52 upregulated and 87 downregulated proteins (Dataset S1b). Ingenuity Pathway Analysis was used to investigate the potential implications of the observed changes in metabolic pathways and protein interaction networks. The analysis of the top 10 canonical pathways revealed that the synaptogenesis signaling pathway had the largest negative z score (Figure 1A). Inhibited functions relevant to this pathway include the growth and branching of neurites through the upstream regulator PPARA (peroxisome proliferator‐activated receptor alpha); when these functions are inhibited, organismal death results (Figure 1B). More specifically, annotations of the increased and decreased functions related to synapses are shown in Figure 1C, where a substantial reduction in the growth and branching of neurites is highlighted (Dataset S1c).
FIGURE 1.
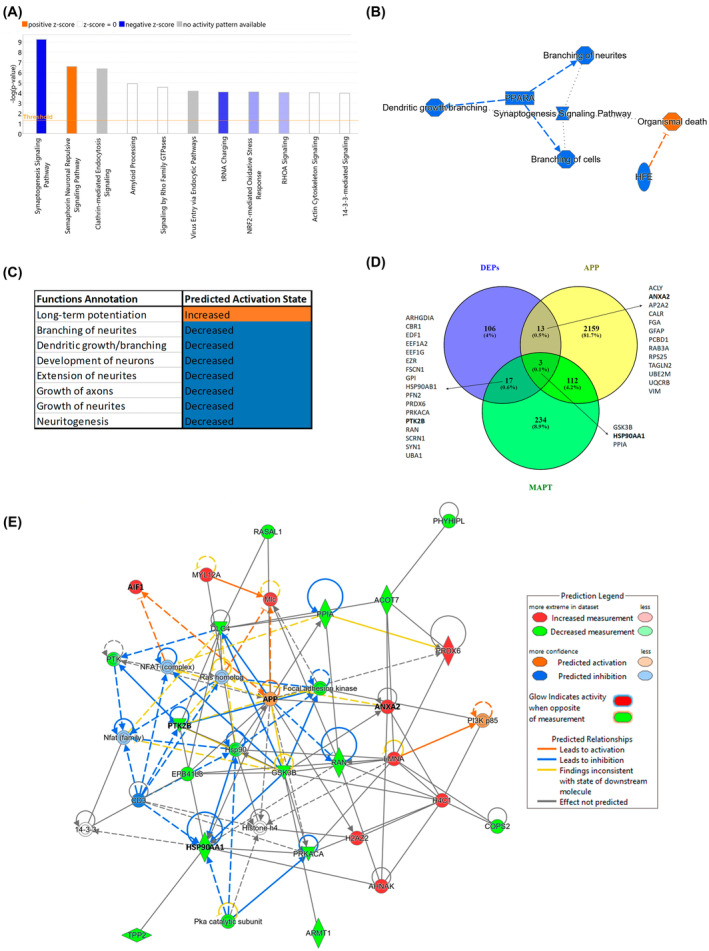
Proteomic analysis of the human EC in AD. (A) The top 10 canonical pathways classified by z score. (B) Graphical summary of the synaptogenesis signaling pathway, the top canonical pathway, with the associated functions and the upstream regulators. (C) Increased and decreased functions related to synapses. (D) Common and unique DEPs related to AD pathology. Venn diagram showing the overlap between DEPs and pathological Aβ (APP) and/or tau (MAPT) proteins. Gene names are indicated for the corresponding overlapping areas of interest. (E) Representative functional protein interactome map for DEPs and APP. The proteins selected in this study (HSP90AA1, PTK2B, and ANXA2) and those related to microglial cells (AIF1) and Aβ (APP) pathology are highlighted in bold. Aβ, amyloid‐β; AD, Alzheimer's disease; DEPs, differentially expressed proteins; EC, entorhinal cortex.
To further analyze synaptic homeostasis, we performed a SYNGO analysis, for which cellular component and biological process enrichment analysis in synapses revealed that 37/139 DEPs were involved (Dataset S1d). The synapse Gene Ontology (GO) term (GO:0045202) revealed nine specific proteins (AP2M1, ARHGDIA, CORO1A, CYFIP2, EEF1A2, FGA, RPLP2, RPS25, TBC1D24; p value = 8.97e‐12). There were relevant alterations on both the presynapse (GO:0098793), with seven altered proteins (AP1G1, CADPS, PFN2, PRKACA, PTK2B, SCRN1, SYNJ1; p value = 4.12e‐6), and the postsynapse (GO:0098794), with six altered proteins (ACTR2, CYFIP1, PFN2, PPP1R1B, PRKACA, and PTK2B; p value = 1e‐4). PTK2B, affected on both the presynapse and postsynapse, was also involved in the postsynaptic density (GO:0099092), postsynaptic modulation of chemical synaptic transmission (GO:0099170) and regulation of postsynaptic density assembly (GO:0099151) (Dataset S1e,f).
3.2. Interrelationship between DEPs and Aβ and tau pathological proteins
To determine how many of the DEPs were related to pathological Aβ (APP) and tau (MAPT) proteins, we generated a Venn diagram using the list of interacting proteins from BioGRID (Figure 1D). Sixteen proteins matched Aβ (APP), and 20 matched tau (MAPT), of which only 3 were common (GSK3B, HSP90AA1, and PPIA).
To characterize the AD‐affected human EC in detail, proteomic data were functionally analyzed (Figure 1E). Several direct and indirect interactions between Aβ (APP) and DEP proteins were noted when APP was incorporated into the interactome map. Specifically, 8 increased proteins (AHNAK, AIF1, ANXA2, H2AZ2, H4C1, LMNA, MYL12A, and PRDX6) and 14 decreased proteins (ACOT7, ARMT1, COPS2, DLG4, EPB41L3, GSK3B, HSP90AA1, PHYHIPL, PPIA, PRKACA, PTK2B, RAN, RASAL1, and TPP2) were involved. The remarkable pattern of AIF1 (a synonym of IBA1), related to microglial cells, is shown in the interactome map.
3.3. Proteomic analysis reveals HSP90AA1, PTK2B, and ANXA2 as proteins of interest in AD pathology
After bioinformatic analyses of proteomic data, three proteins were selected (two downregulated, HSP90AA1 and PTK2B, and one upregulated, ANXA2) for further experiments based on different criteria. The first criterion was statistical significance based on the p value (<0.01) and fold change (≥1.8 for upregulated and ≤0.55 for downregulated expression) established to select DEPs. Second, the three proteins were selected based on their interactions with Aβ and/or tau protein extracted from the BioGRID analysis. More specifically, ANXA2 was related to Aβ, PTK2B was related to tau, and HSP90AA1 was related to both. Third, all three proteins showed direct or indirect functional interactions with Aβ protein and microglia in an interactome map. Moreover, PTK2B was also selected due to its known involvement in altered synapses in AD.
3.4. ANXA2 expression is increased in the EC in AD
HSP90AA1, PTK2B, and ANXA2 protein levels were quantified in non‐AD and AD cases using western blotting. No statistically significant differences were found in HSP90AA1 (p value = 0.5317), PTK2B (p value = 0.0952), or ANXA2 (p value = 0.4127) (Figure S1A–C, respectively). All proteins showed a trend consistent with the proteomic data analysis, but the trend was not statistically significant, probably due to the variability among human samples.
In addition to western blotting, we performed immunofluorescence analysis to check the downregulation or upregulation of proteins of interest. The expression of HSP90AA1 (Figure 2A–C), PTK2B (Figure 2D–F), and ANXA2 (Figure 2G–I) in the EC was investigated in non‐AD and AD cases via confocal microscopy. No significant differences were found in HSP90AA1 (Figure 2C; Mann–Whitney U = 4, p value = 0.0952) or PTK2B (Figure 2F; Mann–Whitney U = 12, p value = 0.9444) labeling. On the other hand, statistical analysis demonstrated a significant increase in ANXA2 labeling in AD compared to non‐AD cases (Figure 2I; Mann–Whitney U = 0, p value = 0.0079) in the EC.
FIGURE 2.
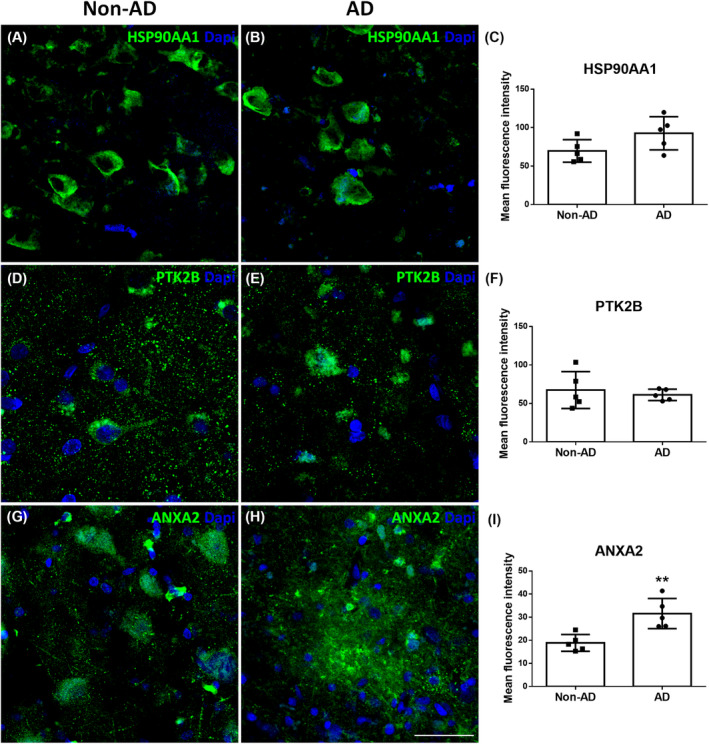
Validation of proteomic results through immunofluorescence: HSP90AA1, PTK2B, and ANXA2. Coronal sections of the human EC stained for HSP90AA1 in non‐AD (A) and AD (B) cases, PTK2B in non‐AD (D) and AD (E) cases and ANXA2 in non‐AD (G) and AD (H) cases. Quantification from confocal fluorescence microscopy images of HSP90AA1 (C), PTK2B (F) and ANXA2 (I). The graphs show the mean ± SD, **p value < 0.01. Scale bar = 40 μm for (A,B) and (G,H) and 25 μm for (D,E). AD, Alzheimer's disease; EC, entorhinal cortex.
3.5. HSP90AA1, PTK2B, and ANXA2 colocalize with glial cells and pathological protein aggregates
Immunofluorescence analysis of selected proteins with microglial (IBA1), astroglial (GFAP), or neuronal (PAN) markers was performed to assess spatial relationships. In addition, the pathological markers Aβ and tau were investigated together with HSP90AA1, PTK2B, and ANXA2.
HSP90AA1 colocalized with microglial (Figure 3A–C) and astroglial (Figure 3D–F) cells in AD. Moreover, HSP90AA1 was found in the vicinity of Aβ plaques (Figure 3G–I) and colocalized with tau (Figure 3J–L) deposits in AD cases. PTK2B colocalized with neurons (Figure 4A–C) and was found inside microglial cells (Figure 4D–F). Furthermore, PTK2B colocalized with Aβ (Figure 4G–I) and tau (Figure 4J–L) deposits in AD cases. ANXA2 overlapped with microglial (Figure 5A–C) and astroglial (Figure 5D–F) cells. Moreover, ANXA2 showed an intense relationship with Aβ plaques (Figure 5G–I, Movie S1).
FIGURE 3.
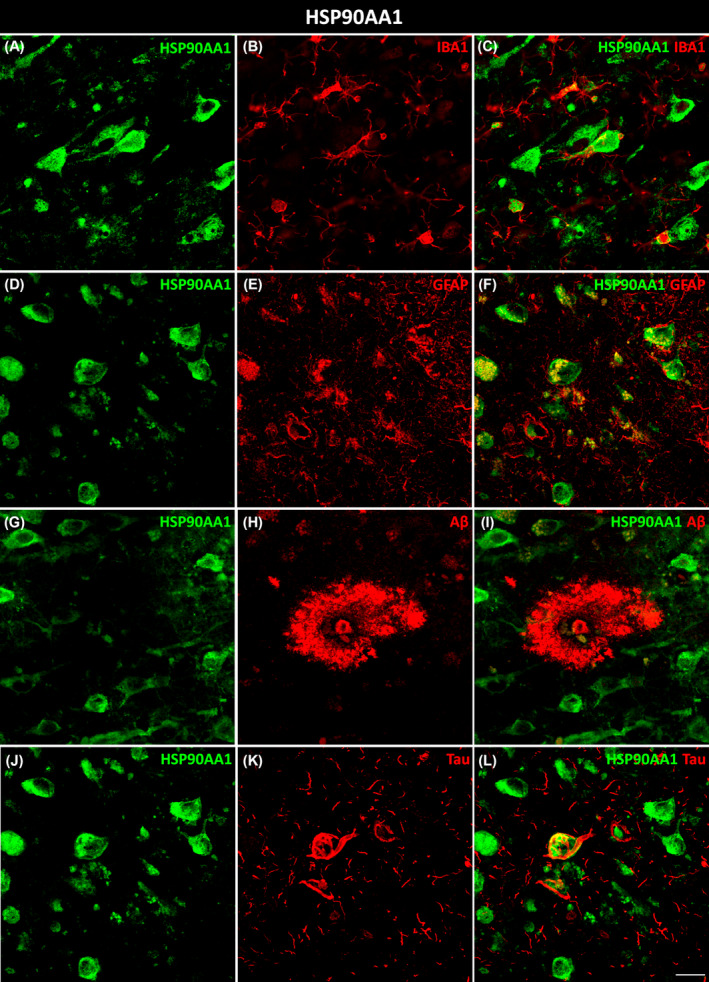
Glial and pathological colocalization of HSP90AA1. Double immunofluorescence staining of coronal sections of the human EC stained for HSP90AA1 and IBA1 for microglia (A–C), GFAP for astrocytes (D–F), Aβ (G–I), and tau (J–L) in AD cases. Scale bar = 20 μm. Aβ, amyloid‐β; AD, Alzheimer's disease; EC, entorhinal cortex.
FIGURE 4.
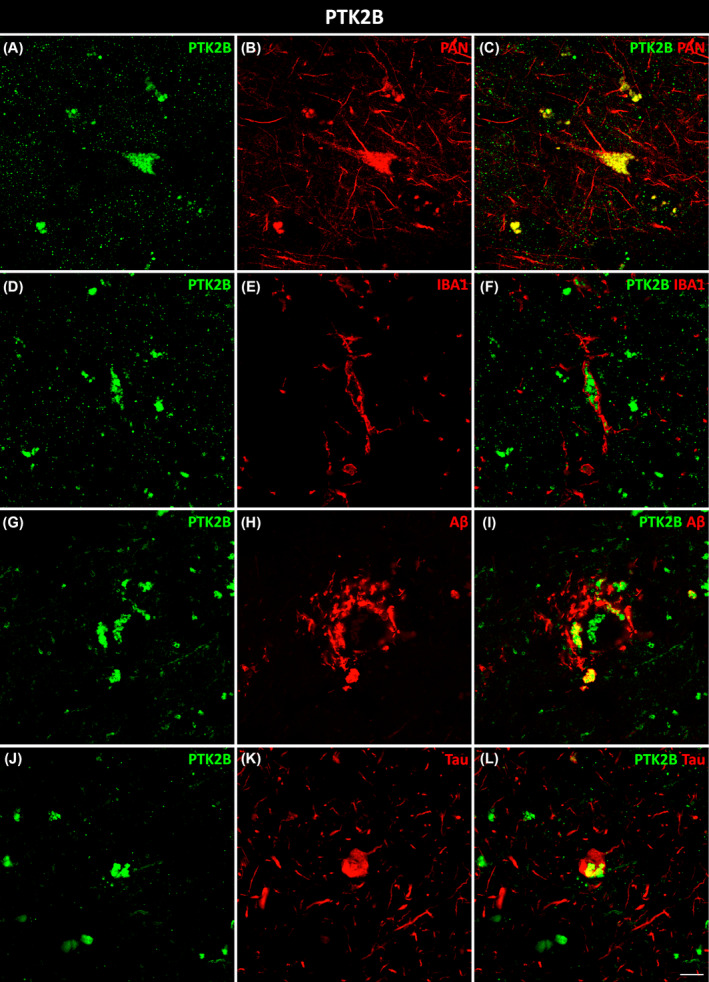
Neuronal, microglial, and pathological colocalization of PTK2B. Double immunofluorescence staining of coronal sections of the human EC stained for PTK2B and PAN for neurons in non‐AD cases (A–C) and IBA1 for microglia (D–F), Aβ (G–I), and tau (J–L) in AD cases. Scale bar = 10 μm. AD, Alzheimer's disease; EC, entorhinal cortex.
FIGURE 5.
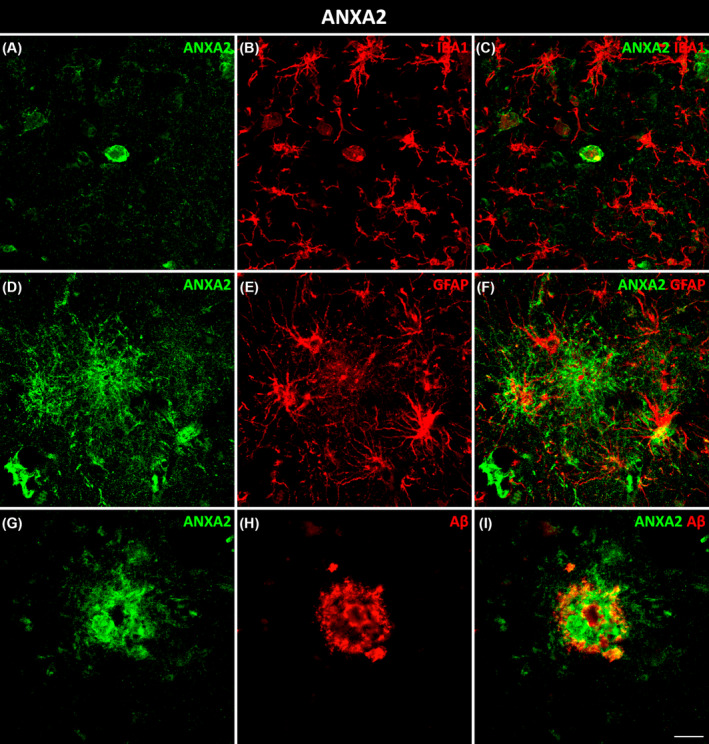
Glial and pathological colocalization of ANXA2. Double immunofluorescence staining of coronal sections of the human EC stained for ANXA2 and IBA1 for microglia (A–C), GFAP for astrocytes (D–F), and Aβ (G–I) in AD cases. Scale bar = 20 μm. EC, entorhinal cortex.
3.6. Increased ANXA2 expression is associated with Aβ plaques surrounded by astrocytes and amoeboid microglial cells
Concerning the increase of ANXA2 in the EC in AD, we further studied its interactions with Aβ plaques and glial cells. We observed astrocytes specifically around Aβ plaques that coexpressed ANXA2 (Figure 6). Interestingly, triple colocalization of ANXA2, HSP90AA1, and IBA1 was observed in microglial cells with an amoeboid morphology but not in those with a ramified morphology (Figure 7, arrows and arrowheads, respectively).
FIGURE 6.
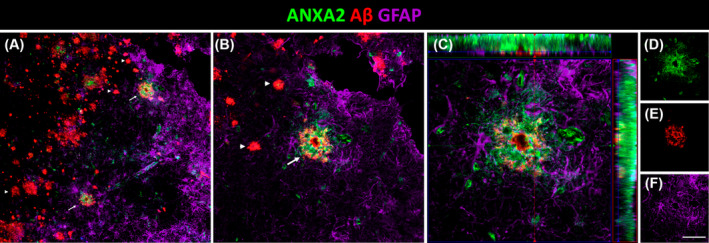
Triple colocalization of ANXA2, Aβ plaques and astrocytes in AD. (A) Coronal section of the human EC immunofluorescently stained for ANXA2, Aβ and GFAP for astrocytes and detail (B). Arrows and arrowheads indicate Aβ plaques with and without ANXA2, respectively. Orthogonal view of the z‐stack (C) and each of its channels in green ANXA2 (D), red Aβ (E), and purple astrocytes (F). Scale bars for A = 70 μm, B = 35 μm, C = 20 μm, and D–F = 55 μm. Aβ, amyloid‐β; AD, Alzheimer's disease; EC, entorhinal cortex.
FIGURE 7.
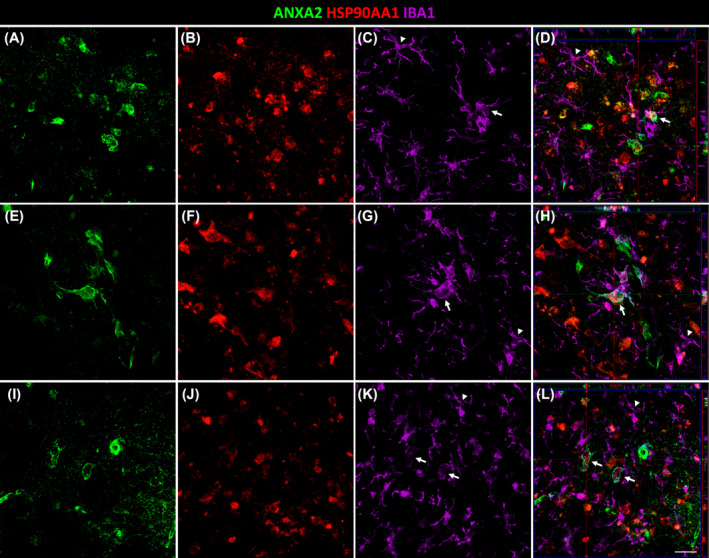
Triple colocalization of ANXA2, HSP90AA1, and microglia in AD. Coronal sections of the human EC immunofluorescently stained for ANXA2 (A, E, I), HSP90AA1 (B, F, J), and IBA1 (C, G, K) for microglia. Orthogonal views of corresponding z‐stacks (D, H, L). Each z‐stack corresponds to a specific number of slices. Arrows and arrowheads indicate amoeboid and ramified microglia, respectively. Scale bar = 20 μm.
4. DISCUSSION
This study constitutes an exploratory data analysis of DEPs in the EC in AD. The limitations establishing homogeneous study groups in terms of age, Braak tau stage, and region has reduced the number of samples used for the DEPs validation. Despite the sample size limitation, this is a novel approach to using DEPs from proteomic datasets to then apply those discoveries back to AD and non‐AD tissues. In addition, the exploratory finding that HSP90AA1, PTK2B, and ANXA2 colocalize with glial cells (astroglia and/or microglia) provides additional support for the role of innate immune responses in the central nervous system in AD progression, and the relationship of these immune responses to Aβ and tau pathology.
To better characterize the relevance of DEPs and their implications for the pathology of AD, a bioinformatic analysis of human EC proteomic data was performed. A total of 139 significant DEPs (52 upregulated and 87 downregulated) were identified, and the most altered signaling pathway in the EC of AD cases was synaptogenesis (Figure 1A–C). SYNGO analysis revealed 37 DEPs involved in synapse function, where PTK2B was affected both presynaptically and postsynaptically (Dataset S1d,f). We also evaluated the existence of an association between DEPs and pathological Aβ (APP) and tau (MAPT) proteins, where ANXA2 was related to Aβ, PTK2B was related to tau, and HSP90AA1 was related to both (Figure 1D). Furthermore, HSP90AA1, PTK2B, and ANXA2 displayed direct and indirect interactions with APP and AIF1 (synonyms of IBA1) in the interactome map based on pathway analysis (Figure 1E). According to proteomic and bioinformatic analyses, two downregulated proteins, HSP90AA1 and PTK2B, and one upregulated protein, ANXA2, were selected as the DEPs of interest for western blot, immunofluorescence, and confocal studies (Figure S1 and Figure 2). Finally, we carefully examined the expression patterns of these proteins in neurons, astroglia, and microglia to disentangle cell‐type‐specific relations to disease pathology (Figures 3, 4, 5, 6, 7).
The results revealed that synaptic homeostasis was disrupted, specifically at the synaptogenesis level, with a marked decrease in the growth and branching functions of dendrites and axons (Figure 1A–C). This would lead to neurodegeneration, which is widely described in AD [17, 18]. Synaptic pathology occurs early in AD and has been correlated with cognitive impairment [26]. However, the molecular mechanisms that lead to synaptic dysfunction remain unclear. Most research focuses on the harmful consequences of soluble toxic forms of Aβ and tau at synapses [27, 28]. For this reason, we constructed a Venn diagram of DEPs related to Aβ (APP) and tau (MAPT), where PTK2B was related to tau, ANXA2 was related to Aβ, and HSP90AA1 was related to both (Figure 1D). In a representative interactome map of functional relationships, the central node, APP, was linked to different proteins, including HSP90AA1, PTK2B, and ANXA2 (Figure 1E). Notably, the network revealed indirect relationships with AIF1, which is related to microglial cells. Glia‐mediated neuroinflammation is also involved in synaptic dysfunction [5, 28]. In particular, recent research findings suggest that microglia and astroglia might contribute to synapse loss by engulfing synaptic structures [28]. Microglia and astroglia have recently been considered crucial players in the pathology of AD, but their protective or harmful roles remain unclear [5]. Evidence suggests that both populations could be involved in either the clearance or, conversely, the spread of Aβ and tau pathological proteins [6, 7, 8, 9]. One of the main goals of this study was to characterize the contribution of HSP90AA1, PTK2B, and ANXA2 to neurons, microglia, and astroglia and the spatial relationships with Aβ and tau in the EC in AD (Figures 3, 4, 5, respectively).
HSP90 is an essential chaperone that regulates proper protein folding in the cell [29]. Two main subtypes are expressed in mammals: HSP90β (HSP90AB1), which is constitutively expressed, and HSP90α (HSP90AA1), which is enriched in the brain and acts as an inducible molecular chaperone that participates in the stress response [29, 30]. In cooperation with its cochaperones, HSP90 is capable of regulating tau phosphorylation and dephosphorylation [30]. In fact, HSP90AA1 was found to colocalize with tau protein (Figure 3L). Several lines of investigation support the idea that the inhibition of HSP90 is a promising way to reduce tau pathology [31, 32, 33]. Hsp90 was found to promote Aβ clearance through the activation of microglial phagocytosis in AD [29, 30, 33, 34]. HSP90AA1 is also considered a microglial activation marker in Parkinson's disease [35]. In our study, HSP90AA1 colocalized with microglia (Figure 3C) and was distributed around Aβ plaques (Figure 3I). Moreover, we demonstrated for the first time that HSP90AA1 colocalized with astrocytes (Figure 3F). This interaction should be further studied to elucidate its role in AD.
PTK2B is a nonreceptor cytoplasmic tyrosine kinase predominantly expressed in neurons [36], and its colocalization pattern was verified in this study (Figure 4C). It plays an important role in synaptic function and is involved in NMDA receptor regulation, hippocampus‐related memory, dendritic spine structure modulation, postsynaptic organization, and synaptic plasticity [37]. This is in accordance with our SYNGO results, which showed that PTK2B was involved in synaptic function and was affected in both pre‐ and postsynapses (Dataset S1f). Regarding pathological proteins, our results showed a colocalization of PTK2B with both Aβ and tau proteins in the EC in AD (Figure 4I,L). PTK2B accumulation represents an early pathological marker corresponding to progressive pathological stages of tau in AD patients and in transgenic mice [38]. In fact, hyperphosphorylated tau was found to colocalize with PTK2B in the human AD brain [38]. GSK3β, the main kinase phosphorylating tau protein, is activated by PTK2B [39, 40]. Additional investigations revealed that PTK2B could act as a direct tyrosine kinase of tau [41]. PTK2B activity displays differing effects on Aβ and tau in the sense that PTK2B mediates toxic Aβ signaling but suppresses tau phosphorylation, protecting against tauopathy in AD [40]. We have shown for the first time that PTK2B is also expressed in microglial cells in the EC in AD (Figure 4F). This protein seems to be required for normal macrophage polarization and migration toward sites of inflammation [42].
ANXA2, a calcium‐regulated membrane‐binding protein, is present in the growth cones and axonal branches of neurons [43]. Knowledge of the involvement of ANXA2 in the pathology of AD is limited. It has been identified as a tau‐interacting protein [44]. The tau–ANXA2 interaction could retain tau protein in the axonal compartment of neurons [45]. ANXA2 was found in the present study to be upregulated in the EC in AD, which could control the mislocalization of tau. This could point to a compensatory mechanism of the affected neurons in patients. Concerning Aβ, one study implicated ANXA2 as a regulator of Aβ metabolism, facilitating autophagosome–lysosome fusion to decrease Aβ [46]. A recent investigation of the human amygdala revealed that ANXA2, whose abundance was increased in AD samples, was colocalized with Aβ plaques [47]. In this study, ANXA2 showed an intense spatial relationship with Aβ plaques in the EC in AD (Figure 5I). Remarkably, astrocytes were located around Aβ plaques that coexpressed ANXA2 (Figure 6). Therefore, the presence of ANXA2 could be involved in astroglia containing Aβ plaques. Regarding glial cells, our results showed colocalization of ANXA2 with both astroglia and microglia in the EC in AD (Figure 5C,F). A single study showed that ANXA2 was expressed by reactive astrocytes (identified by a prominent cytoplasm and processes with strong GFAP immunoreactivity) in the human hippocampus, whereas quiescent astrocytes were minimally immunoreactive [48]. On the other hand, ANXA2 has been linked to Aβ‐mediated microglial activation and proinflammatory responses through tissue plasminogen activator (tPA) signaling pathways, which produce plasmin to degrade Aβ peptides [49]. Interestingly, triple colocalization of ANXA2, HSP90AA1, and IBA1 was observed specifically in amoeboid microglia (Figure 7), which is indicative of activated microglia, in contrast to the resting ramified morphology [50]. Therefore, the interaction of ANXA2 and HSP90AA1 could be necessary to activate microglia toward their phagocytic form to degrade Aβ deposits.
All three proteins investigated in this study showed a relationship with microglial cells. It has been reported that microglia show different states during the course of AD. Microglia have a beneficial role at the beginning of the disease, limiting the toxic accumulation of Aβ and tau through clearance or phagocytosis [5, 7, 51] or compacting and corralling Aβ plaques [52]. However, there is also considerable evidence supporting that activated microglia can be harmful in AD progression [5, 51], becoming unable to protect against the Aβ burden and exacerbating tau pathology [10, 53]. Additionally, microglia can directly cause synaptic loss through the engulfment and removal of synapses and can secrete proinflammatory factors that can damage neurons either directly or indirectly by activating neurotoxic astrocytes [28, 51, 54, 55, 56]. In particular, it has been shown that reactive astrocyte subtype A1 is induced by activated microglia and causes the astrocytes to lose many astrocytic functions, such as support for neurons, synapse formation, and pruning of synapses and myelin debris by phagocytosis [54, 57]. Furthermore, A1 astrocytes secrete a neurotoxin that leads to the death of neurons and oligodendrocytes [54]. This suggests that A1 astrocytes, induced by activated microglia, are toxic to the synapse and that their presence could contribute to neurodegeneration and disease progression.
Taken together, the evidence suggests that unbalanced expression of HSP90AA1, PTK2B, and ANXA2 could contribute to synaptic decline in AD by acting on microglial cells as follows (Figure 8): HSP90AA1 downregulation could decrease microglial activation and Aβ clearance; PTK2B, also downregulated, could reduce the polarization and migration of microglia to Aβ deposits in synaptic structures; ANXA2 upregulation could promote Aβ‐mediated microglial activation and subsequently induce Aβ degradation and activate neurotoxic astrocytes, pointing to a dual neuroprotective and neurotoxic role of ANXA2. As a result, synaptic homeostasis could be disrupted, with a marked decrease in the growth and branching of dendrites and axons. Collectively, these findings suggest the relevance of microglial cells in the propagation of neurodegenerative and neuroinflammatory processes in AD.
FIGURE 8.
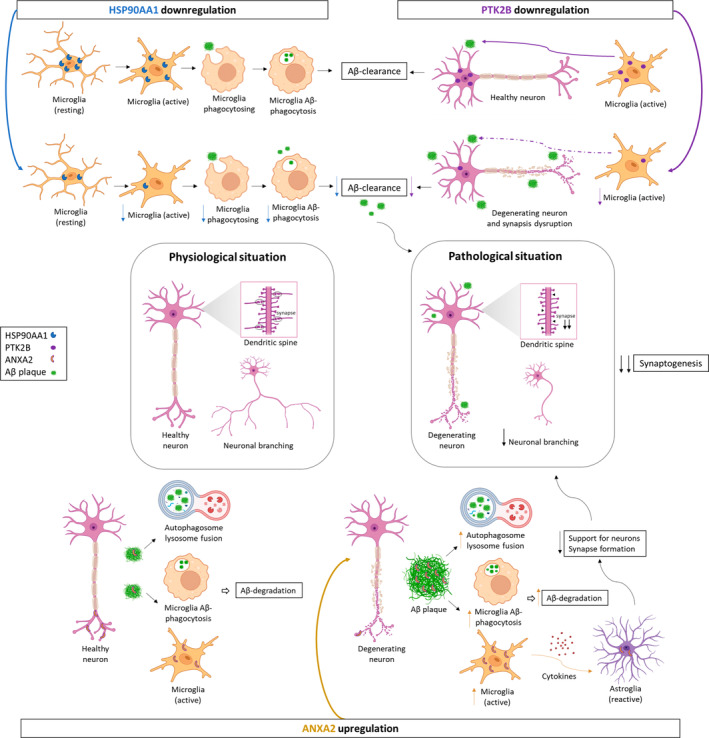
Potential role of HSP90AA1, PTK2B, and ANXA2 in synaptic decline through microglial cells in AD. HSP90AA1 promotes Aβ clearance through activation of microglial phagocytosis in AD. Its downregulation decreases microglial activation, phagocytosis, and consequently Aβ clearance at synapses. PTK2B, expressed in neurons, promotes normal macrophage polarization and migration to inflamed areas in synaptic structures. However, PTK2B is downregulated, and consequently, microglial cell activation and migration to Aβ deposits are reduced, contributing to neurodegeneration and synapse disruption. ANXA2, present in neurons as well, could contain Aβ pathology through autophagosome‐lysosome fusion and the activation of microglial cells. Therefore, its upregulation could increase autophagosome‐lysosome fusion and Aβ‐mediated microglial activation and subsequently promote Aβ degradation. On the other hand, active microglia secrete proinflammatory cytokines that can damage neurons either directly or indirectly by activating neurotoxic astrocytes. Additionally, ANXA2 is expressed in reactive astrocytes, which lose many normal astrocytic functions, including neuron support and synapse formation. As a result, it leads to the formation of fewer and weaker synapses and a decline in synaptogenesis. Therefore, synaptic homeostasis is disrupted with a marked decrease in the growth and branching of dendrites and axons, and neurodegeneration occurs in the EC of AD patients. Figure created with BioRender.com. Aβ, amyloid‐β; AD, Alzheimer's disease; EC, entorhinal cortex.
5. CONCLUSIONS
In conclusion, this report implicates synaptogenesis as the most disrupted signaling pathway in the human EC in AD, and HSP90AA1, PTK2B, and ANXA2 proteins are highlighted as key factors that could aggravate synaptic decline via microglia. Notably, ANXA2 could also be involved in the containment of Aβ plaques by astroglial cells. Therefore, a better understanding of microglia–synapse signaling events and astroglia‐Aβ burden is needed to prevent synaptic dysfunction, neurodegeneration, and cognitive decline. Moreover, an analysis of human cases in early or intermediate stages of the disease would allow to further research the glial responses to the progression of AD pathology. This information would be helpful in elucidating AD pathogenesis, thus improving diagnostics and therapeutics for AD.
AUTHOR CONTRIBUTIONS
VAL, IUB and AFC contributed to experimental design and data collection; VAL, SVC and MGR performed the experiments and analyzed data; VAL and DSS contributed to interpretation of the proteomic data and statistical analysis; VAL and AMM wrote the manuscript. All authors read and approved the final manuscript.
FUNDING INFORMATION
Sponsored by the UCLM/ERDF (2022‐GRIN‐34200 to N. P. N. D.), the Spanish Ministry of Science and Innovation (grant no. PID2019‐108659RB‐I00 to A. M.‐M.), and the Autonomous Government of Castilla‐La Mancha/ERDF (grant no. SBPLY/17/180501/000430 to A. M.‐M. and D.S.‐S. and SBPLY/21/180501/000093 to A. M.‐M. and I. U.‐B). S.V.‐C. and M.G.‐R. held predoctoral fellowships granted by UCLM/ESF.
CONFLICT OF INTEREST STATEMENT
The authors declare no conflicts of interest.
ETHICS STATEMENT
Postmortem human brain samples were collected and processed following standard operating procedures with the approval of the Clinical Research Ethics Committee of Ciudad Real University Hospital (PID2019‐108659RBI00). These processes included obtaining the donors' written consent.
PERMISSION TO REPRODUCE MATERIAL FROM OTHER SOURCES
The authors have obtained the corresponding permissions from other sources such as Biorender.
CLINICAL TRIAL REGISTRATION
Not applicable.
Supporting information
DATA S1: Proteomic‐bioinformatic data supporting the findings of this study.
FIGURE S1: Validation of proteomic results through western blotting: HSP90AA1, PTK2B, and ANXA2.
MOVIE S1: ANXA2 showing an intense relationship with Aβ plaques.
ACKNOWLEDGMENTS
We are particularly grateful for the generous contribution of the patients and the collaboration of Institut d'Investigacions Biomèdiques August Pi i Sunyer (IDIBAPS), Biobanco en Red de la Región de Murcia (BIOBANC‐MUR), Biobanco de Tejidos de la Fundación CIEN (BTCIEN), and Biobanco del Principado de Asturias (BPA), registered on the Registro Nacional de Biobancos. In addition, the experiments were carried out in the facilities of the Ciudad Real Medical School UCAI. This work is part of the doctoral thesis of Veronica Astillero Lopez.
Astillero‐Lopez V, Villar‐Conde S, Gonzalez‐Rodriguez M, Flores‐Cuadrado A, Ubeda‐Banon I, Saiz‐Sanchez D, et al. Proteomic analysis identifies HSP90AA1, PTK2B, and ANXA2 in the human entorhinal cortex in Alzheimer's disease: Potential role in synaptic homeostasis and Aβ pathology through microglial and astroglial cells. Brain Pathology. 2024;34(4):e13235. 10.1111/bpa.13235
Contributor Information
Isabel Ubeda‐Banon, Email: isabel.ubeda@uclm.es.
Daniel Saiz‐Sanchez, Email: daniel.saiz@uclm.es.
DATA AVAILABILITY STATEMENT
The datasets analyzed during the current study are available in the ProteomeXchange Consortium (http://proteomecentral.proteomexchange.org) via the PRIDE partner repository with the dataset identifier PXD029359 (Username: reviewer_pxd029359@ebi.ac.uk; Password: 9ZBBqh6c). The data supporting the findings of this study are available in Supplementary Material. Raw data are available from the corresponding author, upon reasonable request.
REFERENCES
- 1. Scheltens P, De Strooper B, Kivipelto M, Holstege H, Chetelat G, Teunissen CE, et al. Alzheimer's disease. Lancet. 2021;397(10284):1577–1590. [DOI] [PMC free article] [PubMed] [Google Scholar]
- 2. Vinters HV. Emerging concepts in Alzheimer's disease. Annu Rev Pathol. 2015;10:291–319. [DOI] [PubMed] [Google Scholar]
- 3. Prusiner SB. Cell biology. A unifying role for prions in neurodegenerative diseases. Science. 2012;336(6088):1511–1513. [DOI] [PMC free article] [PubMed] [Google Scholar]
- 4. Peng C, Trojanowski JQ, Lee VM. Protein transmission in neurodegenerative disease. Nat Rev Neurol. 2020;16(4):199–212. [DOI] [PMC free article] [PubMed] [Google Scholar]
- 5. Henstridge CM, Hyman BT, Spires‐Jones TL. Beyond the neuron‐cellular interactions early in Alzheimer disease pathogenesis. Nat Rev Neurosci. 2019;20(2):94–108. [DOI] [PMC free article] [PubMed] [Google Scholar]
- 6. Martini‐Stoica H, Cole AL, Swartzlander DB, Chen F, Wan YW, Bajaj L, et al. TFEB enhances astroglial uptake of extracellular tau species and reduces tau spreading. J Exp Med. 2018;215(9):2355–2377. [DOI] [PMC free article] [PubMed] [Google Scholar]
- 7. Bolos M, Llorens‐Martin M, Jurado‐Arjona J, Hernandez F, Rabano A, Avila J. Direct evidence of internalization of tau by microglia in vitro and in vivo. J Alzheimers Dis. 2016;50(1):77–87. [DOI] [PubMed] [Google Scholar]
- 8. Narasimhan S, Changolkar L, Riddle DM, Kats A, Stieber A, Weitzman SA, et al. Human tau pathology transmits glial tau aggregates in the absence of neuronal tau. J Exp Med. 2020;217(2):e20190783. [DOI] [PMC free article] [PubMed] [Google Scholar]
- 9. Venegas C, Kumar S, Franklin BS, Dierkes T, Brinkschulte R, Tejera D, et al. Microglia‐derived ASC specks cross‐seed amyloid‐beta in Alzheimer's disease. Nature. 2017;552(7685):355–361. [DOI] [PubMed] [Google Scholar]
- 10. Krabbe G, Halle A, Matyash V, Rinnenthal JL, Eom GD, Bernhardt U, et al. Functional impairment of microglia coincides with Beta‐amyloid deposition in mice with Alzheimer‐like pathology. PloS One. 2013;8(4):e60921. [DOI] [PMC free article] [PubMed] [Google Scholar]
- 11. Braak H, Alafuzoff I, Arzberger T, Kretzschmar H, Del Tredici K. Staging of Alzheimer disease‐associated neurofibrillary pathology using paraffin sections and immunocytochemistry. Acta Neuropathol. 2006;112(4):389–404. [DOI] [PMC free article] [PubMed] [Google Scholar]
- 12. Witter MP. The perforant path: projections from the entorhinal cortex to the dentate gyrus. Prog Brain Res. 2007;163:43–61. [DOI] [PubMed] [Google Scholar]
- 13. Ubeda‐Banon I, Saiz‐Sanchez D, Flores‐Cuadrado A, Rioja‐Corroto E, Gonzalez‐Rodriguez M, Villar‐Conde S, et al. The human olfactory system in two proteinopathies: Alzheimer's and Parkinson's diseases. Transl Neurodegener. 2020;9(1):22. [DOI] [PMC free article] [PubMed] [Google Scholar]
- 14. Qasim SE, Miller J, Inman CS, Gross RE, Willie JT, Lega B, et al. Memory retrieval modulates spatial tuning of single neurons in the human entorhinal cortex. Nat Neurosci. 2019;22(12):2078–2086. [DOI] [PMC free article] [PubMed] [Google Scholar]
- 15. Squire LR, Stark CE, Clark RE. The medial temporal lobe. Annu Rev Neurosci. 2004;27:279–306. [DOI] [PubMed] [Google Scholar]
- 16. Pini L, Pievani M, Bocchetta M, Altomare D, Bosco P, Cavedo E, et al. Brain atrophy in Alzheimer's disease and aging. Ageing Res Rev. 2016;30:25–48. [DOI] [PubMed] [Google Scholar]
- 17. Gomez‐Isla T, Hollister R, West H, Mui S, Growdon JH, Petersen RC, et al. Neuronal loss correlates with but exceeds neurofibrillary tangles in Alzheimer's disease. Ann Neurol. 1997;41(1):17–24. [DOI] [PubMed] [Google Scholar]
- 18. Astillero‐Lopez V, Gonzalez‐Rodriguez M, Villar‐Conde S, Flores‐Cuadrado A, Martinez‐Marcos A, Ubeda‐Banon I, et al. Neurodegeneration and astrogliosis in the entorhinal cortex in Alzheimer's disease: stereological layer‐specific assessment and proteomic analysis. Alzheimers Dement. 2022;18(12):2468–2480. [DOI] [PubMed] [Google Scholar]
- 19. Xu J, Patassini S, Rustogi N, Riba‐Garcia I, Hale BD, Phillips AM, et al. Regional protein expression in human Alzheimer's brain correlates with disease severity. Commun Biol. 2019;2:43. [DOI] [PMC free article] [PubMed] [Google Scholar]
- 20. Li KW, Ganz AB, Smit AB. Proteomics of neurodegenerative diseases: analysis of human post‐mortem brain. J Neurochem. 2019;151(4):435–445. [DOI] [PMC free article] [PubMed] [Google Scholar]
- 21. Mendonca CF, Kuras M, Nogueira FCS, Pla I, Hortobagyi T, Csiba L, et al. Proteomic signatures of brain regions affected by tau pathology in early and late stages of Alzheimer's disease. Neurobiol Dis. 2019;130:104509. [DOI] [PubMed] [Google Scholar]
- 22. Gonzalez‐Rodriguez M, Villar‐Conde S, Astillero‐Lopez V, Villanueva‐Anguita P, Ubeda‐Banon I, Flores‐Cuadrado A, et al. Neurodegeneration and astrogliosis in the human CA1 hippocampal subfield are related to hsp90ab1 and bag3 in Alzheimer's disease. Int J Mol Sci. 2021;23(1):165. [DOI] [PMC free article] [PubMed] [Google Scholar]
- 23. Ferrer I, Andres‐Benito P, Ausin K, Pamplona R, Del Rio JA, Fernandez‐Irigoyen J, et al. Dysregulated protein phosphorylation: a determining condition in the continuum of brain aging and Alzheimer's disease. Brain Pathol. 2021;31(6):e12996. [DOI] [PMC free article] [PubMed] [Google Scholar]
- 24. Jia Y, Wang X, Chen Y, Qiu W, Ge W, Ma C. Proteomic and transcriptomic analyses reveal pathological changes in the entorhinal cortex region that correlate well with dysregulation of ion transport in patients with Alzheimer's disease. Mol Neurobiol. 2021;58(8):4007–4027. [DOI] [PubMed] [Google Scholar]
- 25. Mai JK, Paxinos G, Voss T. Atlas of the human brain. 3rd ed. San Diego, CA: Elsevier Science; 2008. [Google Scholar]
- 26. DeKosky ST, Scheff SW. Synapse loss in frontal cortex biopsies in Alzheimer's disease: correlation with cognitive severity. Ann Neurol. 1990;27(5):457–464. [DOI] [PubMed] [Google Scholar]
- 27. Spires‐Jones TL, Hyman BT. The intersection of amyloid beta and tau at synapses in Alzheimer's disease. Neuron. 2014;82(4):756–771. [DOI] [PMC free article] [PubMed] [Google Scholar]
- 28. Griffiths J, Grant SGN. Synapse pathology in Alzheimer's disease. Semin Cell Dev Biol. 2023;139:13–23. [DOI] [PubMed] [Google Scholar]
- 29. Ou JR, Tan MS, Xie AM, Yu JT, Tan L. Heat shock protein 90 in Alzheimer's disease. Biomed Res Int. 2014;2014:796869. [DOI] [PMC free article] [PubMed] [Google Scholar]
- 30. Bohush A, Bieganowski P, Filipek A. Hsp90 and its co‐chaperones in neurodegenerative diseases. Int J Mol Sci. 2019;20(20):4976. [DOI] [PMC free article] [PubMed] [Google Scholar]
- 31. Lee VM, Brunden KR, Hutton M, Trojanowski JQ. Developing therapeutic approaches to tau, selected kinases, and related neuronal protein targets. Cold Spring Harb Perspect Med. 2011;1(1):a006437. [DOI] [PMC free article] [PubMed] [Google Scholar]
- 32. Blair LJ, Sabbagh JJ, Dickey CA. Targeting Hsp90 and its co‐chaperones to treat Alzheimer's disease. Expert Opin Ther Targets. 2014;18(10):1219–1232. [DOI] [PMC free article] [PubMed] [Google Scholar]
- 33. Campanella C, Pace A, Caruso Bavisotto C, Marzullo P, Marino Gammazza A, Buscemi S, et al. Heat shock proteins in Alzheimer's disease: role and targeting. Int J Mol Sci. 2018;19(9):2603. [DOI] [PMC free article] [PubMed] [Google Scholar]
- 34. Zhang M, Qian C, Zheng ZG, Qian F, Wang Y, Thu PM, et al. Jujuboside a promotes Abeta clearance and ameliorates cognitive deficiency in Alzheimer's disease through activating Axl/HSP90/PPARgamma pathway. Theranostics. 2018;8(15):4262–4278. [DOI] [PMC free article] [PubMed] [Google Scholar]
- 35. Smajic S, Prada‐Medina CA, Landoulsi Z, Ghelfi J, Delcambre S, Dietrich C, et al. Single‐cell sequencing of human midbrain reveals glial activation and a Parkinson‐specific neuronal state. Brain. 2022;145(3):964–978. [DOI] [PMC free article] [PubMed] [Google Scholar]
- 36. Menegon A, Burgaya F, Baudot P, Dunlap DD, Girault JA, Valtorta F. FAK+ and PYK2/CAKbeta, two related tyrosine kinases highly expressed in the central nervous system: similarities and differences in the expression pattern. Eur J Neurosci. 1999;11(11):3777–3788. [DOI] [PubMed] [Google Scholar]
- 37. Giralt A, Brito V, Chevy Q, Simonnet C, Otsu Y, Cifuentes‐Diaz C, et al. Pyk2 modulates hippocampal excitatory synapses and contributes to cognitive deficits in a Huntington's disease model. Nat Commun. 2017;8:15592. [DOI] [PMC free article] [PubMed] [Google Scholar]
- 38. Dourlen P, Fernandez‐Gomez FJ, Dupont C, Grenier‐Boley B, Bellenguez C, Obriot H, et al. Functional screening of Alzheimer risk loci identifies PTK2B as an in vivo modulator and early marker of tau pathology. Mol Psychiatry. 2017;22(6):874–883. [DOI] [PMC free article] [PubMed] [Google Scholar]
- 39. Sayas CL, Avila J. GSK‐3 and tau: a key duet in Alzheimer's disease. Cell. 2021;10(4):721. [DOI] [PMC free article] [PubMed] [Google Scholar]
- 40. Brody AH, Nies SH, Guan F, Smith LM, Mukherjee B, Salazar SA, et al. Alzheimer risk gene product Pyk2 suppresses tau phosphorylation and phenotypic effects of tauopathy. Mol Neurodegener. 2022;17(1):32. [DOI] [PMC free article] [PubMed] [Google Scholar]
- 41. Li C, Gotz J. Pyk2 is a novel tau tyrosine kinase that is regulated by the tyrosine kinase Fyn. J Alzheimers Dis. 2018;64(1):205–221. [DOI] [PMC free article] [PubMed] [Google Scholar]
- 42. Okigaki M, Davis C, Falasca M, Harroch S, Felsenfeld DP, Sheetz MP, et al. Pyk2 regulates multiple signaling events crucial for macrophage morphology and migration. Proc Natl Acad Sci U S A. 2003;100(19):10740–10745. [DOI] [PMC free article] [PubMed] [Google Scholar]
- 43. Zhao WQ, Lu B. Expression of annexin A2 in GABAergic interneurons in the normal rat brain. J Neurochem. 2007;100(5):1211–1223. [DOI] [PubMed] [Google Scholar]
- 44. Gauthier‐Kemper A, Weissmann C, Golovyashkina N, Sebo‐Lemke Z, Drewes G, Gerke V, et al. The frontotemporal dementia mutation R406W blocks tau's interaction with the membrane in an annexin A2‐dependent manner. J Cell Biol. 2011;192(4):647–661. [DOI] [PMC free article] [PubMed] [Google Scholar]
- 45. Gauthier‐Kemper A, Suarez Alonso M, Sundermann F, Niewidok B, Fernandez MP, Bakota L, et al. Annexins A2 and A6 interact with the extreme N terminus of tau and thereby contribute to tau's axonal localization. J Biol Chem. 2018;293(21):8065–8076. [DOI] [PMC free article] [PubMed] [Google Scholar]
- 46. Bustos V, Pulina MV, Bispo A, Lam A, Flajolet M, Gorelick FS, et al. Phosphorylated presenilin 1 decreases beta‐amyloid by facilitating autophagosome‐lysosome fusion. Proc Natl Acad Sci U S A. 2017;114(27):7148–7153. [DOI] [PMC free article] [PubMed] [Google Scholar]
- 47. Gonzalez‐Rodriguez M, Villar‐Conde S, Astillero‐Lopez V, Villanueva‐Anguita P, Ubeda‐Banon I, Flores‐Cuadrado A, et al. Human amygdala involvement in Alzheimer's disease revealed by stereological and dia‐PASEF analysis. Brain Pathol. 2023;33:e13180. [DOI] [PMC free article] [PubMed] [Google Scholar]
- 48. Eberhard DA, Brown MD, VandenBerg SR. Alterations of annexin expression in pathological neuronal and glial reactions. Immunohistochemical localization of annexins I, II (p36 and p11 subunits), IV, and VI in the human hippocampus. Am J Pathol. 1994;145(3):640–649. [PMC free article] [PubMed] [Google Scholar]
- 49. Pineda D, Ampurdanes C, Medina MG, Serratosa J, Tusell JM, Saura J, et al. Tissue plasminogen activator induces microglial inflammation via a noncatalytic molecular mechanism involving activation of mitogen‐activated protein kinases and Akt signaling pathways and AnnexinA2 and Galectin‐1 receptors. Glia. 2012;60(4):526–540. [DOI] [PubMed] [Google Scholar]
- 50. Lier J, Streit WJ, Bechmann I. Beyond activation: characterizing microglial functional phenotypes. Cell. 2021;10(9):2236. [DOI] [PMC free article] [PubMed] [Google Scholar]
- 51. Hansen DV, Hanson JE, Sheng M. Microglia in Alzheimer's disease. J Cell Biol. 2018;217(2):459–472. [DOI] [PMC free article] [PubMed] [Google Scholar]
- 52. Condello C, Yuan P, Schain A, Grutzendler J. Microglia constitute a barrier that prevents neurotoxic protofibrillar Abeta42 hotspots around plaques. Nat Commun. 2015;6:6176. [DOI] [PMC free article] [PubMed] [Google Scholar]
- 53. Leyns CEG, Holtzman DM. Glial contributions to neurodegeneration in tauopathies. Mol Neurodegener. 2017;12(1):50. [DOI] [PMC free article] [PubMed] [Google Scholar]
- 54. Liddelow SA, Guttenplan KA, Clarke LE, Bennett FC, Bohlen CJ, Schirmer L, et al. Neurotoxic reactive astrocytes are induced by activated microglia. Nature. 2017;541(7638):481–487. [DOI] [PMC free article] [PubMed] [Google Scholar]
- 55. Rajendran L, Paolicelli RC. Microglia‐mediated synapse loss in Alzheimer's disease. J Neurosci. 2018;38(12):2911–2919. [DOI] [PMC free article] [PubMed] [Google Scholar]
- 56. Piccioni G, Mango D, Saidi A, Corbo M, Nistico R. Targeting microglia‐synapse interactions in Alzheimer's disease. Int J Mol Sci. 2021;22(5):2342. [DOI] [PMC free article] [PubMed] [Google Scholar]
- 57. Liddelow S, Barres B. SnapShot: astrocytes in health and disease. Cell. 2015;162(5):1170–1170.e1. [DOI] [PubMed] [Google Scholar]
Associated Data
This section collects any data citations, data availability statements, or supplementary materials included in this article.
Supplementary Materials
DATA S1: Proteomic‐bioinformatic data supporting the findings of this study.
FIGURE S1: Validation of proteomic results through western blotting: HSP90AA1, PTK2B, and ANXA2.
MOVIE S1: ANXA2 showing an intense relationship with Aβ plaques.
Data Availability Statement
The datasets analyzed during the current study are available in the ProteomeXchange Consortium (http://proteomecentral.proteomexchange.org) via the PRIDE partner repository with the dataset identifier PXD029359 (Username: reviewer_pxd029359@ebi.ac.uk; Password: 9ZBBqh6c). The data supporting the findings of this study are available in Supplementary Material. Raw data are available from the corresponding author, upon reasonable request.


