

Highlights
-
•
Delineation variation in liver metastases on MRI was 1.6 mm standard deviation.
-
•
Delineation variation after peer review was reduced to 1.3 mm standard deviation.
-
•
A correlation was found between delineation variation and tumor regularity.
-
•
Delineation variation was not significantly correlated with primary tumor origin.
Keywords: Liver metastases, MRI, Tumor delineation, GTV, Interobserver variation (IOV), Quality assurance (QA)
Abstract
Background and purpose
Magnetic Resonance Imaging (MRI) guided stereotactic body radiotherapy (SBRT) of liver metastases is an upcoming high-precision non-invasive treatment. Interobserver variation (IOV) in tumor delineation, however, remains a relevant uncertainty for planning target volume (PTV) margins. The aims of this study were to quantify IOV in MRI-based delineation of the gross tumor volume (GTV) of liver metastases and to detect patient-specific factors influencing IOV.
Materials and methods
A total of 22 patients with liver metastases from three primary tumor origins were selected (colorectal(8), breast(6), lung(8)). Delineation guidelines and planning MRI-scans were provided to eight radiation oncologists who delineated all GTVs. All delineations were centrally peer reviewed to identify outliers not meeting the guidelines. Analyses were performed both in- and excluding outliers. IOV was quantified as the standard deviation (SD) of the perpendicular distance of each observer’s delineation towards the median delineation. The correlation of IOV with shape regularity, tumor origin and volume was determined.
Results
Including all delineations, average IOV was 1.6 mm (range 0.6–3.3 mm). From 160 delineations, in total fourteen single delineations were marked as outliers after peer review. After excluding outliers, the average IOV was 1.3 mm (range 0.6–2.3 mm). There was no significant correlation between IOV and tumor origin or volume. However, there was a significant correlation between IOV and regularity (Spearman’s ρs = -0.66; p = 0.002).
Conclusion
MRI-based IOV in tumor delineation of liver metastases was 1.3–1.6 mm, from which PTV margins for IOV can be calculated. Tumor regularity and IOV were significantly correlated, potentially allowing for patient-specific margin calculation.
1. Introduction
Stereotactic body radiation therapy (SBRT) aims to ablate tumors by accurately delivering high biologically effective doses of radiation. This non-invasive therapy has shown to be successful in treating liver metastases with one- and two-year local control rates up to 95 % and 90 % respectively [1], [2]. However, delivering the required high doses is not always feasible when organs at risk (OAR) are in close proximity to the target. In these situations, either the prescribed dose or planning target volume (PTV) coverage can be compromised in order to meet OAR dose constraints [3], [4].
Reducing geometric uncertainties in the treatment chain may reduce required PTV margins and the need to compromise prescribed dose or PTV coverage. Magnetic resonance-guided radiotherapy (MRgRT) provides superior soft tissue contrast in the visualization of liver metastasis [5], [6], [7]. It has the potential to deliver more precise and accurate treatment with reduced margins [4] and is therefore an upcoming modality for the treatment of liver metastases [8], [9], [10], [11], [12].
However, in order to fully utilize the precision of MRgRT, accurate delineation of the gross tumor volume (GTV) is of great importance. As interobserver variation (IOV) in delineation can be considered a systematic error, substantial PTV margins might be required [13], [14].
Delineation of liver metastases can be challenging due to the substantial variation in tumor shape, visibility and conspicuity. Variability in delineations can lead to both inconsistencies in defining the GTV and, when compensated for, large PTV margins, potentially affecting treatment outcomes. However, IOV of liver metastasis for margin calculation is not well studied. Jensen et al. [15] studied IOV for both primary and metastatic liver tumors on CT with the aim to determine the added value of dynamic perfusion CT. For that purpose, Dice coefficients were reported, which are not useful in PTV margin calculation. Marshall et al. [16] studied IOV to compare three different Magnetic Resonance Imaging (MRI) sequences with Computed Tomography (CT)-based delineation, reporting an IOV of 1.2 mm – 1.6 mm standard deviation. However, the main purpose of their work (Marshall et al.) was to determine the optimal imaging modality and with only three observers, it is limited to accurately determine IOV for margin calculation. Furthermore, this work focusses exclusively on colorectal metastasis.
Moreover, it is well established that quality assurance (QA) through peer review can reduce treatment variation. For this reason, in many institutes, it is standard practice that a second physician checks GTV delineation to detect protocol deviations and outliers in delineation choices [17]. In order for IOV determination to be applicable to clinical practice, such peer review should therefore also be taken into account.
The aims of this paper were to quantify IOV in MRI-based delineation of the GTV of liver metastasis for margin calculation. Multiple patient-specific factors influencing IOV, such as primary tumor origin, are considered, which allow for the study of personalized treatment strategies. Peer review helps to improve contour quality and therefore its impact on IOV is also taken into account in this study.
2. Materials and methods
2.1. Patients and observers
Twenty-two liver metastases from twenty-two patients, treated with SBRT in a single institute, were retrospectively included in this study. Patients had different primary tumor origins: colorectal cancer (CRC) (n = 8, 36 %), breast cancer (n = 6, 28 %) or non-small cell lung cancer (NSCLC) (n = 8, 36 %). Cases were consecutively selected per tumor origin and assessed for eligibility. Cases were excluded in case of; tumors including markers, patients with multiple metastases, scan mismatch between different contrast phases, scans with substantial artefacts or poor quality. After exclusion of two cases (see methods section 2.4) median age was 65 (IQR: 57–70) years. The patient cohort consisted of ten males and ten females. An overview of tumor origin, liver segment and baseline patient and tumor characteristics are presented in Table 1.
Table 1.
Baseline and quantitative information on delineated cases (analysis 1), cases with ablation cavities were excluded (n=2). All values per GTV are presented as the median over all observers and the totals (last row) as the median over all GTVs. The exception being the IOV, which was calculated as the RMS over all observers and GTVs respectively.
| Case |
Age (years, IQR) |
Gender | Primary tumor | Liver segment |
IOV (mm, RMS) |
Volume (cm3) |
Regularity | Dice |
HD max (mm) |
|---|---|---|---|---|---|---|---|---|---|
| GTV 1 | 66 | Male | CRC | S4/8 | 2.3 | 33.7 | 0.72 | 0.89 | 2.8 |
| GTV 2 | 72 | Male | CRC | S8 | 3.3 | 24.6 | 0.73 | 0.86 | 4.9 |
| GTV 3 | 84 | Male | CRC | S5 | 0.9 | 7.6 | 0.82 | 0.87 | 2.3 |
| GTV 4 | 64 | Female | CRC | S7 | 2.0 | 1.4 | 0.77 | 0.65 | 4.2 |
| GTV 5 | 69 | Male | CRC | S8 | 1.5 | 21.7 | 0.81 | 0.88 | 3.1 |
| GTV 6 | 85 | Male | CRC | S7 | 0.7 | 1.6 | 0.88 | 0.77 | 2.2 |
| GTV 7 | 66 | Female | Breast | S4/8 | 0.6 | 4.7 | 0.93 | 0.90 | 1.9 |
| GTV 8 | 42 | Female | Breast | S4 | 1.8 | 38.4 | 0.80 | 0.88 | 3.4 |
| GTV 9 | 32 | Female | Breast | S8 | 2.0 | 3.3 | 0.84 | 0.84 | 3.0 |
| GTV 10 | 61 | Female | Breast | S8 | 1.1 | 5.4 | 0.88 | 0.84 | 2.7 |
| GTV 11 | 49 | Female | Breast | S5/8 | 0.9 | 1.9 | 0.81 | 0.79 | 2.6 |
| GTV 12 | 62 | Female | Breast | S7 | 1.2 | 3.6 | 0.82 | 0.85 | 2.5 |
| GTV 13 | 76 | Male | NSCLC | S7 | 0.8 | 3.7 | 0.85 | 0.78 | 2.5 |
| GTV 14 | 57 | Female | NSCLC | S4A | 0.9 | 5.0 | 0.86 | 0.84 | 2.3 |
| GTV 15 | 57 | Male | NSCLC | S5 | 1.2 | 25.1 | 0.89 | 0.92 | 2.7 |
| GTV 16 | 56 | Male | NSCLC | S7(6) | 1.9 | 100.3 | 0.84 | 0.92 | 2.7 |
| GTV 17 | 69 | Male | NSCLC | S7 | 1.1 | 29.6 | 0.89 | 0.92 | 2.6 |
| GTV 18 | 65 | Female | NSCLC | S8 | 2.7 | 4.9 | 0.79 | 0.75 | 4.1 |
| GTV 19 | 55 | Male | NSCLC | S6/7 | 1.1 | 30.4 | 0.86 | 0.90 | 2.9 |
| GTV 20 | 80 | Female | NSCLC | S4B | 1.7 | 54.7 | 0.83 | 0.88 | 3.8 |
| Total | 65 (57–70) | 1.6 | 6.5 | 0.84 | 0.87 | 2.7 |
Abbreviations: IQR = interquartile range, IOV = interobserver variation (mm) calculated as root mean square (RMS), HD max = maximum Hausdorff distance (mm), Liver segment according to Couinaud classification, CRC = colorectal carcinoma, NSCLC = non-small cell lung carcinoma.
Eight observers from eight institutes participated in this study. All observers were radiation oncologists with experience in the treatment of liver metastases. All data was pseudonomized before distribution. The study was approved by the local Institutional Review Board (number IRBd21-289, date 28-04-2022).
2.2. Imaging
MRI scans were performed according to local protocol on two 3 T scanners (Achieva dStream and Ingenia, Philips Healthcare, The Netherlands) including 3DT1-weighted DIXON with intravenous contrast and expiratory breathhold for all patients. Contrast agents used for the scans were either Dotarem or Primovist. The contrast phases were non-contrast (t = 0 s), arterial (t = 25 s), portal venous (t = 90 s), intermediate (t = 180 s) and hepatobiliary phase (t = 20 min).
2.3. Contouring procedure and delineation protocol
Each observer received delineation guidelines for the GTV of liver metastases (Supplementary material A). The guidelines were established and discussed in a consensus meeting including two dedicated liver radiation oncologists and one dedicated abdominal radiologist. For each case, observers were provided with relevant information on MRI scans and patient history. Prior to delineating the full data set, each observer contoured a test case to assess feasibility of the procedure and data collection. No technical issues were found, but the test case did show different observers using different contrast phases as primary scan to guide their decisions. This was resolved by assigning one contrast phase as the primary (scan) which was subsequently included in the guidelines (for the full data set). The observers were instructed to delineate the GTV of all patients according to the guidelines, with the aim of creating a delineation suitable for MRgRT in daily practice. All observers delineated the cases in the Monaco treatment planning system [Elekta AB, Stockholm, Sweden] and were blinded to the delineations of other observers.
Observers were provided with two to four scans (contrast phases) per case. One scan was designated as the primary scan to optimize consistency in delineation decisions. This was chosen by AH and JP. The first [AH] was one of the observers who delineated all cases (final delineation process was four months later) and the latter [JP] was in charge of the logistics and methods of this study, but was not one of the observers. The choice of the primary scan was implemented to ensure that the same reference scan was used by all observers. This was based on image quality, visibility of the tumor and surrounding tissue, artefacts and the initial report of a radiologist. Observers were instructed to delineate based on the primary scan, adjusting their delineation only on other (secondary, tertiary etc.) scans if these were of added value (e.g. improved visualization of the tumor contour with nearby vessels, visual on different contrast phases than the primary scan).
2.4. Contour assessment and outlier detection (peer review)
Outliers were assessed to distinguish between true delineation variation and misinterpretation of the data (e.g. inclusion of healthy tissue, which was captured as a clear protocol violation). Furthermore, daily clinical practice often employs an independent peer review by a second physician as part of quality assurance (QA) to detect possible incongruities. To replicate this daily practice, peer review was simulated by central review. To identify a contour as an outlier, a standardized approach was used per patient (n = 22). Contours were (peer) reviewed by two observers (JP, MN), the latter being one of the initial observers who delineated the cases. Throughout peer review, efforts were made to maintain a degree of blinding, ensuring that the two observers were generally unaware of who had contoured each delineation. This was however not guaranteed in the entire review process. Nevertheless, this reflects peer review procedures in clinical practice (QA). Contours were excluded, based on one of the following three criteria; (1) use of secondary scan only, (2) inclusion of obvious adjacent normal tissue structures (e.g. vessels, (healthy) liver parenchyma) or (3) missing parts of obvious gross tumor volume by peer review.
Two cases had a tumor at the border of an ablation cavity. Despite the delineation guidelines stating not to include the cavity, observers varied significantly in in- or excluding these cavities. Therefore, these two cases were assessed as not eligible for further analysis after which they were excluded. Twenty cases remained for the full data set. Hereafter, IOV analyses were performed on two data sets; the first analysis was performed on all delineations (analysis 1) and the second analysis on a subgroup excluding outliers (analysis 2).
2.5. Contour analyses
Analyses were performed using in-house developed software (Match42, version 1.0). Contours were converted to surface mesh by triangulation and a median surface was generated as the 50 % isosurface of the accumulated tumor masks after smoothing. From each vertex of the median surface, the signed distance perpendicular to the surface to each delineated surface was determined and the surface weighted root mean square (RMS) over all vertices of the standard deviation (SD) over the observed dependent distances per vertex was calculated. For each patient this SD was used to quantify IOV. Volume (V) and surface area (SA) were calculated from the median surface. The tumor regularity was determined using the formula; regularity (sphericity) = . A regularity of 1 means the tumor has a perfect spherical shape, while regularity < 1 indicates an increasingly irregular shape.
2.6. Statistical analyses
Differences in IOV between primary tumor origins were analyzed for significance using the Kruskal-Wallis test. Further statistical analyses were performed on analysis 2 (without outliers). The correlation between IOV and tumor volume, as well as IOV and regularity, was tested using the Spearman's rank correlation test (ρs). We considered a p-value < 0.05 as statistically significant. All statistical analyses were performed using R software, version 4.2.1 [R Core Team, 2021].
3. Results
3.1. Qualitative results and outliers
Following peer review and outlier assessment of the remaining twenty cases, a total of zero (in ten cases), one (in six cases) or two (in four cases) delineations were excluded (Supplementary material B). Figs. 1a-c display three examples that represent each of the three exclusion criteria.
Fig. 1.


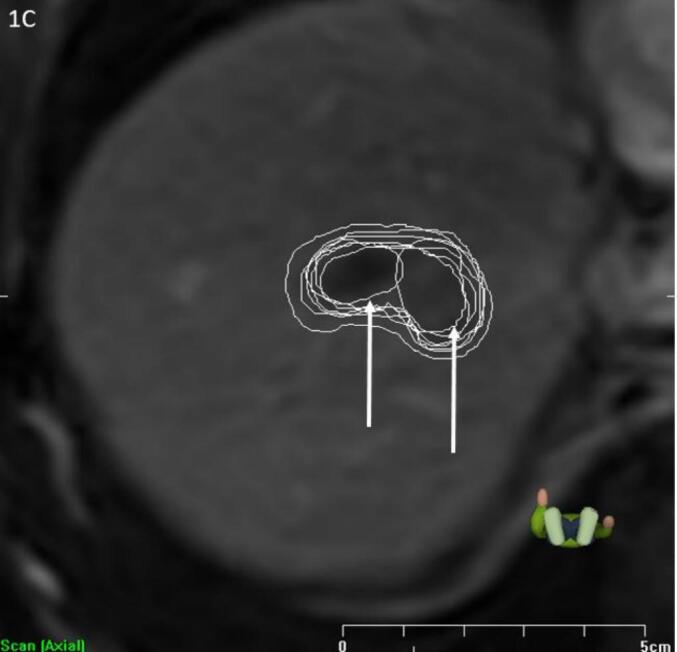
a-c Examples of exclusion criteria (indicated by arrow). A) Exclusion criterion 1: Use of secondary scan only, one observer excluded; B) Exclusion criterion 2: Inclusion of obvious adjacent normal tissue structures (e.g. vessels, (healthy) liver parenchyma, bile ducts etc.), two observers excluded; C) Exclusion criterion 3: Missing parts of obvious gross tumor volume, two observers excluded.
Fig. 2a shows an example of a case with low IOV (SD = 0.6 mm), whereas Fig. 2b shows an example with a higher IOV (SD = 2.3 mm).
Fig. 2a-b.

Examples of high and low interobserver variation. A) Low interobserver variation (IOV = 0.6 mm, regularity = 0.93). Left: axial view, right: coronal view. B) High interobserver variation (IOV = 2.3 mm, regularity = 0.72). Left: axial view, right: sagittal view.
3.2. Quantitative and statistical analyses
An overview of tumor characteristics are presented in Table 1, Table 2, Table 3. The median volume of all contours and those without outliers were 6.5 cm3 (IQR 3.7–29.8 cm3) and 7.4 cm3 (IQR 3.8–29.8) respectively (Table 3). The root mean square (RMS) of the IOV was 1.6 mm (range 0.6–3.3) and 1.3 mm (range 0.6–2.3) in analysis 1 and 2. The median regularity was 0.84 (IQR 0.80–0.87) in analysis 1 and similar in the group with outliers removed (analysis 2), 0.84 (IQR 0.79–0.87). IOV and volume per histological subtype in both analyses are presented in Table 3. The Kruskal-Wallis test did not reveal any significant differences in both analyses in IOV between primary tumor origins (p = 0.59 in analysis 1, p = 0.52 in analysis 2). There was no statistical significant correlation between IOV and volume (Spearman’s ρs = 0.45, p = 0.051) in analysis 2. However, there was a significant negative correlation in analysis 2 between IOV and regularity of the tumor (ρs = -0.66, p = 0.002), shown in Fig. 3. Fig. 2a-b shows two examples of the correlation between IOV and regularity.
Table 2.
Quantitative information on delineated cases excluding outliers (analysis 2), cases with ablation cavities were excluded (n = 2). All values per GTV are presented as the median over all observers and the totals (last row) as the median over all GTVs. The exception being the IOV, which was calculated as the RMS over all observers and GTVs respectively.
| Case | IOV (mm) | Volume (cm3) | Regularity | Dice | HD max (mm) |
|---|---|---|---|---|---|
| GTV 1 | 2.3 | 33.7 | 0.72 | 0.89 | 2.8 |
| GTV 2 | 1.6 | 22.1 | 0.72 | 0.87 | 3.2 |
| GTV 3 | 0.8 | 7.8 | 0.82 | 0.88 | 2.2 |
| GTV 4 | 1.6 | 1.7 | 0.76 | 0.68 | 4.0 |
| GTV 5 | 1.5 | 22.9 | 0.76 | 0.88 | 3.0 |
| GTV 6 | 0.7 | 1.6 | 0.88 | 0.77 | 2.2 |
| GTV 7 | 0.6 | 4.7 | 0.93 | 0.90 | 1.9 |
| GTV 8 | 1.8 | 38.4 | 0.80 | 0.88 | 3.4 |
| GTV 9 | 1.3 | 3.3 | 0.84 | 0.83 | 2.7 |
| GTV 10 | 0.9 | 5.4 | 0.88 | 0.86 | 2.3 |
| GTV 11 | 0.9 | 1.9 | 0.81 | 0.79 | 2.5 |
| GTV 12 | 1.0 | 3.9 | 0.83 | 0.86 | 2.2 |
| GTV 13 | 0.8 | 3.7 | 0.85 | 0.78 | 2.5 |
| GTV 14 | 0.9 | 5.0 | 0.86 | 0.84 | 2.3 |
| GTV 15 | 1.2 | 25.1 | 0.89 | 0.92 | 2.7 |
| GTV 16 | 1.0 | 101.6 | 0.84 | 0.92 | 2.6 |
| GTV 17 | 1.1 | 29.6 | 0.89 | 0.92 | 2.6 |
| GTV 18 | 1.4 | 7.1 | 0.76 | 0.79 | 2.0 |
| GTV 19 | 1.1 | 30.4 | 0.86 | 0.90 | 2.9 |
| GTV 20 | 1.3 | 47.9 | 0.82 | 0.90 | 3.8 |
| Total | 1.3 | 7.4 | 0.84 | 0.88 | 2.6 |
Abbreviations: IOV = interobserver variation (mm) calculated as root mean square (RMS), HD max = maximum Hausdorff distance (mm).
Table 3.
Overview per histological subtype and in total in analyses 1 and 2 of interobserver variation (IOV) measured as standard deviation (SD) in millimetres (mm) and median volume (cm3).
|
All contours (analysis 1) |
Outliers excluded (analysis 2) |
|||
|---|---|---|---|---|
| IOV in mm (IQR) | Volume in cm3 (IQR) | IOV in mm (IQR) | Volume in cm3 (IQR) | |
| CRC | 2.0 (1.0 – 2.2) | 14.6 (3.1–23.9) | 1.5 (1.0 – 1.6) | 14.9 (3.2–22.7) |
| Breast | 1.3 (0.9–1.6) | 4.2 (3.4–5.3) | 1.1 (0.8 – 1.2) | 4.3 (3.4–5.3) |
| NSCLC | 1.5 (1.1 – 1.7) | 27.3 (5.0–36.4) | 1.1 (1.0 – 1.2) | 27.3 (6.6–34.8) |
| Total | 1.6 (0.9 – 1.9) | 6.5 (3.7–29.8) | 1.3 (0.9 – 1.5) | 7.4 (3.8–29.8) |
Fig. 3.

Scatterplot of IOV versus regularity of the tumor shape (ρs = -0.66; p = 0.002) in analysis 2. Size of single cases corresponds with volume.
4. Discussion
Interobserver variation (IOV) in delineation is an important factor in determining (MR-guided) radiotherapy treatment margins, as uncertainties in target delineation can lead to suboptimal dose delivery. The data from this study are important to gain clarity on the integration of IOV into the calculation of accurate treatment margins, ultimately optimizing the precision and success of radiotherapy for liver metastases. We quantified IOV in the delineation of liver metastases using MRI with and without peer review by a second physician and its implications for treatment margins. IOV was 1.6 mm SD which was reduced to 1.3 mm SD after peer review. Furthermore, a correlation was found between delineation variation and tumor regularity, potentially enabling personalized margins based on shape of the tumor.
IOV is typically a systematic error in the treatment which can be taken into account using treatment margins. In the most straightforward approach, the standard deviation of IOV is quadratically added to any other systematic error and a margin of 2.5*SD is used [13]. Margins, however, are not intended to take outliers (e.g. due to protocol violations) into account. These outliers should be tackled via other means, like peer review. In the absence of other systematic errors, our findings then result in treatment margins for delineation uncertainty of 4.0 mm, which was reduced to 3.3 mm after peer review.
The factor of 2.5 might be an underestimation of the required margins when an uneven distribution of ‘pimples and dimples’ over the median surface is taken into account. For example, Peulen et al. [18] reported a factor of 2.8–3.2 to be more appropriate.
On the other hand, it has been shown that when observers are less certain, they tend to delineate larger volumes [19]. Under the assumption that large IOV correlates with less certainty, suggesting that a large IOV does not necessarily require a large margin, as the median delineation of the physicians might overestimate the target. However, verifying such assumptions is challenging to validate without pathological comparison.
In the context of online plan adaptation (including daily re-contouring), the nature of the error due to IOV might change, potentially influencing the required margin. The reason is that online re-contouring might change the IOV partially from a systematic error into a random error. However, the extent to which errors are propagated to each fraction and how this influences PTV margins in MRgRT, remains an open question.
IOV for liver metastasis has been previously studied. Jensen et al [15] evaluated the added value of dynamic contrast enhanced (DCE) CT to contrast enhanced 4DCT in delineating the GTV of both liver metastases and hepatocellular carcinoma (HCC) and found a Dice of 0.81 and 0.76 on DCE-CT and 4DCT for liver metastases respectively, which was worse compared to our study. In a recent study of Marshall et al [16], the authors aimed to determine the optimal image acquisition for delineation, including CT and three MRI sequences (MR LAVA, SSFSE and DWI). The MR LAVA (MR liver acquisition volume acquisition), which is similar to the MR sequence used in our study, showed the lowest IOV leading to margins of 3.1 mm, as well similar to our study. However, determining IOV was not their primary aim and with ten colorectal cases with three observers, this study presented less robust data on reproducibility of margin determination [20].
Literature shows that independent peer review of delineations captures delineation errors and improves accuracy and consistency [17]. This process is often implemented in clinical practice as part of QA. A recent study on peer review of delineation in head and neck cancer showed that delineations are often (35 %) adjusted with major deviations after peer review and these led to improved target localization [17]. Our data confirms the importance of peer review with a reduction of IOV from 1.6 mm to 1.3 mm SD. Delineation errors, such as the inclusion of the vena cava, were detected through this review. Our study therefore highlights the importance of peer review in the delineation of liver metastases.
Furthermore, IOV can vary considerably among patients. Therefore, we studied the influence of tumor volume, primary tumor type and regularity on IOV. While we found substantial differences between CRC (SD after peer review was 1.5 mm) and breast and NSCLC (SD after peer review was 1.1 mm), our study was not powered to find significance. Different tumor origins, and thus histological variations, might be related to underlying factors influencing IOV such as tumor shape (regularity). We found a significant correlation between regularity and IOV, suggesting reduced margins can be applied for more spherical tumors. This underscores the potential to personalize margins in the future.
As is assessed in a systematic review by Guzene et al [20], the number of cases and observers in our study was sufficient to assess reproducibility of IOV studies. However, the authors emphasize the need for clear contouring guidelines as well. Although we did provide a well-established guideline for each patient on delineation and background information, we noted that observers did not always adhere to them or interpreted them differently. This is applicable to the two excluded cases including a tumor on the border of an ablation cavity, often challenging and atypical cases. Observers showed variability in tumor and cavity contours (true IOV) and a clinical decision on in- or excluding the ablation cavity (data misinterpretation), whereas the guidelines instructed to not include the ablation cavity. In clinical practice, physicians would consult a radiologist and adhere to the protocol of their institute on contour decisions. We hypothesize that some statements were misinterpreted between observers, showing the need for clearer guidelines and peer review of delineations.
Limitations of our study are the limited patient cohort, including patients varying in primary tumor origin, volume or tumor shape (regularity). While a significant correlation was nevertheless found between IOV and regularity (tumor shape), the correlation of IOV with volume was not significant at p = 0.051. Furthermore, the absence of a clear protocol for delineation of liver metastases in existing literature underscores the challenges that were experienced. Although efforts were made in this study to establish realistic and useful guidelines, the relevance and necessity of comprehensive contouring guidelines persists.
Our results provided novel insights and accurate data on IOV in the delineation of liver metastases. Based on these results, we implemented personalized margins based on tumor regularity, using 2.5 mm for irregular GTVs and 1.5 mm for regular GTVs in our clinical practice. This significantly reduced the clinical PTV margins, compared to the previously used 3.0 mm SD for IOV as a systematic error. For the total PTV margin, other uncertainties such as set-up errors, intra- and interfraction motion and breathing motion were included as well. A more detailed explanation of these (geometric) uncertainties in MR-guided liver SBRT at our institute has been discussed and published by van de Lindt et al [11].
In conclusion, we found delineation IOV for MRgRT of liver metastases of 1.3–1.6 mm, from which PTV margins for IOV can be calculated. While peer review helps to reduce the margins, delineation variation remains a relevant uncertainty. Personalized margins, based on GTV regularity, appears to be feasible and might be tested and implemented in future treatments.
Funding
This research was supported by an institutional grant of the Dutch Cancer Society (KWF) and the Dutch Ministry of Health, Welfare and Sport. Our institute is a member of the Elekta MR Linac consortium.
CRediT authorship contribution statement
Julia E. Peltenburg: Conceptualization, Formal analysis, Investigation, Methodology, Project administration, Writing – original draft. Ali Hosni: Conceptualization, Investigation, Methodology, Writing – review & editing. Rana Bahij: Investigation, Writing – review & editing. Simon Boeke: Investigation, Writing – review & editing. Pètra M. Braam: Investigation, Writing – review & editing. William A. Hall: Investigation, Writing – review & editing. Martijn P. W. Intven: Investigation, Writing – review & editing. Luca Nicosia: Investigation, Writing – review & editing. Jan-Jakob Sonke: Conceptualization, Methodology, Supervision, Writing – review & editing. Marnix Witte: Formal analysis, Writing – review & editing. Marlies E. Nowee: Conceptualization, Investigation, Methodology, Supervision, Writing – review & editing. Tomas Janssen: Conceptualization, Methodology, Formal analysis, Supervision, Writing – original draft.
Declaration of Competing Interest
The authors declare that they have no known competing financial interests or personal relationships that could have appeared to influence the work reported in this paper.
Acknowledgements
Not applicable.
Footnotes
Supplementary data to this article can be found online at https://doi.org/10.1016/j.phro.2024.100592.
Appendix A. Supplementary data
The following are the Supplementary data to this article:
Data availability
Unavailable
References
- 1.Andratschke N., Alheid H., Allgäuer M., Becker G., Blanck O., Boda-Heggemann J., et al. The SBRT database initiative of the German Society for Radiation Oncology (DEGRO): patterns of care and outcome analysis of stereotactic body radiotherapy (SBRT) for liver oligometastases in 474 patients with 623 metastases. BMC Cancer. 2018;18:283. doi: 10.1186/s12885-018-4191-2. [DOI] [PMC free article] [PubMed] [Google Scholar]
- 2.Kok E.N.D., Jansen E.P.M., Heeres B.C., Kok N.F.M., Janssen T., van Werkhoven E., et al. High versus low dose Stereotactic Body Radiation Therapy for hepatic metastases. Clin Transl Radiat Oncol. 2020;20:45–50. doi: 10.1016/j.ctro.2019.11.004. [DOI] [PMC free article] [PubMed] [Google Scholar]
- 3.Miften M., Vinogradskiy Y., Moiseenko V., Grimm J., Yorke E., Jackson A., et al. Radiation Dose-Volume Effects for Liver SBRT. Int J Radiat Oncol Biol Phys. 2021;110:196–205. doi: 10.1016/j.ijrobp.2017.12.290. [DOI] [PMC free article] [PubMed] [Google Scholar]
- 4.Weykamp F., Katsigiannopulos E., Piskorski L., Regnery S., Hoegen P., Ristau J., et al. Dosimetric Benefit of Adaptive Magnetic Resonance-Guided Stereotactic Body Radiotherapy of Liver Metastases. Cancers. 2022;14:6041. doi: 10.3390/cancers14246041. [DOI] [PMC free article] [PubMed] [Google Scholar]
- 5.Namasivayam S., Martin D.R., Saini S. Imaging of liver metastases: MRI. Cancer Imaging. 2007;7:2–9. doi: 10.1102/1470-7330.2007.0002. [DOI] [PMC free article] [PubMed] [Google Scholar]
- 6.Sica G.T., Ji H., Ros P.R. CT and MR Imaging of Hepatic Metastases. Am J Roentgenol. 2000;174:691–698. doi: 10.2214/ajr.174.3.1740691. [DOI] [PubMed] [Google Scholar]
- 7.Pech M., Mohnike K., Wieners G., Bialek E., Dudeck O., Seidensticker M., et al. Radiotherapy of Liver Metastases. Strahlenther Onkol. 2008;184:256–261. doi: 10.1007/s00066-008-1849-8. [DOI] [PubMed] [Google Scholar]
- 8.Bordeau K., Michalet M., Keskes A., Valdenaire S., Debuire P., Cantaloube M., et al. Stereotactic MR-Guided Radiotherapy for Liver Metastases: First Results of the Montpellier Prospective Registry Study. J Clin Med. 2023;12 doi: 10.3390/jcm12031183. [DOI] [PMC free article] [PubMed] [Google Scholar]
- 9.Weykamp F., Hoegen P., Regnery S., Katsigiannopulos E., Renkamp C.K., Lang K., et al. Long-Term Clinical Results of MR-Guided Stereotactic Body Radiotherapy of Liver Metastases. Cancers (Basel) 2023;15 doi: 10.3390/cancers15102786. [DOI] [PMC free article] [PubMed] [Google Scholar]
- 10.Ugurluer G., Mustafayev T.Z., Gungor G., Atalar B., Abacioglu U., Sengoz M., et al. Stereotactic MR-guided online adaptive radiation therapy (SMART) for the treatment of liver metastases in oligometastatic patients: initial clinical experience. Radiat Oncol J. 2021;39:33–40. doi: 10.3857/roj.2020.00976. [DOI] [PMC free article] [PubMed] [Google Scholar]
- 11.van de Lindt T.N., Nowee M.E., Janssen T., Schneider C., Remeijer P., van Pelt V.W.J., et al. Technical feasibility and clinical evaluation of 4D-MRI guided liver SBRT on the MR-linac. Radiot Oncol. 2022;167:285–291. doi: 10.1016/j.radonc.2022.01.009. [DOI] [PubMed] [Google Scholar]
- 12.Uder L., Nachbar M., Butzer S., Boldt J., Baumeister S., Bitzer M., et al. Local control and patient reported outcomes after online MR guided stereotactic body radiotherapy of liver metastases. Front Oncol. 2022;12:1095633. doi: 10.3389/fonc.2022.1095633. [DOI] [PMC free article] [PubMed] [Google Scholar]
- 13.van Herk M., Remeijer P., Rasch C., Lebesque J.V. The probability of correct target dosage: dose-population histograms for deriving treatment margins in radiotherapy. Int J Radiat Oncol Biol Phys. 2000;47:1121–1135. doi: 10.1016/s0360-3016(00)00518-6. [DOI] [PubMed] [Google Scholar]
- 14.Segedin B., Petric P. Uncertainties in target volume delineation in radiotherapy - are they relevant and what can we do about them? Radiol Oncol. 2016;50:254–262. doi: 10.1515/raon-2016-0023. [DOI] [PMC free article] [PubMed] [Google Scholar]
- 15.Jensen N.K., Mulder D., Lock M., Fisher B., Zener R., Beech B., et al. Dynamic contrast enhanced CT aiding gross tumor volume delineation of liver tumors: an interobserver variability study. Radiot Oncol. 2014;111:153–157. doi: 10.1016/j.radonc.2014.01.026. [DOI] [PubMed] [Google Scholar]
- 16.Marshall C., Thirion P., Mihai A., Armstrong J.G., Cournane S., Hickey D., et al. Interobserver Variability of Gross Tumor Volume Delineation for Colorectal Liver Metastases Using Computed Tomography and Magnetic Resonance Imaging. Adv Radiat Oncol. 2023;8 doi: 10.1016/j.adro.2022.101020. [DOI] [PMC free article] [PubMed] [Google Scholar]
- 17.Cardenas C.E., Mohamed A.S.R., Tao R., Wong A.J.R., Awan M.J., Kuruvila S., et al. Prospective Qualitative and Quantitative Analysis of Real-Time Peer Review Quality Assurance Rounds Incorporating Direct Physical Examination for Head and Neck Cancer Radiation Therapy. Int J Radiat Oncol Biol Phys. 2017;98:532–540. doi: 10.1016/j.ijrobp.2016.11.019. [DOI] [PMC free article] [PubMed] [Google Scholar]
- 18.Peulen H., Belderbos J., Guckenberger M., Hope A., Grills I., van Herk M., et al. Target delineation variability and corresponding margins of peripheral early stage NSCLC treated with stereotactic body radiotherapy. Radiot Oncol. 2015;114:361–366. doi: 10.1016/j.radonc.2015.02.011. [DOI] [PubMed] [Google Scholar]
- 19.Giraud P., Elles S., Helfre S., De Rycke Y., Servois V., Carette M.F., et al. Conformal radiotherapy for lung cancer: different delineation of the gross tumor volume (GTV) by radiologists and radiation oncologists. Radiot Oncol. 2002;62:27–36. doi: 10.1016/s0167-8140(01)00444-3. [DOI] [PubMed] [Google Scholar]
- 20.Guzene L., Beddok A., Nioche C., Modzelewski R., Loiseau C., Salleron J., et al. Assessing Interobserver Variability in the Delineation of Structures in Radiation Oncology: A Systematic Review. Int J Radiat Oncol Biol Phys. 2023;115:1047–1060. doi: 10.1016/j.ijrobp.2022.11.021. [DOI] [PubMed] [Google Scholar]
Associated Data
This section collects any data citations, data availability statements, or supplementary materials included in this article.
Supplementary Materials
Data Availability Statement
Unavailable