

Key Points
Question
Cardiac arrest frequently occurs without explanation, even after a thorough clinical evaluation. Can a simple maneuver clinically diagnose calcium release deficiency syndrome (CRDS), a newly described cause of sudden death?
Findings
In this international, multicenter, case-control study, a provoked measure of T-wave amplitude on an electrocardiogram ascertained cases of CRDS with high accuracy. The genetic mouse models recapitulated the human findings and suggested a pathologically large systolic calcium release from the sarcoplasmic reticulum was responsible.
Meaning
These preliminary results suggest that the repolarization response on an electrocardiogram to brief tachycardia followed by a pause may effectively diagnose CRDS. Given the frequency of unexplained cardiac arrest, should these findings be confirmed in larger studies, this readily available maneuver may provide clinically actionable information.
Abstract
Importance
Sudden death and cardiac arrest frequently occur without explanation, even after a thorough clinical evaluation. Calcium release deficiency syndrome (CRDS), a life-threatening genetic arrhythmia syndrome, is undetectable with standard testing and leads to unexplained cardiac arrest.
Objective
To explore the cardiac repolarization response on an electrocardiogram after brief tachycardia and a pause as a clinical diagnostic test for CRDS.
Design, Setting, and Participants
An international, multicenter, case-control study including individual cases of CRDS, 3 patient control groups (individuals with suspected supraventricular tachycardia; survivors of unexplained cardiac arrest [UCA]; and individuals with genotype-positive catecholaminergic polymorphic ventricular tachycardia [CPVT]), and genetic mouse models (CRDS, wild type, and CPVT were used to define the cellular mechanism) conducted at 10 centers in 7 countries. Patient tracings were recorded between June 2005 and December 2023, and the analyses were performed from April 2023 to December 2023.
Intervention
Brief tachycardia and a subsequent pause (either spontaneous or mediated through cardiac pacing).
Main Outcomes and Measures
Change in QT interval and change in T-wave amplitude (defined as the difference between their absolute values on the postpause sinus beat and the last beat prior to tachycardia).
Results
Among 10 case patients with CRDS, 45 control patients with suspected supraventricular tachycardia, 10 control patients who experienced UCA, and 3 control patients with genotype-positive CPVT, the median change in T-wave amplitude on the postpause sinus beat (after brief ventricular tachycardia at ≥150 beats/min) was higher in patients with CRDS (P < .001). The smallest change in T-wave amplitude was 0.250 mV for a CRDS case patient compared with the largest change in T-wave amplitude of 0.160 mV for a control patient, indicating 100% discrimination. Although the median change in QT interval was longer in CRDS cases (P = .002), an overlap between the cases and controls was present. The genetic mouse models recapitulated the findings observed in humans and suggested the repolarization response was secondary to a pathologically large systolic release of calcium from the sarcoplasmic reticulum.
Conclusions and Relevance
There is a unique repolarization response on an electrocardiogram after provocation with brief tachycardia and a subsequent pause in CRDS cases and mouse models, which is absent from the controls. If these findings are confirmed in larger studies, this easy to perform maneuver may serve as an effective clinical diagnostic test for CRDS and become an important part of the evaluation of cardiac arrest.
Case-control study including individual cases of calcium release deficiency syndrome (CRDS), 3 patient control groups, and genetic mouse models assesses the cardiac repolarization response on an electrocardiogram after brief tachycardia and a pause as a clinical diagnostic test for CRDS.
Introduction
Sudden cardiac death remains a leading cause of mortality in the world.1,2 Despite contemporary investigation strategies, more than 20 000 individuals are estimated to experience an unexplained cardiac arrest each year in the US alone.3 Failing to identify an underlying cause of sudden cardiac death and cardiac arrest precludes delivery of optimal care, furthers psychological distress in survivors and families, and may leave family members vulnerable to similarly catastrophic outcomes because of the possibility of a genetic contribution.4,5
Two factors contributing to unexplained cardiac arrest include undiscovered disorders and an inability to diagnose a known disease. In this context, calcium release deficiency syndrome (CRDS) is a heart condition discovered by our group in 2021 that causes sudden cardiac death.6,7,8,9 Calcium release deficiency syndrome develops secondary to loss-of-function genetic variants within the RYR2 gene, which encodes the cardiac ryanodine receptor.10 The CRDS clinical phenotype is undetectable and diagnosis requires cellular-based in vitro studies after identification of a rare RYR2 genetic variant.6
Importantly, unless previously reported, rare RYR2 variants are most often classified as variants of unknown significance.11,12 Without access to RYR2 in vitro analyses, which are only available in research settings, clinicians cannot diagnose patients with CRDS, and cardiac events are classified as unexplained or are misdiagnosed. Equally problematic, first-degree relatives carrying RYR2 variants remain undiagnosed, which has been documented to lead to recurrent and previously perceived unexplained familial sudden cardiac death.6,7,8,9
There is an urgent need for a simple and reliable clinical diagnostic test for CRDS. Members of our group previously reported on a family’s history of catecholaminergic polymorphic ventricular tachycardia in the presence of an RYR2-p.M4109R variant, wherein the affected family members developed marked and transient cardiac repolarization changes (QT prolongation associated with a tall and broad T wave) after pacing-mediated tachycardia and a subsequent pause.13 Catecholaminergic polymorphic ventricular tachycardia is a life-threatening arrhythmia syndrome caused by RYR2 gain-of-function variants, and malignant arrhythmia events most often occur during intense exercise or emotion.14,15
The adrenergic-mediated ventricular arrhythmias characteristic of catecholaminergic polymorphic ventricular tachycardia can be readily reproduced on exercise stress testing (the standard clinical diagnostic test); however, the exercise stress tests conducted in this family yielded normal results.16,17 Since publication of the report,13 in vitro characterization of the RYR2-p.M4109R variant has revealed that it causes a loss of function of the protein/ion channel7 and the familial clinical diagnosis has been revised to CRDS.
Driven by these observations, our group sought to determine if this provoked repolarization abnormality may be a sensitive and specific electrocardiographic signature of CRDS. We then sought to explore the underlying cellular mechanism using genetic mouse models.
Methods
Patient Selection
This international, multicenter case-control study included study patients from 10 centers in 7 countries. The response to brief tachycardia and a subsequent pause was evaluated in cases with CRDS and 3 control groups. The first control group included patients with suspected supraventricular tachycardia undergoing an invasive electrophysiology study. The second control group included survivors of unexplained cardiac arrest. The third control group included patients with genotype-positive catecholaminergic polymorphic ventricular tachycardia.
All CRDS cases had to possess an RYR2 variant that had been confirmed to be a loss-of-function variant using cellular-based in vitro testing.6 Patients with suspected supraventricular tachycardia were excluded if they had ventricular cardiomyopathy, known obstructive coronary artery disease (coronary stenosis >50%), ventricular preexcitation, or a diagnosis of long QT syndrome. Survivors of unexplained cardiac arrest underwent defibrillation, but their cardiac arrest remained unexplained after undergoing electrocardiographic, echocardiographic, and coronary assessments; cardiac magnetic resonance imaging; exercise stress testing; and genetic testing.18,19 Genetic testing included a screening of RYR2. When a rare RYR2 variant was identified, cellular-based in vitro studies were performed to confirm the variant did not have an effect on function.
Details of cellular-based in vitro studies for RYR2 variants appear in the eMethods in Supplement 1. Patients with genotype-positive catecholaminergic polymorphic ventricular tachycardia were either heterozygous for an RYR2 gain-of-function variant or homozygous or compound heterozygous for pathogenic CASQ2 variants.20 Individuals were excluded if they were being treated with a QT-prolonging medication (other than flecainide) at the time of their pacing-mediated or spontaneous provocation.
Patients with suspected supraventricular tachycardia, CRDS, unexplained cardiac arrest, or catecholaminergic polymorphic ventricular tachycardia were enrolled as part of the ongoing Evaluation of a Clinical Diagnostic Test for CRDS (DIAGNOSE CRDS) study (NCT06188689). The trial protocol was approved by the research ethics boards of Hamilton Health Sciences and select collaborating institutions. The remaining patients had either previously undergone comparable pacing maneuvers, had a spontaneous rhythm that mirrored the maneuvers, or the treating clinical team deemed the maneuvers to be part of standard care. In each instance, the study patient provided consent for their clinical data to be used for research.
Pacing Maneuvers
Among patients with suspected supraventricular tachycardia, β-blockers, calcium channel blockers, and antiarrhythmic drugs were withheld for 5 or greater half-lives prior to performing the maneuvers. The decision to withhold these medications in patients with CRDS, catecholaminergic polymorphic ventricular tachycardia, and unexplained cardiac arrest was at the discretion of the treating clinician and was documented. Study patients with an existing transvenous cardiac device could have the pacing maneuvers performed through their device. The pacing maneuvers in the control patients with suspected supraventricular tachycardia were performed at the time of their invasive electrophysiology study and in the absence of isoproterenol or other β-agonists. Continuous 12-lead electrocardiography was required to capture (at a minimum) the last sinus beat before the pacing train, the pacing train, and 3 postpacing beats.
Among the study patients who underwent pacing maneuvers prospectively, 10 beat right ventricular and atrial pacing trains were requested to be performed at 120 beats/min and 150 beats/min. Pacing trains with atrioventricular Wenckebach, noncaptured beats, premature atrial or ventricular ectopy that interrupted the postpacing pause, or a postpacing pause of less than 700 milliseconds were excluded.
Electrocardiographic Analyses
Electrocardiographic measurements were performed using scaled electronic calipers on the digitalized or scanned tracings by an electrophysiologist (Z.D.) blinded to case status. The QT interval was measured in leads II and V5 using the tangent method.21,22,23,24,25 T-wave amplitude was measured as the vertical distance between the peak or nadir of the T wave and the isoelectric line (defined by the TP segment). Changes in QT interval and changes in T-wave amplitude were determined by subtracting the value of the parameter for the last beat prior to the pacing train from the value for the first postpacing beat (eFigure 1 in Supplement 1). Changes in T-wave amplitude were assessed for all 12 leads (when available) and the largest value was used for the analyses.
Adjudication of a diagnosis of CRDS was performed by 2 cardiologists (C.V. and B.N.) who assessed 20 blinded tracings (10 cases of CRDS and 10 controls) to ascertain the sensitivity and specificity of the electrocardiographic findings for a CRDS diagnosis through visual review alone.
Murine Studies
Intracardiac pacing was performed in anesthetized mice with RYR2-D4646A+/− (CRDS), RYR2-I4855M+/− (CRDS with left ventricular noncompaction), RYR2-WT (wild type), and RYR2-R4496C+/− (catecholaminergic polymorphic ventricular tachycardia) variants (aged 8-16 weeks in both males and females) using a 1.1-F octapolar (8 electrodes) catheter (EPR-800, Millar Instruments). Details of the cardiac pacing, surface electrocardiographic tracings, and other analyses appear in the eMethods in Supplement 1.
Monophasic action potential and bipolar electrographic recordings of hearts with the RYR2-WT, RYR2-D4646A+/−, and RYR2-R4496C+/− variants were performed between 8 and 16 weeks of age, whereas intact heart calcium imaging from these mouse models was performed at 8 to 25 weeks of age.26,27,28,29,30 Additional details appear in the eMethods in Supplement 1.
Statistical Analyses
Normally distributed continuous variables are presented as mean (SD). Nonnormally distributed continuous variables are presented as median (IQR). Normally distributed data were compared using the t test for 2 groups and 1-way analysis of variance followed by Bonferroni post hoc tests for 3 groups or more. Nonnormally distributed data were compared using the Mann-Whitney test for 2 groups and the Kruskal-Wallis test with the Dunn post hoc test for 3 groups or more. Categorical variables are presented as number (percentage) and were compared using the Fisher exact test.
The sensitivity analyses (using linear regression models) comparing human CRDS cases vs controls were performed for both the change in T-wave amplitude and the change in QT interval (for brief ventricular tachycardia at ≥150 beats/min) and included age, sex, and familial relatedness as covariables. Two-tailed P values <.05 were considered statistically significant. The statistical analyses were performed using IBM SPSS Statistics version 26 (for Windows; IBM).
Results
Among 10 patients with CRDS, 45 control patients with suspected supraventricular tachycardia, 10 control patients who experienced unexplained cardiac arrest, and 3 control patients with genotype-positive catecholaminergic polymorphic ventricular tachycardia, the median change in T-wave amplitude on the postpause sinus beat (after brief ventricular tachycardia at ≥150 beats/min) was higher in patients with CRDS (P < .001). The patients had episodes of brief ventricular tachycardia followed by a pause (either through pacing or spontaneously) that permitted evaluation of a repolarization response (Table; eFigure 2 and eTable 1 in Supplement 1). The CRDS cases were derived from 6 families possessing 6 distinct RYR2 variants previously confirmed to result in a loss of function of the protein/ion channel (eTables 1-2 in Supplement 1).6,7,9
Table. Baseline Clinical Characteristics.
| Characteristic | Calcium release deficiency syndrome (n = 10) | Control groups | ||
|---|---|---|---|---|
| Supraventricular tachycardia (n = 45) | Unexplained cardiac arrest (n = 10) | Catecholaminergic polymorphic ventricular tachycardia (n = 3) | ||
| Age, median (IQR), ya,b | 16.0 (14.5-41.0) | 51.0 (41.5-63.0) | 33.0 (26.5-46.0) | 30.7 (1.5) |
| Sex, No. (%) | ||||
| Female | 4 (40) | 17 (37.8) | 3 (30) | 2 (67) |
| Male | 6 (60) | 28 (62.2) | 7 (70) | 1 (33) |
| Race, No. (%)c | ||||
| Asian | 0 | 4 (8.9) | 0 | 0 |
| Black or African American | 0 | 1 (2.2) | 0 | 0 |
| White | 10 (100) | 40 (88.9) | 10 (100) | 3 (100) |
| Body mass index, median (IQR)b,d | 24.6 (19.3-30.9) | 26.0 (22.5-29.5) | 25.1 (23.2-27.9) | 21.0 (5.8) |
| Medical history, No. (%)e | ||||
| Prior cardiac arrest | 4 (40) | 0 | 10 (100) | 3 (100) |
| Hypertension | 0 | 9 (20) | 0 | 0 |
| Diabetes | 0 | 2 (4.4) | 0 | 0 |
| Medications, No. (%)a | ||||
| Flecainide | 2 (20) | 0 | 0 | 1 (33.3) |
| β-Blockers | 2 (20) | 0 | 2 (20) | 2 (66.7) |
| Calcium channel blockers | 0 | 0 | 1 (10) | 0 |
| Electrocardiographic features, median (IQR), msb | ||||
| PR interval | 151.5 (132.3-185.8) | 158.0 (139.0-173.5) | 157.5 (132.3-173.0) | 153.7 (24.1) |
| QRS interval | 90.5 (85.3-102.5) | 98.0 (90.0-103.0) | 98.5 (91.8-105.5) | 83.0 (9.2) |
| QTc interval | 427.0 (388.8-440.8) | 431.8 (404.2-451.2) | 395.5 (378.5-419) | 410.5 (34.7) |
At the time of evaluation of the provoked repolarization response.
Data in last column are expressed as mean (SD).
Participants self-identified race.
Calculated as weight in kilograms divided by height in meters squared.
Collected by patient report.
Of the 10 patients with CRDS, 5 were asymptomatic family members, 4 had survived a cardiac arrest requiring defibrillation, and 1 had experienced unexplained syncope. Two of the 10 unexplained cardiac arrest cases carried rare RYR2 variants (RYR2-p.Ala1806Thr and RYR2-p.Asn2386Ser) that did not have an effect on function (eFigure 3 in Supplement 1). Two catecholaminergic polymorphic ventricular tachycardia cases had RYR2 gain-of-function variants (p.Ser2425Tyr and p.Asn628Tyr). The third case was compound heterozygous for pathogenic CASQ2 variants (p.Tyr55Cys and p.Ser173Ile).
Repolarization Response to Brief Tachycardia and a Pause
Of the 10 cases with CRDS, 6 had previously undergone comparable pacing maneuvers, 3 prospectively underwent the ventricular pacing maneuvers, and 1 had a spontaneous episode of nonsustained ventricular tachycardia followed by a pause that enabled assessment of a repolarization response (eFigure 2 and eFigures 4-6 in Supplement 1). After ventricular burst pacing or nonsustained ventricular tachycardia at 150 beats/min or greater, the morphology of the T wave most often appeared tall and broad on the first postpacing beat (Figure 1 and eFigure 4 in Supplement 1).
Figure 1. Representative Electrocardiographic Tracings of the Cardiac Repolarization Response to Brief Tachycardia and a Pause in a Patient With Calcium Release Deficiency Syndrome and in a Control Patient With Supraventricular Tachycardia.
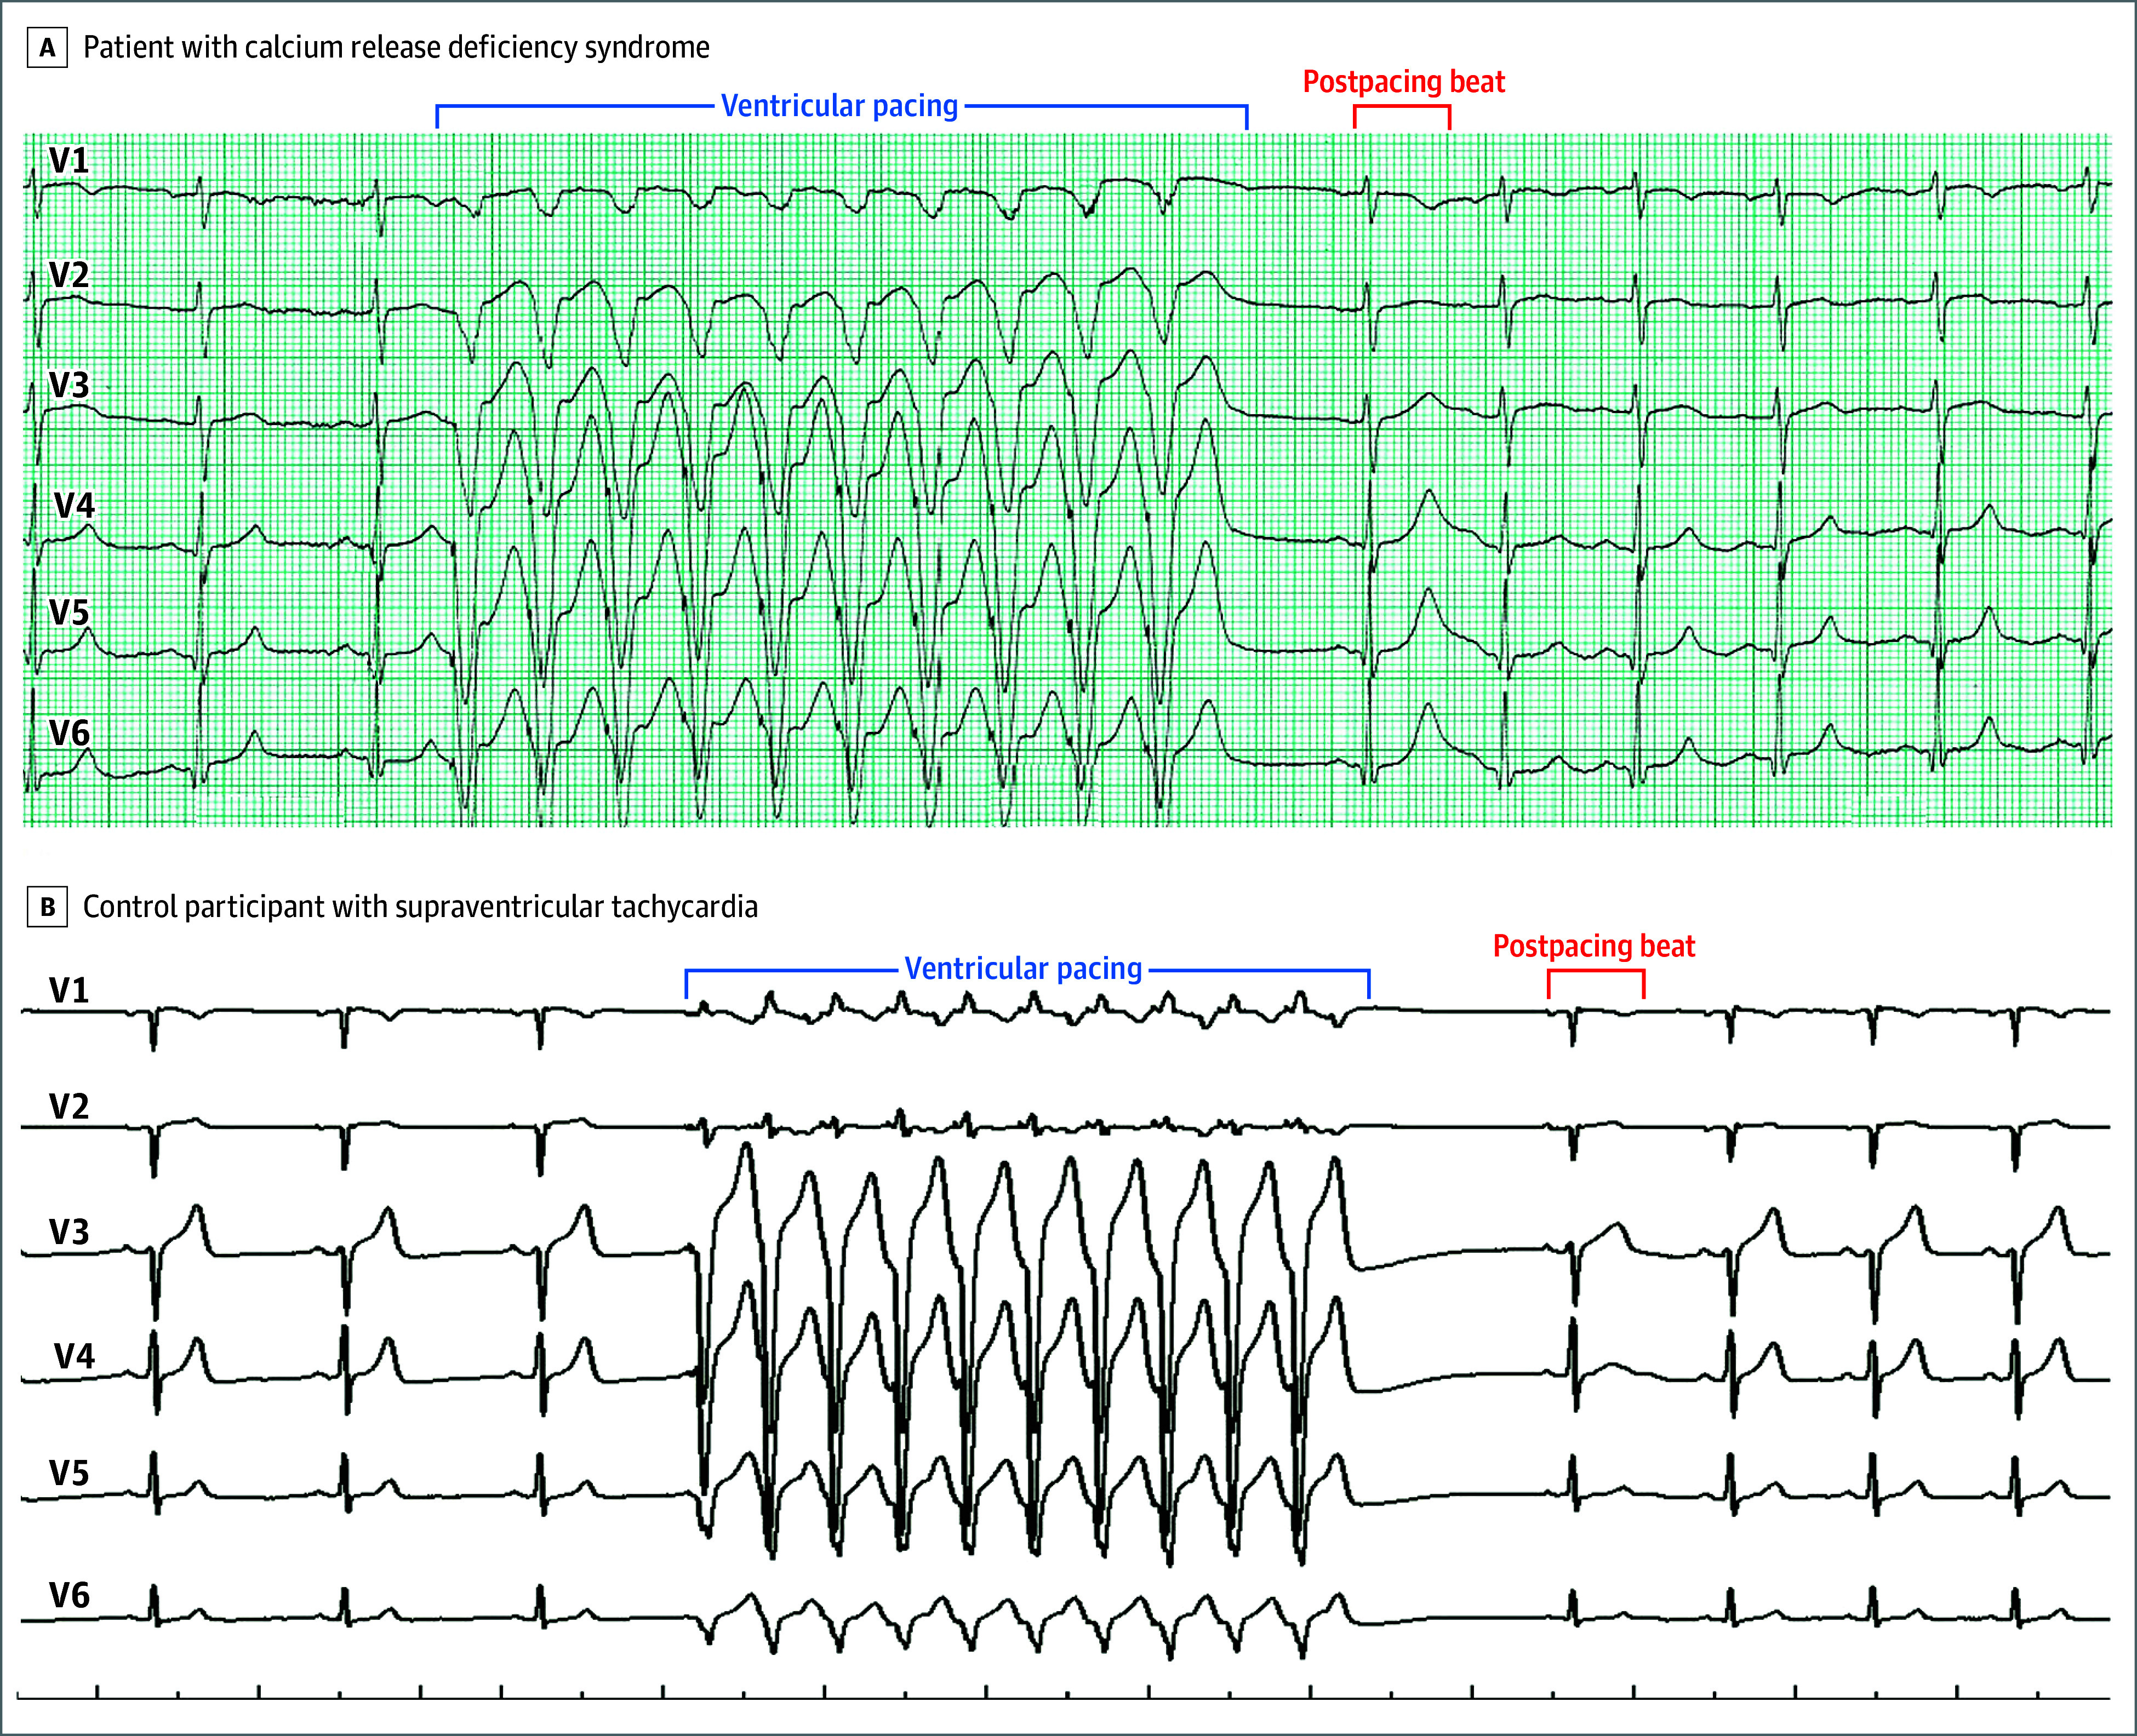
A, In a patient with a confirmed RYR2 loss-of-function variant (RYR2-p.T4196I), a tall and broad T wave was observed in the beat immediately after ventricular pacing. B, The control participant had a structurally normal heart. Precordial leads alone are shown for ease of illustration; however, the finding was also observed in the limb leads (12-lead electrocardiograms appear in eFigure 4 in Supplement 1).
The median postpause absolute QT interval in lead II was 510.5 milliseconds (IQR, 455.8-548.8 milliseconds) and the corresponding median change in QT interval was 134.5 milliseconds (IQR, 100.3-172.5 milliseconds) (eTables 3-4 in Supplement 1). The median T-wave amplitude on the first postpause beat was 0.749 mV (IQR, 0.539-1.131 mV) and the corresponding median change in T-wave amplitude was 0.388 mV (IQR, 0.311-0.700 mV) (eTables 3-4 in Supplement 1). The findings were similar from the atrial burst pacing and the ventricular burst pacing at 120 beats/min (eTables 5-7 and eFigure 5 in Supplement 1).
Examples of repolarization responses for suspected supraventricular tachycardia, unexplained cardiac arrest, and catecholaminergic polymorphic ventricular tachycardia appear in Figure 1 and eFigure 4 in Supplement 1. The summary data appear in eTables 4-7 in Supplement 1.
Differentiating CRDS Cases From Controls
The absolute median QT interval value on the first postpause beat after brief ventricular tachycardia at 150 beats/min or greater was longer for CRDS cases relative to all 3 control groups (Figure 2A and eTable 4 in Supplement 1). Although the median change in QT interval was longer in CRDS cases (P = .002), an overlap between the cases and controls was present. The shortest change in QT interval for a CRDS case was 58 milliseconds, and the longest change in QT interval was 82 milliseconds for a patient from 1 of the 3 control groups (Figure 2B and eTable 3 in Supplement 1).
Figure 2. Comparison of QT Intervals and T-Wave Amplitudes on the Sinus Beat After Brief Tachycardia and a Pause in Patients With Calcium Release Deficiency Syndrome and in Patients in 3 Control Groups.

The ventricular rate was 150 beats/min or higher. The x-axis spacing represents jitter. The horizontal lines in the boxes represent the medians; the orange diamonds, the means; the upper edge of the boxes, quartile 3; the lower edge of the boxes, quartile 1; the whiskers, the upper and lower extreme values; and the open circles, the outlier values. For B, the data presented reflect the postpause change in the QT interval from the prepacing QT interval. For D, the data presented reflect the postpause change in T-wave amplitude from the prepacing T-wave amplitude. The electrocardiographic measurements were performed using scaled electronic calipers on digitalized or scanned tracings by an electrophysiologist (Z.D.) blinded to case status. CPVT indicates catecholaminergic polymorphic ventricular tachycardia; CRDS, calcium release deficiency syndrome; SVT, supraventricular tachycardia; and UCA, unexplained cardiac arrest.
Improved discrimination appeared present for T-wave amplitude when assessed qualitatively. The median T-wave amplitude was statistically greater in CRDS cases relative to all 3 control groups (P < .001; Figure 2C and eTable 4 in Supplement 1); however, there was overlap between the individual values from the CRDS cases and controls. No overlap was observed for the individual change in T-wave amplitude values for CRDS cases relative to controls (Figure 2D). The smallest change in T-wave amplitude was 0.250 mV for a CRDS case compared with the largest change in T-wave amplitude of 0.160 mV for a control patient, indicating 100% discrimination (Figure 2D and eTable 3 in Supplement 1). The sensitivity analyses used linear regression models and adjusted for age, sex, and familial relatedness, revealing consistent findings for the comparisons of CRDS cases relative to controls in mean change in QT interval and change in T-wave amplitude (eTables 8-9 in Supplement 1).
Blinded visual adjudication of tracings for the 10 CRDS cases and 10 controls by 2 cardiologists (without performing detailed measurements) revealed a combined sensitivity of 90% and a specificity of 95% for correctly ascertaining a CRDS diagnosis.
Repolarization Responses to Brief Tachycardia in Genetic Mouse Models
Similar studies were performed in genetic mouse models known to recapitulate the human cardiac phenotypes (eFigure 7 in Supplement 1).6,31,32 Consistent with the findings in humans, pacing-mediated tachycardia and a subsequent pause provoked significantly increased mean absolute QT intervals and mean changes in QT intervals in the CRDS RYR2-D4646A+/− mouse model relative to the wild-type mouse model (Figure 3A and Figure 3B; eTable 10 in Supplement 1).
Figure 3. Repolarization Responses to Long-Burst, Long-Pause Electrical Stimulation in Mouse Models.

The electrocardiogram traces were chosen based on the mean values of the corresponding datasets. Intracardiac pacing was performed with a catheter inserted through the internal jugular vein and advanced into the right ventricle. A long burst (20 beats at an interval of 60 ms) was used to drive more extracellular calcium into cardiomyocytes. A long pause (120 ms) was used to substantially load calcium into the sarcoplasmic reticulum. The QT interval of the signal complex after the pause was determined manually by placing cursors on the beginning of the QRS complex and on the end of the T wave.
Similar findings were also observed in the mouse model expressing the human RYR2-I4855M+/− loss-of-function variant, which recapitulates the overlapping phenotype for CRDS and left ventricular noncompaction (eFigure 8 in Supplement 1).31 In contrast, significantly reduced mean absolute QT intervals and changes in QT intervals were observed in the RYR2-R4496C+/− catecholaminergic polymorphic ventricular tachycardia mouse model compared with the wild-type mouse model (Figure 3A and Figure 3C; eTable 10 in Supplement 1). Increasing the duration of the burst and the pause were both found to increase the absolute QT interval and the change in QT interval on the first postpacing beat in the RYR2-D4646A+/− CRDS mouse model (eFigures 9-11 in Supplement 1).
Action potential duration is an important determinant of QT interval.33 To gain insight into the underlying mechanism of the observed QT prolongation, we performed monophasic action potential and bipolar electrographic recordings ex vivo in intact Langendorff-perfused hearts. Pacing-mediated tachycardia and a subsequent pause markedly prolonged the monophasic action potential duration and the corresponding QT interval on the first postpacing beat in the CRDS RYR2-D4646A+/− variant hearts compared with the wild-type hearts (eFigure 12A, 12B, 12F, and 12G in Supplement 1). In contrast, this provocation significantly reduced the monophasic action potential duration and QT interval on the first postpacing beat in the catecholaminergic polymorphic ventricular tachycardia RYR2-R4496C+/− variant hearts (eFigure 12A, 12C, 12F, and 12G in Supplement 1).
The amplitude of calcium transients can influence the action potential duration via the sodium-calcium exchanger current.34 Pacing-mediated tachycardia and a subsequent pause markedly increased the peak of calcium transients on the first postpause beat in the CRDS RYR2-D4646A+/− variant hearts compared with the wild-type hearts (Figure 4A and Figure 4B; eTable 11 in Supplement 1). In contrast, this provocation significantly reduced the amplitude of calcium transients on the first postpacing beat in the catecholaminergic polymorphic ventricular tachycardia RYR2-R4496C+/− variant hearts (Figure 4A and Figure 4C; eTable 11 in Supplement 1).
Figure 4. Effect of Long-Burst, Long-Pause Electrical Stimulation on Calcium Transient Amplitude in Mouse Models.

The images were chosen based on the mean values of the corresponding datasets. The hearts were intact. The scale bar (50 µm) depicts the length of the confocal scanning line used for calcium imaging of the heart. The short black bands indicate cell boundaries. The red color indicates the fluorescence of the calcium indicator (Rhod2-AM), whose intensity reflects the level of calcium. F0 indicates baseline fluorescence intensity just before the first postpause stimulation; F1, peak fluorescence intensity during 8-Hz stimulation; and F2, peak fluorescence intensity of the first postpause stimulation. ΔF indicates a given fluorescence intensity minus the baseline fluorescence (F-F0); ΔF1, F1 minus F0; and ΔF2, F2 minus F0. A, For the RyR2 wild-type control mouse heart model, the median ΔF1/F0 = 0.85 (IQR, 0.74-0.86) and the mean ΔF2/F0 = 1.07 (SD, 0.20). B, For the RyR2-D4646A+/− calcium release deficiency syndrome mouse heart model, the mean ΔF1/F0 = 0.88 (SD, 0.04) and the mean ΔF2/F0 = 1.48 (SD, 0.14). C, For the RyR2-R4496C+/− catecholaminergic polymorphic ventricular tachycardia mouse heart model, the mean ΔF1/F0 = 0.75 (SD, 0.09) and the mean ΔF2/F0 = 0.85 (SD, 0.12).
Discussion
Driven by an urgent need and prior report of a family whose diagnosis has been revised to CRDS,7,13 we evaluated the repolarization response to brief tachycardia and a subsequent pause as a clinical diagnostic test for CRDS. Among the CRDS cases and the mouse models with or without structural heart disease, marked increases in QT interval and T-wave amplitude were consistently observed on the first postpause beat, whereas this finding was absent from the controls. Electrophysiology studies in isolated mouse hearts suggested this was secondary to a large calcium transient. Beyond providing important pathophysiological insight, this unique electrocardiographic signature appears promising as a sensitive, specific, and simple method for clinically diagnosing CRDS. If these findings are confirmed in larger studies, we envision these simple pacing maneuvers becoming standard in the diagnostic workup of unexplained cardiac arrest.4,18,19
Cardiac arrest remains common and is invariably devastating, particularly in young and previously healthy individuals. Despite the critical importance of identifying an underlying cause of cardiac arrest to enable optimal care of survivors and their family members, failure to do so remains common. In this context, establishing a clinical diagnostic test for CRDS has been considered crucial since its discovery in 2021.6 Initial reports of CRDS were particularly alarming given that patients had often undergone clinical evaluations by expert cardiology teams for syncope and had been reassured that their clinical test results were normal, only to then experience a cardiac arrest or sudden cardiac death.6,8,9 These devastating outcomes, which may have been prevented through insertion of an implantable cardioverter-defibrillator in symptomatic patients, were often further exacerbated by recurrent tragedies among family members.6,8,9
The requirement for cellular-based in vitro functional analysis to confirm a CRDS diagnosis has been extremely problematic given this type of analysis has only been available in research settings and those data are not accessible to most clinicians. A maneuver involving ventricular pacing that uses a 3-component stimulation sequence (termed long-burst, long-pause, and short-coupled ventricular extra stimulus) showed initial promise; however, this maneuver has been found to have limited sensitivity and carries the undesirable need to induce ventricular fibrillation for a positive test.6,9 The findings in this report will hopefully serve as an important step toward empowering clinicians with the ability to diagnose CRDS and help avert future catastrophic outcomes.
The median absolute QT intervals and T-wave amplitudes after brief ventricular tachycardia and a pause among the human CRDS cases were significantly greater relative to the 3 control groups; however, overlap was present (Figure 2A and Figure 2C). Recognizing the existence of a broad range of normal variation in QT intervals and T-wave amplitudes, we elected to adjust for this variation through calculation of change in QT interval and change in T-wave amplitude.
Comparison of change in QT interval revealed improved discrimination between CRDS cases and controls; however, overlap was still present (Figure 2B). Remarkably, no overlap was observed for change in T-wave amplitude (Figure 2D). Beyond being readily available and easily performed, the clinical feasibility of this provocation maneuver was further emphasized by 2 cardiologists ascertaining a CRDS diagnosis with a sensitivity of 90% and a specificity of 95% through blinded visual review of 20 tracings.
Findings in the CRDS mouse models mirrored those observed in humans, reinforcing the likelihood that these initial observations are reflective of a bona fide phenomenon. The mouse models additionally enabled evaluation of the underlying cellular mechanism and suggested that an increased calcium transient on the first postpause beat was responsible for the observed action potential duration prolongation (Figure 4). Although additional work will be necessary to fully delineate the molecular details, we hypothesize that the sarcoplasmic reticulum becomes progressively overloaded with calcium during the brief tachycardia and subsequent pause.
The resultant large calcium gradient between the sarcoplasmic reticulum and the cytosol results in a pathologically large efflux of calcium on the next beat despite the reduced activity intrinsic to these variant channels. The large release of calcium from the sarcoplasmic reticulum into the cytosol and the associated activation of the electrogenic sodium-calcium exchanger at the cell membrane are anticipated to prolong phase 2 of the action potential duration and manifest as QT interval prolongation on the surface electrocardiogram.34,35,36,37,38
Limitations
This study has limitations. First, although compelling, and the mouse models provide insight into the underlying cellular mechanism, larger-scale human studies are necessary before definitively concluding this provocation maneuver as a CRDS clinical diagnostic test. The current study involves a modest number of patients, and hence it is uncertain if the full range of change in QT interval and change in T-wave amplitude values are captured. Second, the electrocardiographic tracings used for these analyses were collected both prospectively and retrospectively, creating the potential for bias.
The full results of the ongoing DIAGNOSE CRDS (NCT06188689) study should provide clarity; however, the study will take multiple years to complete. In this context, and given the urgent clinical need for a CRDS diagnostic test, a preliminary report communicating these findings was considered important.
Conclusions
There is a unique repolarization response on an electrocardiogram after provocation with brief tachycardia and a subsequent pause in CRDS cases and mouse models, which is absent from the controls. If these findings are confirmed in larger studies, this easy to perform maneuver may serve as an effective clinical diagnostic test for CRDS and become an important part of the evaluation of cardiac arrest.
eMethods
eFigure 1. Illustrative Example of ECG Elements from an Episode of Brief Tachycardia (Mediated by Ventricular Pacing) and a Pause used for Analysis
eFigure 2. Participant Flowchart for CRDS Cases and 3 Control Groups that had Brief Ventricular Tachycardia ≥150bpm followed by a Pause that Permitted Evaluation of a Repolarization Response on the Return Sinus Beat
eFigure 3. In Vitro Functional Analyses of RYR2 variants. HEK293 cells were transfected with (Panel A) RyR2 wild type (WT) and RyR2 variants (Panel B) A1806T and (Panel C) N2386S
eFigure 4. Electrocardiographic Tracings of the Response to Brief Tachycardia and a Subsequent Pause in the Calcium Release Deficiency Syndrome (CRDS) cases (Panels A-J), Catecholaminergic Polymorphic Ventricular Tachycardia (CPVT) Controls (Panels K-M), Unexplained Cardiac Arrest (UCA) Controls (Panels N-W), and a Subgroup of Supraventricular Tachycardia Controls (Panels X-AE)
eFigure 5. Electrocardiographic Tracings of the Response to Brief Tachycardia Mediated by Atrial Pacing and a Subsequent Pause in 2 Calcium Release Deficiency Syndrome (CRDS) Cases Possessing the RYR2-p.M4109R Variant
eFigure 6. Electrocardiographic Tracings of the Response to Brief Tachycardia and a Subsequent Pause in a CRDS Case Carrying the T4196I Loss-of-Function Variant On and Off Flecainide
eFigure 7. Flowchart for Murine Studies
eFigure 8. Repolarization Responses to Long Burst + Long Pause (LBLP) Stimulation in the CRDS RyR2-I4855M+/- Loss-of-Function (LOF) Mutant Mouse Model with LVNC Cardiomyopathy
eFigure 9. Repolarization Responses to Long Burst + Long Pause (LBLP) Electrical Stimulation in a Mouse Model of CRDS with Different Numbers of the Burst Beats
eFigure 10. Repolarization Responses to Long Burst + Long Pause (LBLP) Electrical Stimulation in a Mouse Model of CRDS with Different Intervals of the Burst Beats
eFigure 11. Repolarization Responses to Long Burst + Long Pause (LBLP) Electrical Stimulation in a Mouse Model of CRDS with Different Pause Durations
eFigure 12. Effect of LBLP electrical stimulation on APD and QT interval in intact hearts of CRDS and CPVT mouse models
eTable 1. Details of the Electrocardiographic Tracings Including Cohort Groups, Recruiting Centers, Data Collected and Date of Collection
eTable 2. Clinical and Genetic Details of Calcium Release Deficiency Syndrome (CRDS) Cases Evaluated for their Repolarization Response to Brief Tachycardia and a Pause
eTable 3. Brief Tachycardia, Pause, and Cardiac Repolarization Response Details in Individual Calcium Release Deficiency Syndrome Cases whose Brief Ventricular Tachycardia was ≥150 beats per minute
eTable 4. Summary Details of Brief Tachycardia, Pause, and Cardiac Repolarization Response in Calcium Release Deficiency Syndrome Cases and Supraventricular Tachycardia, Unexplained Cardiac Arrest Survivors, and Catecholaminergic Polymorphic Ventricular Tachycardia Controls whose Brief Ventricular Tachycardia was ≥150 beats per minute
eTable 5. Summary Details of Brief Tachycardia, Pause, and Cardiac Repolarization Response in Calcium Release Deficiency Syndrome Cases and Supraventricular Tachycardia, Unexplained Cardiac Arrest Survivors, and Catecholaminergic Polymorphic Ventricular Tachycardia Controls whose Brief Ventricular Tachycardia was 120 beats per minute
eTable 6. Summary Details of Brief Tachycardia, Pause, and Cardiac Repolarization Response in Calcium Release Deficiency Syndrome Cases and Supraventricular Tachycardia, Unexplained Cardiac Arrest Survivors, and Catecholaminergic Polymorphic Ventricular Tachycardia Controls whose Brief Atrial Tachycardia was ≥150 beats per minute
eTable 7. Summary Details of Brief Tachycardia, Pause, and Cardiac Repolarization Response in Calcium Release Deficiency Syndrome Cases and Supraventricular Tachycardia, Unexplained Cardiac Arrest Survivors, and Catecholaminergic Polymorphic Ventricular Tachycardia Controls whose Brief Atrial Tachycardia was 120 beats per minute
eTable 8. Sensitivity Analyses Evaluating Unadjusted and Adjusted Associations of ΔQT (for brief ventricular tachycardia at ≥150bpm) for CRDS Case Status through Linear Regression
eTable 9. Sensitivity Analyses Evaluating Unadjusted and Adjusted Associations of ΔT-wave amplitude (for brief ventricular tachycardia at ≥150bpm) for CRDS Case Status through Linear Regression
eTable 10. Comparison of QT interval before and immediately after a long-burst and a long-pause, and QT interval change among RyR2-WT control, CRDS and CPVT mouse models
eTable 11. Comparison of Ca2+ transient amplitude in intact hearts among RyR2- WT control, CRDS and CPVT mouse models
Data sharing statement
References
- 1.Marijon E, Narayanan K, Smith K, et al. The Lancet commission to reduce the global burden of sudden cardiac death: a call for multidisciplinary action. Lancet. 2023;402(10405):883-936. doi: 10.1016/S0140-6736(23)00875-9 [DOI] [PubMed] [Google Scholar]
- 2.Stecker EC, Reinier K, Marijon E, et al. Public health burden of sudden cardiac death in the United States. Circ Arrhythm Electrophysiol. 2014;7(2):212-217. doi: 10.1161/CIRCEP.113.001034 [DOI] [PMC free article] [PubMed] [Google Scholar]
- 3.Benjamin EJ, Muntner P, Alonso A, et al. ; American Heart Association Council on Epidemiology and Prevention Statistics Committee and Stroke Statistics Subcommittee . Heart disease and stroke statistics—2019 update: a report from the American Heart Association. Circulation. 2019;139(10):e56-e528. doi: 10.1161/CIR.0000000000000659 [DOI] [PubMed] [Google Scholar]
- 4.Stiles MK, Wilde AAM, Abrams DJ, et al. 2020 APHRS/HRS expert consensus statement on the investigation of decedents with sudden unexplained death and patients with sudden cardiac arrest, and of their families. Heart Rhythm. 2021;18(1):e1-e50. doi: 10.1016/j.hrthm.2020.10.010 [DOI] [PMC free article] [PubMed] [Google Scholar]
- 5.Krahn AD, Tfelt-Hansen J, Tadros R, Steinberg C, Semsarian C, Han HC. Latent causes of sudden cardiac arrest. JACC Clin Electrophysiol. 2022;8(6):806-821. doi: 10.1016/j.jacep.2021.12.014 [DOI] [PubMed] [Google Scholar]
- 6.Sun B, Yao J, Ni M, et al. Cardiac ryanodine receptor calcium release deficiency syndrome. Sci Transl Med. 2021;13(579):eaba7287. doi: 10.1126/scitranslmed.aba7287 [DOI] [PubMed] [Google Scholar]
- 7.Li Y, Wei J, Guo W, et al. Human RyR2 (ryanodine receptor 2) loss-of-function mutations: clinical phenotypes and in vitro characterization. Circ Arrhythm Electrophysiol. 2021;14(9):e010013. doi: 10.1161/CIRCEP.121.010013 [DOI] [PubMed] [Google Scholar]
- 8.Roston TM, Wei J, Guo W, et al. Clinical and functional characterization of ryanodine receptor 2 variants implicated in calcium-release deficiency syndrome. JAMA Cardiol. 2022;7(1):84-92. doi: 10.1001/jamacardio.2021.4458 [DOI] [PMC free article] [PubMed] [Google Scholar]
- 9.Ormerod JOM, Ormondroyd E, Li Y, et al. Provocation testing and therapeutic response in a newly described channelopathy: RyR2 calcium release deficiency syndrome. Circ Genom Precis Med. 2022;15(1):e003589. doi: 10.1161/CIRCGEN.121.003589 [DOI] [PubMed] [Google Scholar]
- 10.Priori SG, Chen SRW. Inherited dysfunction of sarcoplasmic reticulum Ca2+ handling and arrhythmogenesis. Circ Res. 2011;108(7):871-883. doi: 10.1161/CIRCRESAHA.110.226845 [DOI] [PMC free article] [PubMed] [Google Scholar]
- 11.Richards S, Aziz N, Bale S, et al. ; ACMG Laboratory Quality Assurance Committee . Standards and guidelines for the interpretation of sequence variants: a joint consensus recommendation of the American College of Medical Genetics and Genomics and the Association for Molecular Pathology. Genet Med. 2015;17(5):405-424. doi: 10.1038/gim.2015.30 [DOI] [PMC free article] [PubMed] [Google Scholar]
- 12.Giudicessi JR, Lieve KVV, Rohatgi RK, et al. Assessment and validation of a phenotype-enhanced variant classification framework to promote or demote RYR2 missense variants of uncertain significance. Circ Genom Precis Med. 2019;12(5):e002510. doi: 10.1161/CIRCGEN.119.002510 [DOI] [PubMed] [Google Scholar]
- 13.Nof E, Belhassen B, Arad M, et al. Postpacing abnormal repolarization in catecholaminergic polymorphic ventricular tachycardia associated with a mutation in the cardiac ryanodine receptor gene. Heart Rhythm. 2011;8(10):1546-1552. doi: 10.1016/j.hrthm.2011.05.016 [DOI] [PMC free article] [PubMed] [Google Scholar]
- 14.Priori SG, Napolitano C, Memmi M, et al. Clinical and molecular characterization of patients with catecholaminergic polymorphic ventricular tachycardia. Circulation. 2002;106(1):69-74. doi: 10.1161/01.CIR.0000020013.73106.D8 [DOI] [PubMed] [Google Scholar]
- 15.Laitinen PJ, Brown KM, Piippo K, et al. Mutations of the cardiac ryanodine receptor (RyR2) gene in familial polymorphic ventricular tachycardia. Circulation. 2001;103(4):485-490. doi: 10.1161/01.CIR.103.4.485 [DOI] [PubMed] [Google Scholar]
- 16.Priori SG, Blomström-Lundqvist C, Mazzanti A, et al. ; ESC Scientific Document Group . 2015 ESC guidelines for the management of patients with ventricular arrhythmias and the prevention of sudden cardiac death: the task force for the management of patients with ventricular arrhythmias and the prevention of sudden cardiac death of the European Society of Cardiology (ESC): endorsed by: Association for European Paediatric and Congenital Cardiology (AEPC). Eur Heart J. 2015;36(41):2793-2867. doi: 10.1093/eurheartj/ehv316 [DOI] [PubMed] [Google Scholar]
- 17.Roston TM, Kallas D, Davies B, et al. Burst exercise testing can unmask arrhythmias in patients with incompletely penetrant catecholaminergic polymorphic ventricular tachycardia. JACC Clin Electrophysiol. 2021;7(4):437-441. doi: 10.1016/j.jacep.2021.02.013 [DOI] [PubMed] [Google Scholar]
- 18.Krahn AD, Healey JS, Chauhan V, et al. Systematic assessment of patients with unexplained cardiac arrest: Cardiac Arrest Survivors With Preserved Ejection Fraction Registry (CASPER). Circulation. 2009;120(4):278-285. doi: 10.1161/CIRCULATIONAHA.109.853143 [DOI] [PubMed] [Google Scholar]
- 19.Grondin S, Davies B, Cadrin-Tourigny J, et al. Importance of genetic testing in unexplained cardiac arrest. Eur Heart J. 2022;43(32):3071-3081. doi: 10.1093/eurheartj/ehac145 [DOI] [PMC free article] [PubMed] [Google Scholar]
- 20.Priori SG, Wilde AA, Horie M, et al. HRS/EHRA/APHRS expert consensus statement on the diagnosis and management of patients with inherited primary arrhythmia syndromes: document endorsed by HRS, EHRA, and APHRS in May 2013 and by ACCF, AHA, PACES, and AEPC in June 2013. Heart Rhythm. 2013;10(12):1932-1963. doi: 10.1016/j.hrthm.2013.05.014 [DOI] [PubMed] [Google Scholar]
- 21.Garson A Jr. How to measure the QT interval—what is normal? Am J Cardiol. 1993;72(6):14B-16B. doi: 10.1016/0002-9149(93)90034-A [DOI] [PubMed] [Google Scholar]
- 22.Goldenberg I, Moss AJ, Zareba W. QT interval: how to measure it and what is “normal”. J Cardiovasc Electrophysiol. 2006;17(3):333-336. doi: 10.1111/j.1540-8167.2006.00408.x [DOI] [PubMed] [Google Scholar]
- 23.Vink AS, Neumann B, Lieve KVV, et al. Determination and interpretation of the QT interval. Circulation. 2018;138(21):2345-2358. doi: 10.1161/CIRCULATIONAHA.118.033943 [DOI] [PubMed] [Google Scholar]
- 24.Giudicessi JR, Noseworthy PA, Ackerman MJ. The QT interval. Circulation. 2019;139(24):2711-2713. doi: 10.1161/CIRCULATIONAHA.119.039598 [DOI] [PubMed] [Google Scholar]
- 25.Davies RA, Ladouceur VB, Green MS, et al. The 2023 Canadian Cardiovascular Society clinical practice update on management of the patient with a prolonged QT interval. Can J Cardiol. 2023;39(10):1285-1301. doi: 10.1016/j.cjca.2023.06.011 [DOI] [PubMed] [Google Scholar]
- 26.Chen B, Guo A, Gao Z, et al. In situ confocal imaging in intact heart reveals stress-induced Ca(2+) release variability in a murine catecholaminergic polymorphic ventricular tachycardia model of type 2 ryanodine receptor(R4496C+/−) mutation. Circ Arrhythm Electrophysiol. 2012;5(4):841-849. doi: 10.1161/CIRCEP.111.969733 [DOI] [PMC free article] [PubMed] [Google Scholar]
- 27.Bai Y, Jones PP, Guo J, et al. Phospholamban knockout breaks arrhythmogenic Ca2+ waves and suppresses catecholaminergic polymorphic ventricular tachycardia in mice. Circ Res. 2013;113(5):517-526. doi: 10.1161/CIRCRESAHA.113.301678 [DOI] [PMC free article] [PubMed] [Google Scholar]
- 28.Zhong X, Sun B, Vallmitjana A, et al. Suppression of ryanodine receptor function prolongs Ca2+ release refractoriness and promotes cardiac alternans in intact hearts. Biochem J. 2016;473(21):3951-3964. doi: 10.1042/BCJ20160606 [DOI] [PMC free article] [PubMed] [Google Scholar]
- 29.Tse G, Hothi SS, Grace AA, Huang CLH. Ventricular arrhythmogenesis following slowed conduction in heptanol-treated, Langendorff-perfused mouse hearts. J Physiol Sci. 2012;62(2):79-92. doi: 10.1007/s12576-011-0187-2 [DOI] [PMC free article] [PubMed] [Google Scholar]
- 30.Tse G, Wong ST, Tse V, Yeo JM. Monophasic action potential recordings: which is the recording electrode? J Basic Clin Physiol Pharmacol. 2016;27(5):457-462. doi: 10.1515/jbcpp-2016-0007 [DOI] [PubMed] [Google Scholar]
- 31.Ni M, Li Y, Wei J, et al. Increased Ca2+ transient underlies RyR2-related left ventricular noncompaction. Circ Res. 2023;133(2):177-192. doi: 10.1161/CIRCRESAHA.123.322504 [DOI] [PubMed] [Google Scholar]
- 32.Zhou Q, Xiao J, Jiang D, et al. Carvedilol and its new analogs suppress arrhythmogenic store overload-induced Ca2+ release. Nat Med. 2011;17(8):1003-1009. doi: 10.1038/nm.2406 [DOI] [PMC free article] [PubMed] [Google Scholar]
- 33.Weidmann S. Effect of current flow on the membrane potential of cardiac muscle. J Physiol. 1951;115(2):227-236. doi: 10.1113/jphysiol.1951.sp004667 [DOI] [PMC free article] [PubMed] [Google Scholar]
- 34.Armoundas AA, Hobai IA, Tomaselli GF, Winslow RL, O’Rourke B. Role of sodium-calcium exchanger in modulating the action potential of ventricular myocytes from normal and failing hearts. Circ Res. 2003;93(1):46-53. doi: 10.1161/01.RES.0000080932.98903.D8 [DOI] [PMC free article] [PubMed] [Google Scholar]
- 35.Mechmann S, Pott L. Identification of Na-Ca exchange current in single cardiac myocytes. Nature. 1986;319(6054):597-599. doi: 10.1038/319597a0 [DOI] [PubMed] [Google Scholar]
- 36.Patterson E, Lazzara R, Szabo B, et al. Sodium-calcium exchange initiated by the Ca2+ transient: an arrhythmia trigger within pulmonary veins. J Am Coll Cardiol. 2006;47(6):1196-1206. doi: 10.1016/j.jacc.2005.12.023 [DOI] [PubMed] [Google Scholar]
- 37.Weber CR, Piacentino V III, Ginsburg KS, Houser SR, Bers DM. Na(+)-Ca(2+) exchange current and submembrane [Ca(2+)] during the cardiac action potential. Circ Res. 2002;90(2):182-189. doi: 10.1161/hh0202.103940 [DOI] [PubMed] [Google Scholar]
- 38.Spencer CI, Baba S, Nakamura K, et al. Calcium transients closely reflect prolonged action potentials in iPSC models of inherited cardiac arrhythmia. Stem Cell Reports. 2014;3(2):269-281. doi: 10.1016/j.stemcr.2014.06.003 [DOI] [PMC free article] [PubMed] [Google Scholar]
Associated Data
This section collects any data citations, data availability statements, or supplementary materials included in this article.
Supplementary Materials
eMethods
eFigure 1. Illustrative Example of ECG Elements from an Episode of Brief Tachycardia (Mediated by Ventricular Pacing) and a Pause used for Analysis
eFigure 2. Participant Flowchart for CRDS Cases and 3 Control Groups that had Brief Ventricular Tachycardia ≥150bpm followed by a Pause that Permitted Evaluation of a Repolarization Response on the Return Sinus Beat
eFigure 3. In Vitro Functional Analyses of RYR2 variants. HEK293 cells were transfected with (Panel A) RyR2 wild type (WT) and RyR2 variants (Panel B) A1806T and (Panel C) N2386S
eFigure 4. Electrocardiographic Tracings of the Response to Brief Tachycardia and a Subsequent Pause in the Calcium Release Deficiency Syndrome (CRDS) cases (Panels A-J), Catecholaminergic Polymorphic Ventricular Tachycardia (CPVT) Controls (Panels K-M), Unexplained Cardiac Arrest (UCA) Controls (Panels N-W), and a Subgroup of Supraventricular Tachycardia Controls (Panels X-AE)
eFigure 5. Electrocardiographic Tracings of the Response to Brief Tachycardia Mediated by Atrial Pacing and a Subsequent Pause in 2 Calcium Release Deficiency Syndrome (CRDS) Cases Possessing the RYR2-p.M4109R Variant
eFigure 6. Electrocardiographic Tracings of the Response to Brief Tachycardia and a Subsequent Pause in a CRDS Case Carrying the T4196I Loss-of-Function Variant On and Off Flecainide
eFigure 7. Flowchart for Murine Studies
eFigure 8. Repolarization Responses to Long Burst + Long Pause (LBLP) Stimulation in the CRDS RyR2-I4855M+/- Loss-of-Function (LOF) Mutant Mouse Model with LVNC Cardiomyopathy
eFigure 9. Repolarization Responses to Long Burst + Long Pause (LBLP) Electrical Stimulation in a Mouse Model of CRDS with Different Numbers of the Burst Beats
eFigure 10. Repolarization Responses to Long Burst + Long Pause (LBLP) Electrical Stimulation in a Mouse Model of CRDS with Different Intervals of the Burst Beats
eFigure 11. Repolarization Responses to Long Burst + Long Pause (LBLP) Electrical Stimulation in a Mouse Model of CRDS with Different Pause Durations
eFigure 12. Effect of LBLP electrical stimulation on APD and QT interval in intact hearts of CRDS and CPVT mouse models
eTable 1. Details of the Electrocardiographic Tracings Including Cohort Groups, Recruiting Centers, Data Collected and Date of Collection
eTable 2. Clinical and Genetic Details of Calcium Release Deficiency Syndrome (CRDS) Cases Evaluated for their Repolarization Response to Brief Tachycardia and a Pause
eTable 3. Brief Tachycardia, Pause, and Cardiac Repolarization Response Details in Individual Calcium Release Deficiency Syndrome Cases whose Brief Ventricular Tachycardia was ≥150 beats per minute
eTable 4. Summary Details of Brief Tachycardia, Pause, and Cardiac Repolarization Response in Calcium Release Deficiency Syndrome Cases and Supraventricular Tachycardia, Unexplained Cardiac Arrest Survivors, and Catecholaminergic Polymorphic Ventricular Tachycardia Controls whose Brief Ventricular Tachycardia was ≥150 beats per minute
eTable 5. Summary Details of Brief Tachycardia, Pause, and Cardiac Repolarization Response in Calcium Release Deficiency Syndrome Cases and Supraventricular Tachycardia, Unexplained Cardiac Arrest Survivors, and Catecholaminergic Polymorphic Ventricular Tachycardia Controls whose Brief Ventricular Tachycardia was 120 beats per minute
eTable 6. Summary Details of Brief Tachycardia, Pause, and Cardiac Repolarization Response in Calcium Release Deficiency Syndrome Cases and Supraventricular Tachycardia, Unexplained Cardiac Arrest Survivors, and Catecholaminergic Polymorphic Ventricular Tachycardia Controls whose Brief Atrial Tachycardia was ≥150 beats per minute
eTable 7. Summary Details of Brief Tachycardia, Pause, and Cardiac Repolarization Response in Calcium Release Deficiency Syndrome Cases and Supraventricular Tachycardia, Unexplained Cardiac Arrest Survivors, and Catecholaminergic Polymorphic Ventricular Tachycardia Controls whose Brief Atrial Tachycardia was 120 beats per minute
eTable 8. Sensitivity Analyses Evaluating Unadjusted and Adjusted Associations of ΔQT (for brief ventricular tachycardia at ≥150bpm) for CRDS Case Status through Linear Regression
eTable 9. Sensitivity Analyses Evaluating Unadjusted and Adjusted Associations of ΔT-wave amplitude (for brief ventricular tachycardia at ≥150bpm) for CRDS Case Status through Linear Regression
eTable 10. Comparison of QT interval before and immediately after a long-burst and a long-pause, and QT interval change among RyR2-WT control, CRDS and CPVT mouse models
eTable 11. Comparison of Ca2+ transient amplitude in intact hearts among RyR2- WT control, CRDS and CPVT mouse models
Data sharing statement