

Abstract
The challenge faced in optoelectronic applications of halide perovskites is their degradation. Minimizing material imperfections is critical to averting cascade degradation processes. Identifying causes of such imperfections is, however, hindered by mystified growth processes and is particularly urgent for mixed-halide perovskites because of inhomogeneity in growth and phase segregation under stresses. To unravel two-step solution growth of MAPbBrxI3–x, we monitored the evolution of Br composition and found that the construction of perovskite lattice is contributed by iodine from PbI2 substrate and Br from MABr solution with a 1:1 ratio rather than a 2:1 ratio originally thought. Kinetic analysis based on a derived three-stage model extracted activation energies of perovskite construction and anion exchange. This model is applicable to the growth of PbI2 reacting with a mixed solution of MABr and MAI. Two guidelines of fabricating single-phase MAPbBrxI3–x with predictable stoichiometry thus developed help strategizing protocols to reproducibly fabricate mixed-halide perovskite films tailored to specific optoelectronic applications.
Introduction
Metal-halide perovskite (MHP) materials—bearing a ABX3 chemical formula, where A is a univalent organic or inorganic cation, B is a bivalent metal cation, and X is a halide anion—have attracted intensive attention in the field of solar photovoltaics due to their ease of fabrication, defect tolerance,1 and versatile optoelectronic properties and recently have further extended their applications to light-emitting diodes, lasers, and photodetectors from infrared to X-ray.2,3 To date, the power conversion efficiency of perovskite solar cells (PSCs) has been rapidly improving from just 3.8% in 20094 to 26.1% for single junction cells and 33.9% for tandem solar cells with crystalline silicon recently.5,6 Despite the dramatic progress, the obstacles on the way to commercialization are intrinsic imperfections in grown materials (defect, disorder, grain boundary, etc.) and susceptibility to external stresses (moisture, heat, radiation, and electric field),7,8 resulting in short device lifetime.8−11 Moreover, the material imperfections and external stresses are entangled and effectively enforce each other. Many recent researches have been engaged to develop new material growth procedures12,13 to minimize the intrinsic material imperfections so that the cascaded degradation processes would not start at the outset, but they mostly rely on speculations and trial-and-error approaches because of limited knowledge in actual happenings during material growth.14
The current understanding of MHP growth posits that precursor distribution and unknown intermediates involved hold the greatest responsibility for producing the aforementioned material imperfections that lead to device degradation. Such effects are particularly common in the perovskite films grown with one-step solution growth method—nucleation with premixed precursors dissolved in solvent—which has been greatly adopted in the fabrication of the active layer of PSCs.12,15 As a consequence, great efforts have been made to improve the film quality by optimizing the fabrication parameters,16−20 including selecting solvent,21,22 adjusting precursor concentration,23−25 introducing additive,15,26,27 tweaking loading time,28 and varying growth temperature.24,29 Despite its simplicity, high-quality films grown with the one-step method cannot be easily achieved by optimizing these fabrication parameters independently, because of complicated intermediates and processes expectantly involved (e.g., iodoplumbate complexes [PbIn]m–,30−33 solvent-PbI2-MAI intermediate phase34−36). In contrast, Liang et al. developed a two-step method37 to grow ABX3 perovskites with AX in solution interacting with a prepared porous BX2 template. Reproducible film quality and device performance have been achieved because the nucleation of the perovskite is expected to proceed within the inorganic template that can be independently optimized.
The two-step method has been reported that it is preferred for its superior reproducibility compared to the one-step method,38−40 requiring fewer reaction variables and is particularly advantageous for growing mixed-cation and/or mixed-anion perovskites by addressing solubility differences among precursor ions. Various mechanisms have been proposed for the two-step method,41−46 including transformation via MAI ion incorporation and dissolution followed by recrystallization at different concentration ranges of MAI.25,44 Additionally, it has been suggested to begin with a topotactic nucleation, probably preceded by MAI intercalation, and followed by dissolution of PbI2 structure.45 Recently, a three-stage mechanism involving A+ and X– ions uptake into PbX2, formation of AX-PbX2, and subsequent conversion to APbX3 was introduced.46 However, verifying these models is challenging due to difficulties in detecting the intermediates of lacking identifiable signatures.34 It is commonly assumed that collaboration between halogens from the BX2 template and AX in solution forms an AX–BX2 intermediate. Yet, questions arise regarding the coexistence of A+ and X– ions with different diffusivities and intermediate formation with a lower X– supply.
A recent simulation study47 proposed that I– from MAI undertakes a nucleophilic attack to the PbI2 structure to form iodoplumbates, (PbI2)2-n, where n = 3, 4, ..., as the primary stage of the two-step growth process. This raised the question of how such intermediates are produced if the supply of I– from MAI is restrained. To decipher the respective roles of halides from MAI and the PbI2 framework in the two-step growth process, we exploited different halogens in AX and BX2. Using X-ray diffraction (XRD) and UV–vis spectrophotometry, we analyzed the bromine composition in grown MAPbBrxI3–x perovskite and the residual PbI2 quantity. In addition, kinetic analysis was conducted at different reaction temperatures and a three-stage model was proposed for kinetic analysis. The study extended the model to understand the growth with mixed solution of MABr and MAI (abbreviated as MABr:MAI) at varying fractions of Br–, fBrs. This research yielded high-quality MAPbBrxI3–x perovskites (x = 0.1 to 2.9) and established two fabrication guidelines of such mixed-halide perovskites.
In this report, we first describe the experimental methods adopted, including precursor preparation, reaction design, and characterizations of X-ray diffraction and spectrophotometry. A three-stage model is presented to explain the evolution of the extracted Br composition of MAPbBrxI3–x perovskite films grown with the reaction scenario of PbI2 reacting with MABr solution. The kinetic analysis results of this model at different reaction temperatures are used to extract the activation energies of perovskite formation and halide exchange. We then describe the application of this model to the reaction scenario of PbI2 reacting with solution of MABr:MAI. The fabrication guidelines of mixed-halide perovskites resulting from the two reaction scenarios are provided. The issues of this study and their possible circumventing approaches are discussed. A summary of the study and implications thereof conclude this report in the end.
Experimental Methods
Preparation of Precursors
The details of preparing the precursors (PbI2 films and solutions of MABr and MABr:MAI) are given Section SI-1. Briefly, the PbI2 precursor solution (1.2 M) was prepared by dissolving PbI2 in a mixture of dimethylformamide and dimethyl sulfoxide (10:0.9 in volume ratio) and spin-coated over a cleaned fused-silica substrate at room temperature, followed by thermal annealing at 70 °C for 10 min. MABr was dissolved in isopropanol (IPA) to yield an 18 mM solution, while the MABr:MAI solutions with a series of bromide fractions were prepared similarly with a combined concentration of 18 mM. All the precursors were prepared and stored in a nitrogen-purged glovebox before perovskite growth.
Growth of Perovskite Films
To accurately capture the evolution of the two-step solution growth of perovskites, we designed a specialized growth chamber capable of precise controlling the reaction temperature TR and duration tR, as shown in Figure S1. Detailed fabrication instructions are provided in Section SI-1. In the growth scenario of PbI2 reacting with MABr solution, the solution was preheated in the chamber to a preset TR. The PbI2 substrate was immersed into the solution to initiate the reaction and then lifted above the solution surface to stop the reaction, yielding a grown sample with a reaction time, tR. The perovskite growth repeated at least two times at each TR which was varied from 30 to 60 °C. The same procedure was followed in the growth scenario of PbI2 reacting with MABr:MAI solution, except the growth was proceeded at TR = 30 °C only. After the reaction was stopped, the grown sample was immediately rinsed in pure IPA shortly and then spun with a spin-coater to remove residual MABr or MABr:MAI solution. No postannealing was performed to preserve the sample’s original state. All the samples were then stored at room temperature in the glovebox before characterization.
Characterizations and Analyses
The PbI2-coated substrate and the grown perovskite sample were examined by XRD and UV–vis spectrophotometry. XRD was performed with an X-ray diffractometer (D8 Endeavor, Bruker) with Cu Kα radiation of λXRD = 1.54056 Å, a rotational step size of 0.01°, and a signal integration time of 0.1 s. The angular peak positions 2θ of XRD were calibrated for the zero shift using the relationship between peaks with Bragg’s law and calculated the lattice constant a (detailed in Section SI-2). UV–vis spectrophotometry was carried out with a commercial spectrophotometer (V-670, JASCO) in conjunction with a 150 mm integrating sphere (ILN-725, JASCO) to determine the pure absorbance of the sample that may contain a rough surface. The bandgap energy (Eg) of the sample was obtained from the onset of the sample absorbance with respective to photon energy E, A(E), with a procedure described Section SI-3 because the commonly adopted Tauc-plot method involves several limitations that are associated with bandgap nature (direct vs indirect), sample crystallinity, and homogeneity and thus often produces irreproducible results.48 Although Eg was consistently extracted from the samples prepared in the same condition, the empirical onset method may cause some deviation in the extracted Eg value.
The detailed characterization results of the PbI2-coated fused-silica substrate were described in Section SI-4. In sum, its steep absorption edge near 515 nm corresponds to a bandgap energy of 2.4 eV.49,50 The XRD profile exhibits an XRD peak at 2θ ∼ 12.67° corresponding to the (001) lattice planes of PbI2. The film thickness measured with a stylus profiler (Dektak 6M, Bruker) is 200 ± 20 nm. The extracted absorption coefficient at 500 nm is around 1.1 × 105 cm–1, which is slightly lower than that obtained from single-crystal PbI2 (1.38 × 105 cm–1).49,50 The difference reflects the mesoporous structure of the grown PbI2 film41,51 that is supported by the characterization results of scanning electron microscopy and atomic force microscopy, shown in Figure S3c and d.
The bromide composition, x, of each grown MAPbBrxI3–x sample was extracted independently from its XRD profile and absorption spectrum with the use of the relationships of
| 1 |
and
| 2 |
respectively.52 The x values extracted from XRD and UV–vis spectrophotometry were compared in Figure S4a and differ by <0.2. Since the former method reveals only the crystalline portion of the sample while the data obtained with the latter one may include the amorphous portion, the comparison can verify the evolution of the halide composition during the growth process with the two independent characterization methods but also can monitor the emergence of any amorphous constituent. Finally, the extracted x values from three independently prepared samples showed a deviation of ∼0.12, exemplified in Figure S4b, indicating the effective control of the sample preparation procedure.
Results and Discussion
The reaction progression in the reaction scenario of PbI2 reacting with MABr solution (abbreviated as PbI2–MABr) are prototyped by the XRD profiles and UV–vis absorption spectra of the samples grown at 30 °C at different reaction times, tRs. A three-stage model is proposed to interpret the experimental findings at this reaction temperature, TR. Its generalization is then examined with the experimental results obtained at other TRs. The rate constants of depletion of PbI2, growth of perovskite and halide exchange thus determined at all the TRs are used to extract their corresponding activation energies. The three-stage model is then generalized to the reaction scenario of PbI2 reacting with the MABr:MAI solution (abbreviated as PbI2–MABr:MAI). The fabrication guidelines of MAPbBrxI3–x, for x varying from 0.1 to 2.9, developed based on the films grown with the two reaction scenarios, are presented. Lastly, the issues involved in this study are discussed.
Scenario I: PbI2–MABr
At a reaction
temperature (TR), the sample grown with
each reaction time (tR) was characterized
with X-ray diffraction (XRD) to obtain its XRD profile, ID (2θ), and with UV–vis spectrophotometry
to obtain its absorption spectrum, A(λ) or A(E), where θ, λ and E are X-ray diffraction angle, photon wavelength, and photon
energy, respectively. Figure 1 shows archetypal A(λ)s and ID (2θ)s of the samples grown at different tRs with TR = 30
°C. At tR = 5 s, an absorption feature
emerges at ∼600 nm. This long-wavelength feature is red-shifted
with tR and reaches a longest wavelength
of ∼640 nm (∼1.95 eV) at tR = 180 s. It is subsequently blue-shifted with tR and finally reaches ∼560 nm at tR = 1800 s. In contrast, the absorption feature of PbI2 at ∼520 nm decreases in its strength with tR and diminishes at tR ≥ 180 s. The disappearance of the 520 nm feature is coincident
with the appearance of the longest-wavelength absorption feature at
640 nm. As to the XRD profiles, at tR =
5 s, two XRD peaks emerge at 2θ = 14.69° and 29.61°,
corresponding to the (100) and (200) diffraction peaks of the pseudocubic
perovskite phase, respectively,53 while
the (001) peak of PbI2 at 2θ = 12.67° is still
visible. The 2θ of the perovskite (100) peak decreases with tR, reaches its minimal value of ∼14.6°
at tR = 180 s; it then increases with tR and finally reaches 2θ ≈ 15°
at tR = 1800 s. In comparison, the (001)
peak of PbI2 is decreased in its strength with tR and diminishes at tR ≥ 180 s, behaving similarly as the absorption feature of
PbI2 described above. According to the results of the XRD
and UV–vis spectrophotometry above, two inferences can be made
readily. First, the symmetric shape of the XRD peaks and their patterns
indicate that the grown films are uniform pseudocubic-phase MAPbBrx I3–x crystals
that concurrently exhibit well-behaved absorption edge near bandgap
(Eg) in their respective absorption spectra.
Second, according to the absorption edges of MAPbBr3 and
MAPbI3 at 530 and 780 nm, respectively, the initially grown
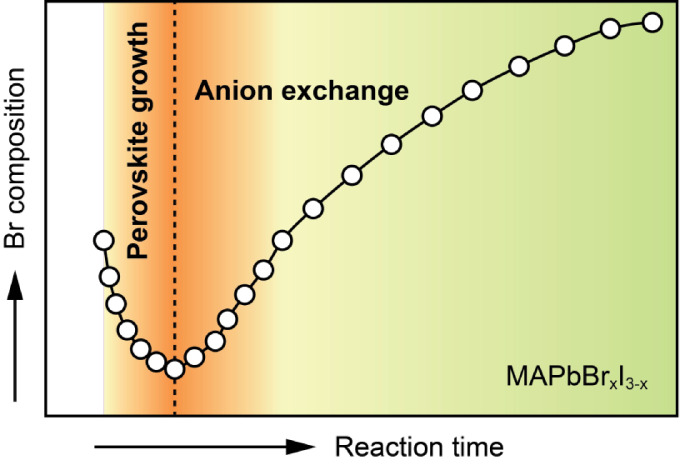
perovskite at tR = 5 s is likely MAPbBrxI3–x with x > 1.5 and the Br composition then decreases with tR, attains a minimal value at tR = 180 s, and reaches a final high value (MAPbBr3 alike) at tR = 1800 s. According
to the diffraction theory, the lattice constant a of each grown pseudocubic MAPbBrxI3–x sample can be determined. Among
the reported relations between a and xD of MAPbBrxI3–x,52,54−57 the relation obtained by the
Mosca’s group,52eq 1, was used to determine the dependence
of xD on tR, as shown in Figure 1b, where xD is the bromide composition
determined with XRD. Of note, xD starts
at just above 2, is then decreased quickly to 1.7 at tR = 180 s, and finally is increased gradually toward 2.6
at tR = 1800 s. The resultant xD (tR) curve bears
four characteristic parameters: (1) the decay time constant, τ1, (2) the minimal x, xD–min, reached at  , (3) the rise time constant, τ2, and (4) the asymptotic
bromide composition at tR → ∞, xD–∞. The Br compositions
of the grown MAPbBrx I3–x samples were also obtained with their relation with
bandgaps, eq 2.52 The agreement is within 0.2, as exemplified
in Figure S4a, indicating that the amorphous
perovskite was negligible in the grown film. The behaviors shown in Figure 1 were confirmed by
three independently repeated experiments, shown in Figure S4b. The xDs at different tRs were similarly extracted at other TRs. The results (Figure S5) show that both τ1 and τ2 decreases with TR, as expected, while xD–min decreases with TR and attains ∼1.5 at ≥40 °C. A reaction
model could then be derived to explain these observations.
, (3) the rise time constant, τ2, and (4) the asymptotic
bromide composition at tR → ∞, xD–∞. The Br compositions
of the grown MAPbBrx I3–x samples were also obtained with their relation with
bandgaps, eq 2.52 The agreement is within 0.2, as exemplified
in Figure S4a, indicating that the amorphous
perovskite was negligible in the grown film. The behaviors shown in Figure 1 were confirmed by
three independently repeated experiments, shown in Figure S4b. The xDs at different tRs were similarly extracted at other TRs. The results (Figure S5) show that both τ1 and τ2 decreases with TR, as expected, while xD–min decreases with TR and attains ∼1.5 at ≥40 °C. A reaction
model could then be derived to explain these observations.
Figure 1.

(a) UV–vis absorption spectra and X-ray diffraction profiles of grown samples at different reaction times (tRs) at reaction temperature TR = 30 °C; (b) Br composition in MAPbBrxI3–x extracted from XRD profiles, xD, as a function of tR. The solid line in (b) is a guide to the eyes.
Three-Stage Model
Based on the progression of the Br
composition of the grown MAPbBrxI3–x perovskite films presented above,
the growth can be separated into three stages, illustrated in Figure 2, with the watershed
reaction time,  , when a minimum xD value, xD–min, is reached.
In Stage 1, a MAPbBrxI3–x (x > 2.0) capping layer is promptly
formed on the top surface of the PbI2 film within a few
seconds. In Stage 2, as
, when a minimum xD value, xD–min, is reached.
In Stage 1, a MAPbBrxI3–x (x > 2.0) capping layer is promptly
formed on the top surface of the PbI2 film within a few
seconds. In Stage 2, as  , xD decreases,
forming MAPbBrxI3–x with x = xD–min at
, xD decreases,
forming MAPbBrxI3–x with x = xD–min at  . In Stage 3, as
  , xD increases,
forming high-x MAPbBrxI3–x (x > xD–min), as exemplified in Figure 1b. In the initial stage, MA+ and Br– expectantly interact with the top
surface of the PbI2 film to destruct the PbI2 lattice structure and form a MAPbBrxI3–x capping layer. Although there
is no report on the dissolution of PbI2 in IPA, it is known
that PbI2 tends to be dissolved in MAI solution44 and form iodoplumbates (e.g., PbI3– and PbI4–2)52 due to the strong donor ability of I–.15,58 The recent simulation study of the formation
of MAPbI3 by Kaiser et al.,47 without considering the solvent, showed that the initial nucleophilic
attack by I– causes structural disorder in the PbI2 layer, while the second nucleophilic I– attack breaks two Pb–I bonds simultaneously to form [PbIn]2–n complexes
for facile nucleation of perovskite with MA+. If their
study is conceivable, the initial appearance of MAPbBrxI3–x with x > 2 in our study suggests that the stronger affinity
of
nucleophilic Br– from MABr opens the top of PbI2 structure31,59,60 and forms high-x haloplumbates [PbBrxI3–x]− after breaking Pb–I bond and releasing I– in solution. The process can be described as eq 3:
, xD increases,
forming high-x MAPbBrxI3–x (x > xD–min), as exemplified in Figure 1b. In the initial stage, MA+ and Br– expectantly interact with the top
surface of the PbI2 film to destruct the PbI2 lattice structure and form a MAPbBrxI3–x capping layer. Although there
is no report on the dissolution of PbI2 in IPA, it is known
that PbI2 tends to be dissolved in MAI solution44 and form iodoplumbates (e.g., PbI3– and PbI4–2)52 due to the strong donor ability of I–.15,58 The recent simulation study of the formation
of MAPbI3 by Kaiser et al.,47 without considering the solvent, showed that the initial nucleophilic
attack by I– causes structural disorder in the PbI2 layer, while the second nucleophilic I– attack breaks two Pb–I bonds simultaneously to form [PbIn]2–n complexes
for facile nucleation of perovskite with MA+. If their
study is conceivable, the initial appearance of MAPbBrxI3–x with x > 2 in our study suggests that the stronger affinity
of
nucleophilic Br– from MABr opens the top of PbI2 structure31,59,60 and forms high-x haloplumbates [PbBrxI3–x]− after breaking Pb–I bond and releasing I– in solution. The process can be described as eq 3:
| 3 |
where m ≥ 3 and n = 1, 2, .... The formed univalent haloplumbate [PbBrxI3–x]− hypothetically reacts with MA+ to form MAPbBrxI3–x on the surface within a few seconds:
| 4 |
Figure 2.

Schematic diagram of three-stage model: (1) Stage 1—a capping layer of MAPbBrxI3–x with a high Br composition (x > 1.5) is formed; (2) Stage 2—PbI2 layer is converted to MAPbBrxI3–x with a medium Br composition until reaching x ∼ 1.5; (3) Stage 3—I-to-Br exchange produces MAPbBrxI3–x with a higher Br composition (1.5 < x < 3).
In Stage 2, the x value drops
to xD-min ∼ 1.5, i.e., the
composition of Br
is close to that of I in MAPbBrxI3–x at  , indicating that more I– ions released from the
destruction of surface PbI2 lattice
are incorporated into the conversion reaction: The attack of the PbI2 lattice is more by I– and less by penetrated
Br– to form [PbBrxI3–x]−, followed by
the formation of MAPbBrxI3–x with a smaller x. Since the initially
grown Br-rich MAPbBrxI3–x capping layer bears less porosity caused by the
volume expansion of the perovskite lattice with respect to the PbI2 lattice61,62 and MA+ is more mobile
than Br– due to their mass and charge difference,
the conversion reaction, eq 4, occurring at the interface between the Br-rich MAPbBrxI3–x capping
layer and the PbI2 lattice underneath would proceed with
the deeply penetrated MA+ and the haloplumbate [PbBrxI3–x]− formed from the destruction of PbI2 lattice, eq 3, gradually less with penetrated
Br– but increasingly more with the I– released from the previously destructed PbI2 lattice.
Besides the fact that the dense capping layer slows the diffusion
of Br– to the perovskite/PbI2 interface
and the diffusion of I– away from the interface
into the solution, the accumulated I– ions on the
perovskite/PbI2 interface not only mitigate the penetration
of Br– ions but also attract MA+ ions
along the narrowed canals in the expected compact perovskite capping
layer. As a consequence, the I composition of the grown perovskite
in Stage 2 increases with tR, as exemplified
in Figure 1b. As the
PbI2 lattice diminishes, the whole film is coincidently
converted to a perovskite film while the Br– ions,
which penetrate into the grown perovskite layer through the channel
between perovskite grains, would undertake an anion exchange reaction
with the iodine in the grown perovskite grains, as the start of Stage
3, resulting in a high-x MAPbBrxI3–x film. Ultimately,
the Br composition of the grown perovskite approaches 1.5 when the
PbI2 film is depleted, indicating that approximately 75%
of iodine atoms from the PbI2 film participate in the construction
of the perovskite lattice, while the rest of the iodine atoms become
ions diffusing into the solution if they are not trapped at the boundary
between perovskite grains. The halide ion exchange was investigated
in several previous studies.63,64 In a Br/I exchange
reaction of MAPbX3 (X = Br and I), Pellet et al. showed
that the exchange process is limited by the halide diffusion within
the perovskite lattice rather than ion transport in the solution or
by the interfacial halide exchange at the surface.63 Notably, Ghasemi et al. recently examined the lateral diffusion
of I– along the surface of MAPbBr3 with
secondary ion mass spectrometry and found that the diffusion along
grain boundary is much faster than that in grain volume.64
, indicating that more I– ions released from the
destruction of surface PbI2 lattice
are incorporated into the conversion reaction: The attack of the PbI2 lattice is more by I– and less by penetrated
Br– to form [PbBrxI3–x]−, followed by
the formation of MAPbBrxI3–x with a smaller x. Since the initially
grown Br-rich MAPbBrxI3–x capping layer bears less porosity caused by the
volume expansion of the perovskite lattice with respect to the PbI2 lattice61,62 and MA+ is more mobile
than Br– due to their mass and charge difference,
the conversion reaction, eq 4, occurring at the interface between the Br-rich MAPbBrxI3–x capping
layer and the PbI2 lattice underneath would proceed with
the deeply penetrated MA+ and the haloplumbate [PbBrxI3–x]− formed from the destruction of PbI2 lattice, eq 3, gradually less with penetrated
Br– but increasingly more with the I– released from the previously destructed PbI2 lattice.
Besides the fact that the dense capping layer slows the diffusion
of Br– to the perovskite/PbI2 interface
and the diffusion of I– away from the interface
into the solution, the accumulated I– ions on the
perovskite/PbI2 interface not only mitigate the penetration
of Br– ions but also attract MA+ ions
along the narrowed canals in the expected compact perovskite capping
layer. As a consequence, the I composition of the grown perovskite
in Stage 2 increases with tR, as exemplified
in Figure 1b. As the
PbI2 lattice diminishes, the whole film is coincidently
converted to a perovskite film while the Br– ions,
which penetrate into the grown perovskite layer through the channel
between perovskite grains, would undertake an anion exchange reaction
with the iodine in the grown perovskite grains, as the start of Stage
3, resulting in a high-x MAPbBrxI3–x film. Ultimately,
the Br composition of the grown perovskite approaches 1.5 when the
PbI2 film is depleted, indicating that approximately 75%
of iodine atoms from the PbI2 film participate in the construction
of the perovskite lattice, while the rest of the iodine atoms become
ions diffusing into the solution if they are not trapped at the boundary
between perovskite grains. The halide ion exchange was investigated
in several previous studies.63,64 In a Br/I exchange
reaction of MAPbX3 (X = Br and I), Pellet et al. showed
that the exchange process is limited by the halide diffusion within
the perovskite lattice rather than ion transport in the solution or
by the interfacial halide exchange at the surface.63 Notably, Ghasemi et al. recently examined the lateral diffusion
of I– along the surface of MAPbBr3 with
secondary ion mass spectrometry and found that the diffusion along
grain boundary is much faster than that in grain volume.64
The three-stage model derived from the PbI2–MABr growth is different from the model proposed by Fu et al.25 who also monitored the two-step growth of MAPbBrxI3–x with PbI2 reacting with MABr in IPA at room temperature with XRD and observed MAPbBrxI3–x at tR = 1 min and MAPbBr3 at tR = 4 h. They posited that this thin capping layer of MAPbBrxI3–x with a high x at the initial stage would block permeation of MABr. However, they failed to observe the construction of MAPbBrxI3–x with quickly decreasing x and the subsequent growth of MAPbBrxI3–x with slowly increasing via the I-to-Br exchange reaction. Accordingly, they conjectured that the dissolution of the PbI2 layer and the crystallization of MAPbBr3—so-called the dissolution–crystallization model. That is, they missed the critical second and third stages in our model. Chauhan et al.42 applied the same dissolution–crystallization model to explain their in situ optical absorption results. Moreover, no detailed mechanism was revealed, and no kinetic analysis was performed in these two studies.
Kinetic Analysis
Based on the three-stage model, the
kinetics of the perovskite formation in Stage 2 and that of the I-to-Br
exchange reaction in Stage 3 can be obtained with the evolution of
the XRD profile at different TRs. As an
example, Figure 3a
shows the dependences of the extracted peak area of the (001) XRD
peak of PbI2,  , and that of the (100) peak of
MAPbBrxI3–x, IPVK, on tR at TR = 30 °C. Note that
, and that of the (100) peak of
MAPbBrxI3–x, IPVK, on tR at TR = 30 °C. Note that  decays while IPVK coincidently rises exponentially with tR. The fitting of these two data with single exponential
function,
i.e.,
decays while IPVK coincidently rises exponentially with tR. The fitting of these two data with single exponential
function,
i.e.,
| 5a |
and
| 5b |
where  (0) corresponds to the initial
  and IPVK (∞) is the final IPVK,
yielded two almost identical rate constants:
and IPVK (∞) is the final IPVK,
yielded two almost identical rate constants:  = 0.013 s–1 and kPVK = 0.012 s–1, indicating
that both the depletion of PbI2 and the growth of perovskite
behave as a direct pseudo-first-order reaction, thus amounting to
the first kinetic result of this study. Therefore, no intermediate
species during the reaction is needed to interpret the analysis result.
All Pb atoms from the PbI2 template are consumed in the
perovskite growth, and the supply of MA+ is opportune for
the growth. This result is in contrast to those obtained by previous
studies41,46 that claimed the existence of certain intermediate
complex or disordered structure. We notice that our rate constant
at 30 °C is significantly slower than that obtained from the
two-step MAPbI3 growth study—MAI in IPA (38 mM)
reacts with spin-coated PbI2 coated on mesoporous Al2O3—at 25 °C by Gratzel’s group
(0.058 s–1).41 Two possible
causes lead to their high growth rate. First, their higher MAI concentration,
compared with our MABr concentration of 18 mM, compensates for the
lower reactivity of I– compared with Br–. Second, their PbI2 layer deposited on mesoporous Al2O3 may bear different characteristics (crystallinity,
porosity, etc.) from ours. Unfortunately, because of the high growth
rate of their studies and only three temperatures employed, no activation
energy, EA, was extracted from their qualitative
investigation. Our systematic temperature-dependent study (see Figure S6) on the other hand allows for extracting EA. Figure 3b shows the obtained rate constant in logarithmic scale,
= 0.013 s–1 and kPVK = 0.012 s–1, indicating
that both the depletion of PbI2 and the growth of perovskite
behave as a direct pseudo-first-order reaction, thus amounting to
the first kinetic result of this study. Therefore, no intermediate
species during the reaction is needed to interpret the analysis result.
All Pb atoms from the PbI2 template are consumed in the
perovskite growth, and the supply of MA+ is opportune for
the growth. This result is in contrast to those obtained by previous
studies41,46 that claimed the existence of certain intermediate
complex or disordered structure. We notice that our rate constant
at 30 °C is significantly slower than that obtained from the
two-step MAPbI3 growth study—MAI in IPA (38 mM)
reacts with spin-coated PbI2 coated on mesoporous Al2O3—at 25 °C by Gratzel’s group
(0.058 s–1).41 Two possible
causes lead to their high growth rate. First, their higher MAI concentration,
compared with our MABr concentration of 18 mM, compensates for the
lower reactivity of I– compared with Br–. Second, their PbI2 layer deposited on mesoporous Al2O3 may bear different characteristics (crystallinity,
porosity, etc.) from ours. Unfortunately, because of the high growth
rate of their studies and only three temperatures employed, no activation
energy, EA, was extracted from their qualitative
investigation. Our systematic temperature-dependent study (see Figure S6) on the other hand allows for extracting EA. Figure 3b shows the obtained rate constant in logarithmic scale,  , plotted
against 1000/TR.
, plotted
against 1000/TR.  shows
linear relation with 1000/TR. That is,
the activation energy can be obtained
with the Arrhenius equation:
shows
linear relation with 1000/TR. That is,
the activation energy can be obtained
with the Arrhenius equation:
| 6 |
Figure 3.

(a)
Extracted areas of (001) XRD peak of residual PbI2,  s (open squares), and those of
(100) XRD
peak of perovskite, IPVKs (filled circles),
obtained with a reaction temperature, TR, at 30 °C plotted against reaction time, tR. The curves are the fitted curves with use of eqs 5a, 5b, respectively; (b) extracted rate constants of the depletion of
PbI2,
s (open squares), and those of
(100) XRD
peak of perovskite, IPVKs (filled circles),
obtained with a reaction temperature, TR, at 30 °C plotted against reaction time, tR. The curves are the fitted curves with use of eqs 5a, 5b, respectively; (b) extracted rate constants of the depletion of
PbI2,  s, from the XRD plotted against 1000/TR and fitted with eq 6. The line in (b) is a fitted curve to eq 6.
The fitting of the rate constant  vs
1/TR resulted
in an activation energy of 0.72 eV. This value is close to the decomposition
energies of MAPbBr3 and MAPbI3 (0.62 and 0.7
eV, respectively)65 due to a low heat of
formation from PbI2 with MAI to MAPbI3 has been
reported (–0.1∼0.4 eV).66,67 In contrast,
this activation energy is significantly smaller than the one extracted
from the reaction of PbI2 film with MAI gas from 100 to
140 °C (EA = 1.89 eV).67 The difference may come from the following three
facts. First, before the reaction, MAI gas acquires thermal energy
for its impingement on the PbI2 film to activate dissociation,
while MABr dissociates readily into MA+ and Br– in solution before the reaction.68 As
a result, the gas-phase two-step method requires the substrate heated
above 70 °C.69−71 Second, Br– is more reactive than
I–. Third, the solvent can expedite the penetration
of the MA+ and Br– through porous morphology
of PbI2 and screen Coulomb repulsion between halides to
facilitate the formation of haloplumbates, eq 3.
vs
1/TR resulted
in an activation energy of 0.72 eV. This value is close to the decomposition
energies of MAPbBr3 and MAPbI3 (0.62 and 0.7
eV, respectively)65 due to a low heat of
formation from PbI2 with MAI to MAPbI3 has been
reported (–0.1∼0.4 eV).66,67 In contrast,
this activation energy is significantly smaller than the one extracted
from the reaction of PbI2 film with MAI gas from 100 to
140 °C (EA = 1.89 eV).67 The difference may come from the following three
facts. First, before the reaction, MAI gas acquires thermal energy
for its impingement on the PbI2 film to activate dissociation,
while MABr dissociates readily into MA+ and Br– in solution before the reaction.68 As
a result, the gas-phase two-step method requires the substrate heated
above 70 °C.69−71 Second, Br– is more reactive than
I–. Third, the solvent can expedite the penetration
of the MA+ and Br– through porous morphology
of PbI2 and screen Coulomb repulsion between halides to
facilitate the formation of haloplumbates, eq 3.
The anion exchange between Br and I governs the reaction of Stage 3 in which perovskite formation is completed. Its kinetic analysis is best performed with Br composition. However, since the anion-exchange reaction starts during the formation of MAPbBrxI3–x in Stage 2, it is imperative to retrieve the pure anion-exchange contribution from the evolution of the Br composition x in the grown MAPbBrxI3–x in both Stages 2 and 3 for kinetic analysis. After zooming in on the happenings in Stages 1 and 2 of our three-stage model, once the initial high-x MAPbBrxI3–x top layer is formed in Stage 1, the halide ions used for the subsequent formation of perovskite are mostly I– because the Br– ions in solution are essentially blocked from reaching the perovskite/PbI2 interface. That is, the progression of the Br composition x in the grown MAPbBrxI3–x film can be considered as a combination of the initial fast decreasing x in Stage 2 and the subsequent slowly increasing x in Stages 2 and 3. As a consequence, the evolution of the Br composition, exemplified in Figure 1b, is analyzed empirically with an exponential decay and an exponential rise:
| 7 |
where kII reflects the decay of xD due to the formation of perovskite mainly with I– stemming from the dissolution of PbI2 in Stage 2, kIII is the apparent rate constant of I-to-Br exchange reaction in the completely grown perovskite, and n is an empirical number. Figure 4a exemplifies the fitting of eq 7 with the experimental data of Figure 1b. Note that the fitted curve agrees with the experimental data very well, indicating that eq 7 grasps the main kinetic characteristics of anion exchange during the formation of MAPbBrxI3–x in Scenario I reaction. The fitting of the data with other TRs also proceeded well (Figure S5 and Table S2). The obtained n values in eq 7 are around 0.4, indicating that the anion exchange reaction is associated with 1D diffusion process.46 Last but not least, the extracted activation energy of the anion exchange reaction obtained by fitting the rate constants in Figure 4b with an Arrhenius-typed equation is 0.37 eV. This value is close to the activation energy of the anion exchange between two attached layers of MAPbI3 and MAPbBr3 (0.52 eV),72 those of Br ion diffusion in MAPbI3 through volume and grain boundary (0.61 and 0.57 eV),64 and that of Br and I remixing in dark between light-induced aggregated Br- and I-rich domains (0.55 eV).73
Figure 4.

(a) Evolution of bromide composition xD of grown perovskite at reaction temperature TR = 30 °C fitted with eq 7; (b) extracted rate constant of anion exchange, kIII, plotted against 1000/TR and fitted with the Arrhenius equation.
Scenario II: PbI2–MABr:MAI
Given
the success of the three-stage model to interpret the experimental
findings of the PbI2–MABr reaction scenario, how
can it be extended to the other scenario of PbI2 reacting
with a mixed solution of MABr and MAI (MABr:MAI)? The application
of the three-stage model to this scenario can help to verify its effectiveness. Figure 5 shows the progression
of optical absorption spectrum, A(λ), and XRD
profile, ID(2θ), of the sample grown
with a MABr:MAI solution containing 50% of Br– (fBr = 0.5) at TR =
30 °C. At tR = 60 s, an absorption
feature emerges at ∼700 nm. This long-wavelength feature is
red-shifted with tR and reaches ∼730
nm at tR = 300 s and is subsequently blue-shifted
slightly to ∼720 nm at tR = 600
s and remains approximately at that wavelength until tR = 1800 s. On the other hand, the absorption feature
of PbI2 at ∼520 nm decreases in its strength with tR and diminishes at tR = 600 s. Correspondingly, the (100) peak of the perovskite film
in the XRD profile emerges at 2θ = 14.34° at tR = 180 s is shifted to 2θ = 14.31° at tR = 300 s, returns to 2θ = 14.34°
at tR = 600 s, and is gradually shifted
to 2θ = 14.31° at tR = 1800
s, while the XRD peak strength of PbI2 at 2θ = 12.67°
decreases to nearly zero at tR = 600 s. Figure 5b shows the extracted
Br compositions of the perovskite films at these tR’s as well as those of PbI2 reacting
with MABr for comparison. The A(λ) and ID (2θ) results of the grown perovskite
films with different fBrs are alike (Figure S7). The results from these two growth
scenarios show similar behaviors: An initial decrease in Br composition
is followed by a gradual rise. Since both Br– and
I– are present in the precursor solution in this
reaction scenario, three traits in the resultant evolution of the
Br composition are expected. First, compared to the PbI2–MABr scenario, the initial Br composition in the PbI2–MABr:MAI scenario is expectantly smaller, resulting
in a capping perovskite layer with narrower channels between larger
perovskite grains, due to larger iodine61,62 and thus with
less permeability for methylammonium cations and halogen anions. Second,
compared with the behavior of Stage 2 in the PbI2–MABr
scenario, the minimal Br composition of the grown perovskite films, xD–min, is smaller and the reaction time
to attain it,  , is longer. Third, the I-to-Br
exchange
in Stage 3 would proceed more slowly, and the final Br composition
would be smaller. These characteristics become more significant as fBr is smaller (Figure S8). In summary, the perovskite growth results of this scenario also
effectuate the three-stage model.
, is longer. Third, the I-to-Br
exchange
in Stage 3 would proceed more slowly, and the final Br composition
would be smaller. These characteristics become more significant as fBr is smaller (Figure S8). In summary, the perovskite growth results of this scenario also
effectuate the three-stage model.
Figure 5.

(a) UV–vis absorption spectra and X-ray diffraction (XRD) profiles of MAPbBrxI3–x films produced with PbI2 reacting with a MABr:MAI solution with 50% Br– fraction at different reaction times (tRs) with a reaction temperature TR = 30 °C; (b) Br composition in MAPbBrxI3–x extracted from XRD profiles (filled circles), xD, as a function of tR. The data in Figure 1(b) (open circles) are placed in (b) for comparison. The solid lines in (b) are guides to eyes.
Fabrication Guidelines of MAPbBrxI3–x
All the mixed-halide
perovskites grown with the two scenarios—(1) PbI2 reacting with MABr solution and (2) PbI2 reacting with
MABr:MAI solution—cover the MAPbBrxI3–x films with x varying from 0.1 to 2.9. Most importantly, these mixed-halide perovskite
films confer sharp XRD peaks and steep absorption onsets, indicating
that they are homogeneous and free of phase segregation which often
occurs in the mixed-halide perovskite films produced with the one-step
growth method.12 Our preliminary optical
characterizations with photoluminescence and Raman spectroscopy also
confirm the single-phase growth of mixed-halide perovskites and will
be reported in future publications. Based on these results, we therefore
derive two guidelines for fabricating high-quality mixed-halide perovskites.
First, the PbI2–MABr scenario in the third anion-exchange
stage produces the MAPbBrxI3–x films covering x from 1.5 to 2.9,
as exemplified in Figure 1b. Second, the PbI2–MABr:MAI scenario after
the second stage produces the MAPbBrxI3–x films with x varying
from 0.1 to 1.5 according to the dependences of the Br composition
of the MAPbBrxI3–x film on the fraction of Br– in MABr:MAI
solution and on the reaction time (Figure S8). The resultant homogeneous single-phase mixed-halide perovskites,
which are difficult to come by with the one-step method if not impossible,
provide a great opportunity to interrogate the dependence of fundamental
optoelectronic properties on halide composition, particularly the
energy- and charge-transfer properties that are sensitive to material
imperfections and phase segregation. Figure 6 shows the relation between the energy bandgap Eg and the lattice constant a of MAPbBrxI3–x with x ranging from 0.3 to 2.9 that were
grown according to the guidelines. The lattice constants of the three
tetragonal-phase samples in the figure were obtained by their corresponding
lattice constants of the ab plane divided by  .53 Of note,
all the grown samples are single phase and free of phase segregation
according to their XRD profiles.
.53 Of note,
all the grown samples are single phase and free of phase segregation
according to their XRD profiles.
Figure 6.

Extracted energy bandgap (Eg) from
UV–vis absorption spectra vs extracted lattice constant a from X-ray diffraction of grown MAPbBrxI3–x with x ranging from 0.3 to 2.9 according to the guidelines (detailed in
text). The lattice constants of the three tetragonal-phase samples
were obtained by their corresponding lattice constants of the ab plane divided by  . Equation (1)52 was used to obtain the relationship between a and xD.
Strengths and Issues
The design of this study has three strengths. First, we partially or completely replaced the halogen element in ammonium-halide solution to investigate the two-step solution-growth process of ammonium lead-halide perovskites, offering an unprecedented opportunity to decipher the dominant role of halogen from the lead-halide template in constructing the perovskite structure. Second, optical absorption spectroscopy and X-ray diffraction provide complementary characterization functions in monitoring the two-step growth process, allowing us to derive a three-stage model and quantitatively analyze the kinetics of the dissolution of the lead-halide template and the construction of perovskites. Third, the unfolded kinetic results help in developing two fabrication guidelines of single-phase mixed-halide perovskites with predictable stoichiometry. Most importantly, the mechanistic role of the lead-halide template in Stage 2 is revealed through the study design: The mesoscopic channels inside the lead-halide substrate guide the permeation of the ions in solution, while its crystallinity affects the crystal quality of the grown perovskite film.
Given the discoveries resulting from this study, there still exist several issues and limitations that are worthy of further discussion. First, in light of the revealed role of the lead-halide template in the two-step method, can the previously reported approaches to optimize its crystallinity and morphology be further improved? In our view, these efforts lacked structural and compositional characterization tools to monitor the progression of the lead halide/perovskite interface during Stage 2 of the two-step growth process, thus, mystifying the relation between the prepared lead-halide template and the grown perovskite. Commonly used X-ray diffraction bears low spatial resolution, while electron microscopy is futile at interfacial growth, leaving optical probes to be the sensible option in future studies. Second, can the exsitu characterizations of the samples performed in this study truthfully capture the optical and structural states during the reaction, given quite a few recent in situ research efforts?74 That is, will the samples remain their propensities after leaving away from their reaction conditions and during the characterizations? With the careful practices described in the section of Experimental Methods, the Br composition of each MAPbBrxI3–x perovskite film determined with its bandgap and XRD profile agree within 0.2 (Figure S4), indicating that the sample remained in its state between the measuring moments of XRD and optical spectrophotometry. Furthermore, Smecca et al.75 showed that the XRD signal of the MAPbI3 film decays in air, due to decomposition to PbI2, with an activation energy of ∼1 eV, which is consistent with the finding by Wang et al.76 with spectroscopic ellipsometry, and in vacuum with an activation energy of ∼1.5 eV. Since the time for the film at 90 °C to lose 10% of its original thickness is T90 = 2000 min, the corresponding T90 at 25 °C is estimated to be >3 yr. MAPbBr3 is more stable, due to the suppression of MA+ and Br– migration.77 That is, the degradation of our samples during the storage in the glovebox, the sample transfer, and the XRD and spectrophotometric measurements are negligible. Lastly, our samples did not exhibit any recognizable phase segregation in the XRD profiles and UV–vis optical absorption spectra, indicating no light-induced phase segregation when the samples were temporally exposed to ambient light during the measurements. Third, why was photoluminescence (PL) spectroscopy, commonly used in previous studies, not exploited to characterize the samples? PL spectroscopy is known to suffer from nonradiative recombination processes due to traps, energy transfer, etc.,78 thus compromising the usage of its signal for quantitative analysis. In addition, phase segregation can be induced in mixed-halide perovskites upon inappropriate photoexcitation during PL measurements,79−81 thus making faulty inference on the evolution of the Br composition. Fourth, although the activation energy of the dissolution of PbI2 lattice and the simultaneous formation of MAPbBrxI3–x perovskite was extracted in this study, how does it depend on the preparation conditions of lead-halide substrate and on the dissolved cation and anion (e.g., MABr:MAI)? More experimental data and a comprehensive kinetic model are needed to answer these questions. Nevertheless, the derived three-stage model can provide a sensible basis to design extended experiments and to develop a more inclusive model for different reaction scenarios. Fifth, do haloplumbates or iodoplumbates exist as the intermediate species in the two-step growth process, like in the one-step growth process?34,35 If yes, how can they be observed? Their presence based on the optical absorption signatures observed in the one-step growth process may not necessarily reflect their participation in the growth process, because the actual crystallization process, suggested by eq 4, has never been experimentally observed. In contrast, the dissolution of the PbI2 lattice and the formation of the labile haloplumbates within the restricted channels in the PbI2 film, illustrated in eq 3, can be monitored with optical and vibrational spectroscopy during the reaction to verify the involvement of the haloplumbates, probably necessitating some special experimental design to improve their spatiotemporal resolution and to enhance their sensitivity. Of note, Yoon et al.31 observed absorption feature of [PbBr3]− and [PbBr4]2– in solution while Li et al.33 claimed no bromoplumbate complex was observed in a similar condition, signifying the complexity of this unsettled issue. The temporary configuration of the PbBrxI3–x···MA complex could also be captured before the perovskite lattice is formed, if it does exist. Nevertheless, the coincident processes of PbI2 depletion and perovskite growth observed in this study reject any delay due to such an intermediate specie. Sixth, do the top and bottom regions of the grown MAPbBrxI3–x film show different stoichiometries according to the two fabrication guidelines described above, because of inhomogeneous I-to-Br exchange for x ≥ 1.5 and the different diffusivities of Br– and I– for x ≤ 1.5? Our preliminary photoluminescence (PL) study of the sample upon low-power photoexcitation at 310 nm with front- and back-surface excitation schemes showed the same PL wavelengths (Figure S9). Since the absorption depth (inverse of absorption coefficient) at this excitation wavelength for both MAPbBr3 and MAPbI3 is ∼30 nm82 that is significantly smaller than the thickness of the perovskite films (∼300 nm), the consistent PL wavelength obtained with these two excitation schemes indicates homogeneous stoichiometric distribution throughout the perovskite film. As a note, since the diffusion length of Br– in MAPbI3 (>10 μm)64 is much longer than the film thickness of this study (∼300 nm), it is no surprise of the observed stoichiometric homogeneity. Seventh, as the MAPbBrxI3–x perovskites could also be produced by PbBryI2–y substrate reacting with MAI or even MABr:MAI in solution,83,84 can the reaction of such scenarios be explained with the three-stage model and produce stoichiometrically uniform mixed-halide perovskites? We also monitored the perovskite growth by the PbBryI2–y substrate reacting with MAI solution. When the reaction proceeded to tR = 1 min, the XRD peak of PbBryI2–y was found to move to the angle corresponding to the XRD peak of PbI2 with an amplitude greatly reduced and a small XRD peak appeared at 2θ ∼ 14.3° corresponding to pseudocubic MAPbBrxI3–x, while other new prominent peaks also emerged. Simultaneously, an absorption feature at >600 nm and another one at ∼400 nm appeared besides the feature of PbI2 at ∼520 nm (Figure S10). The new emergent XRD peaks, which are different from those of pseudocubic MAPbBrxI3–x and PbI2, agree with the ones corresponding to crystalline PbBr1.2I0.8,85 while the absorption feature at ∼400 nm is consistent with its absorption spectrum.86 That is, the original phase of PbBryI2–y was transformed promptly to a mixture of the dominant PbBr1.2I0.8 phase and the PbI2 phase by the initial interaction between the PbBryI2–y substrate and I–. This observation is consistent with a recent study by Sheikh et al.86 The XRD peaks and the absorption feature of this new phase largely remained up to tR = 10 min, while the growth of the mixed-halide perovskite was much slower than the one of PbI2 interacting with the same concentration of MAI solution, indicating that the dissolution of PbBr1.2I0.8 is inefficient compared with that of PbI2 and therefore the growth of mixed-halide perovskites is affected. Because of the involved complication in the dissolution of PbBr1.2I0.8 and PbI2 and the much slower growth rate, the three-stage model needs to be modified to comprehend the observations, and accordingly, this growth scenario is not recommended for the production of mixed-halide perovskites. We note that Barrit et al.84 recently demonstrated the production of MAPbBr0.3I2.7, MAPbBr1.2I1.8 and MAPbBr1.8I1.2 with sequential spin-coating deposition of PbBryI2–y films and MABr:MAI solutions, but no growth mechanism was derived to provide fabrication guidelines. Furthermore, their grazing-incidence wide-angle X-ray scattering (GIWAXS) distribution and XRD patterns exhibited some asymmetric and irregular shapes, implicating possible inhomogeneous stoichiometry.
Conclusions
The respective roles of I in PbI2 substrate and Br– in MABr solution in the two-step solution-growth process of MAPbBrxI3–x were interrogated in this study. The growth evolution was monitored with ex-situ optical and structural characterizations. A three-stage model was derived based on the optical and structural characterization results to describe the growth process: (1) growth of perovskite top capping layer with high Br composition, (2) depletion of residual PbI2 and simultaneous growth of underneath perovskite with medium Br composition, and (3) I-to-Br exchange in the grown mixed-halide perovskite. This revelation is not possible with the growth of MAPbI3 or MAPbBr3 because there is no way to differentiate the halide X roles from those of the PbX2 substrate and the MAX solution. This model was equally applicable to the growth scenario of PbI2 reacting with MABr:MAI in solution. The results obtained allow us to propose two fabrication guidelines of MAPbBrxI3–x: (1) for x ≥ 1.5, the perovskite can be grown by PbI2 reacting with MABr in the third stage at an appropriate reaction time; (2) for x ≤ 1.5, the perovskite can be grown by PbI2 reacting with MABr:MAI with an appropriate mixing ratio and reaction time. According to the presented optical and structural characterization results, the grown perovskites are of high crystallinity, a predictable stoichiometric ratio, and importantly superior phase homogeneity. The demystified mechanism of the two-step solution-growth method and the resultant fabrication guidelines of mixed-halide perovskites would facilitate the high-quality large-scale production of optoelectronic perovskites.
Acknowledgments
The authors thank the financial support from National Science and Technology Council (NSTC 112-2112-M-002-034) and Academia Sinica (AS-iMATE-111-31 and AS-iMATE-113-31) in Taiwan.
Supporting Information Available
The Supporting Information is available free of charge at https://pubs.acs.org/doi/10.1021/acsomega.4c02650.
Experimental details (including materials, fabrication methods, characterization, and data analysis), progression of XRD profiles and UV absorption spectra of MAPbBrxI3–x and extracted Br composition, kinetics analysis of depletion of PbI2 and evolution of Br composition, stoichiometric homogeneity of MAPbBrxI3–x film revealed by photoluminescence (PDF)
The authors declare no competing financial interest.
Supplementary Material
References
- Kim G.-W.; Petrozza A. Defect tolerance and intolerance in metal-halide perovskites. Adv. Energy Mater. 2020, 10, 2001959. 10.1002/aenm.202001959. [DOI] [Google Scholar]
- Zhang L.; Mei L.; Wang K.; Lv Y.; Zhang S.; Lian Y.; Liu X.; Ma Z.; Xiao G.; Liu Q.; et al. Advances in the application of perovskite materials. Nano-Micro Lett. 2023, 15, 177. 10.1007/s40820-023-01140-3. [DOI] [PMC free article] [PubMed] [Google Scholar]
- Nie W.; Iniewski K. K., Metal-halide perovskite semiconductors: From physical properties to opto-electronic devices and X-ray sensors by; Springer Nature, 2023. [Google Scholar]
- Kojima A.; Teshima K.; Shirai Y.; Miyasaka T. Organometal halide perovskites as visible-light sensitizers for photovoltaic cells. J. Am. Chem. Soc. 2009, 131, 6050–6051. 10.1021/ja809598r. [DOI] [PubMed] [Google Scholar]
- Fu Q.; Jen A. K. Y. Perovskite solar cell developments, what’s next?. Next Energy 2023, 1, 100004. 10.1016/j.nxener.2023.100004. [DOI] [Google Scholar]
- NREL. Best research-cell efficiency Chart; https://www.nrel.gov/pv/cell-efficiency.html.(accessed 2024–February–4).
- Conings B.; Drijkoningen J.; Gauquelin N.; Babayigit A.; D’Haen J.; D’Olieslaeger L.; Ethirajan A.; Verbeeck J.; Manca J.; Mosconi E.; De Angelis F.; Boyen H. G.; Angelis F. D.; Boyen H.-G. Intrinsic thermal instability of methylammonium lead trihalide perovskite. Adv. Energy Mater. 2015, 5, 1500477. 10.1002/aenm.201500477. [DOI] [Google Scholar]
- Boyd C. C.; Cheacharoen R.; Leijtens T.; McGehee M. D. Understanding degradation mechanisms and improving stability of perovskite photovoltaics. Chem. Rev. 2019, 119, 3418–3451. 10.1021/acs.chemrev.8b00336. [DOI] [PubMed] [Google Scholar]
- Mazumdar S.; Zhao Y.; Zhang X. Stability of perovskite solar cells: degradation mechanisms and remedies. Front. Electron. 2021, 2, 712785. 10.3389/felec.2021.712785. [DOI] [Google Scholar]
- Ugur E.; Alarousu E.; Khan J. I.; Vlk A.; Aydin E.; De Bastiani M.; Balawi A. H.; Gonzalez Lopez S. P.; Ledinský M.; De Wolf S.; Laquai F. How humidity and light exposure change the photophysics of metal halide perovskite solar cells. Sol. RRL 2020, 4, 2000382. 10.1002/solr.202000382. [DOI] [Google Scholar]
- Wang D.; Wright M.; Elumalai N. K.; Uddin A. Stability of perovskite solar cells. Sol. Energy Mater. Sol. Cells 2016, 147, 255–275. 10.1016/j.solmat.2015.12.025. [DOI] [Google Scholar]
- Soto-Montero T.; Soltanpoor W.; Morales-Masis M. Pressing challenges of halide perovskite thin film growth. APL Mater. 2020, 8, 110903. 10.1063/5.0027573. [DOI] [Google Scholar]
- McMeekin D. P.; Holzhey P.; Furer S. O.; Harvey S. P.; Schelhas L. T.; Ball J. M.; Mahesh S.; Seo S.; Hawkins N.; Lu J.; et al. Intermediate-phase engineering via dimethylammonium cation additive for stable perovskite solar cells. Nat. Mater. 2023, 22, 73–83. 10.1038/s41563-022-01399-8. [DOI] [PubMed] [Google Scholar]
- Hwang I. Challenges in controlling the crystallization pathways and kinetics for highly reproducible solution-processing of metal halide perovskites. J. Phys. Chem. C 2023, 127, 24011–24026. 10.1021/acs.jpcc.3c05787. [DOI] [Google Scholar]
- Ahn N.; Son D. Y.; Jang I. H.; Kang S. M.; Choi M.; Park N. G. Highly reproducible perovskite solar cells with average efficiency of 18.3% and best efficiency of 19.7% fabricated via Lewis base adduct of Lead(II) Iodide. J. Am. Chem. Soc. 2015, 137, 8696–8699. 10.1021/jacs.5b04930. [DOI] [PubMed] [Google Scholar]
- Docampo P.; Hanusch F. C.; Stranks S. D.; Döblinger M.; Feckl J. M.; Ehrensperger M.; Minar N. K.; Johnston M. B.; Snaith H. J.; Bein T. Solution deposition-conversion for planar heterojunction mixed halide perovskite solar cells. Adv. Energy Mater. 2014, 4, 1400355. 10.1002/aenm.201400355. [DOI] [Google Scholar]
- Jeon N. J.; Noh J. H.; Kim Y. C.; Yang W. S.; Ryu S.; Seok S. I. Solvent engineering for high-performance inorganic–organic hybrid perovskite solar cells. Nat. Mater 2014, 13, 897. 10.1038/nmat4014. [DOI] [PubMed] [Google Scholar]
- Schlipf J.; Docampo P.; Schaffer C. J.; Körstgens V.; Bießmann L.; Hanusch F.; Giesbrecht N.; Bernstorff S.; Bein T.; Müller-Buschbaum P. A closer look into two-step perovskite conversion with X-ray scattering. J. Phys. Chem. Lett. 2015, 6, 1265–1269. 10.1021/acs.jpclett.5b00329. [DOI] [PubMed] [Google Scholar]
- Petrus M. L.; Schlipf J.; Li C.; Gujar T. P.; Giesbrecht N.; Müller-Buschbaum P.; Thelakkat M.; Bein T.; Hüttner S.; Docampo P. Capturing the sun: A review of the challenges and perspectives of perovskite solar cells. Adv. Energy Mater. 2017, 7, 1700264. 10.1002/aenm.201700264. [DOI] [Google Scholar]
- Maafa I. M. All-inorganic perovskite solar cells: Recent advancements and challenges. Nanomaterials 2022, 12, 1651. 10.3390/nano12101651. [DOI] [PMC free article] [PubMed] [Google Scholar]
- Yang S.; Chen Y.; Zheng Y. C.; Chen X.; Hou Y.; Yang H. G. Formation of high-quality perovskite thin film for planar heterojunction solar cells. RSC Adv. 2015, 5, 69502–69508. 10.1039/C5RA12348H. [DOI] [Google Scholar]
- Acik M.; Alam T. M.; Guo F.; Ren Y.; Lee B.; Rosenberg R. A.; Mitchell J. F.; Park I. K.; Lee G.; Darling S. B. Substitutional growth of methylammonium lead iodide perovskites in alcohols. Adv. Energy Mater. 2018, 8, 1701726. 10.1002/aenm.201701726. [DOI] [Google Scholar]
- Mastroianni S.; Heinz F. D.; Im J.-H.; Veurman W.; Padilla M.; Schubert M. C.; Würfel U.; Grätzel M.; Park N.-G.; Hinsch A. Analysing the effect of crystal size and structure in highly efficient CH3NH3PbI3 perovskite solar cells by spatially resolved photo- and electroluminescence imaging. Nanoscale 2015, 7, 19653 9662. 10.1039/C5NR05308K. [DOI] [PubMed] [Google Scholar]
- Ko H.; Sin D. H.; Kim M.; Cho K. Predicting the morphology of perovskite thin films produced by sequential deposition method: A crystal growth dynamics study. Chem. Mater. 2017, 29, 1165–1174. 10.1021/acs.chemmater.6b04507. [DOI] [Google Scholar]
- Fu Y.; Meng F.; Rowley M. B.; Thompson B. J.; Shearer M. J.; Ma D.; Hamers R. J.; Wright J. C.; Jin S. Solution growth of single crystal methylammonium lead halide perovskite nanostructures for optoelectronic and photovoltaic applications. J. Am. Chem. Soc. 2015, 137, 5810–5818. 10.1021/jacs.5b02651. [DOI] [PubMed] [Google Scholar]
- Shih Y. C.; Lan Y. B.; Li C. S.; Hsieh H. C.; Wang L.; Wu C. I.; Lin K. F. Amino-acid-induced preferential orientation of perovskite crystals for enhancing interfacial charge transfer and photovoltaic performance. Small 2017, 13, 1604305. 10.1002/smll.201604305. [DOI] [PubMed] [Google Scholar]
- Chang C. Y.; Huang H. H.; Tsai H.; Lin S. L.; Liu P. H.; Chen W.; Hsu F. C.; Nie W.; Chen Y. F.; Wang L. Facile fabrication of self-assembly functionalized polythiophene hole transporting layer for high performance perovskite solar cells. Adv. Sci. 2021, 8, 2002718. 10.1002/advs.202002718. [DOI] [PMC free article] [PubMed] [Google Scholar]
- Im J.-H.; Jang I.-H.; Pellet N.; Grätzel M.; Park N.-G. Growth of CH3NH3PbI3 cuboids with controlled size for high-efficiency perovskite solar cells. Nat. Nanotechnol. 2014, 9, 927–932. 10.1038/nnano.2014.181. [DOI] [PubMed] [Google Scholar]
- Ahn N.; Kang S. M.; Lee J.-W.; Choi M.; Park N.-G. Thermodynamic regulation of CH3NH3PbI3 crystal growth and its effect on photovoltaic performance of perovskite solar cells. J. Mater. Chem. A 2015, 3, 19901–19906. 10.1039/C5TA03990H. [DOI] [Google Scholar]
- Jiang J.; Vicent-Luna J. M.; Tao S. The role of solvents in the formation of methyl- ammonium lead triiodide perovskite. J. Energy Chem. 2022, 68, 393–400. 10.1016/j.jechem.2021.12.030. [DOI] [Google Scholar]
- Yoon S. J.; Stamplecoskie K. G.; Kamat P. V. How lead halide complex chemistry dictates the composition of mixed halide perovskites. J. Phys. Chem. Lett. 2016, 7, 13681373. 10.1021/acs.jpclett.6b00433. [DOI] [PubMed] [Google Scholar]
- Shargaieva O.; Kuske L.; Rappich J.; Unger E.; Nickel N. H. Building blocks of hybrid perovskites: A photoluminescence study of lead-iodide solution species. ChemPhyschem 2020, 21, 2327–2333. 10.1002/cphc.202000479. [DOI] [PMC free article] [PubMed] [Google Scholar]
- Li Z.; Johnston A.; Wei M.; Saidaminov M. I.; Martins de Pina J.; Zheng X.; Liu J.; Liu Y.; Bakr O. M.; Sargent E. H. Solvent-solute coordination engineering for efficient perovskite luminescent solar concentrators. Joule 2020, 4, 631–643. 10.1016/j.joule.2020.01.003. [DOI] [Google Scholar]
- Xiang W.; Zhang J.; Liu S.; Albrecht S.; Hagfeldt A.; Wang Z. Intermediate phase engineering of halide perovskites for photovoltaics. Joule 2022, 6, 315–339. 10.1016/j.joule.2021.11.013. [DOI] [Google Scholar]
- Petrov A. A.; Sokolova I. P.; Belich N. A.; Peters G. S.; Dorovatovskii P. V.; Zubavichus Y. V.; Khrustalev V. N.; Petrov A. V.; Grätzel M.; Goodilin E. A.; et al. Crystal structure of DMF-intermediate phases uncovers the link between CH3NH3PbI3 morphology and precursor stoichiometry. J. Phys. Chem. C 2017, 121, 20739–20743. 10.1021/acs.jpcc.7b08468. [DOI] [Google Scholar]
- Guo Y.; Shoyama K.; Sato W.; Matsuo Y.; Inoue K.; Harano K.; Liu C.; Tanaka H.; Nakamura E. Chemical pathways connecting lead(II) iodide and perovskite via polymeric plumbate(II) fiber. J. Am. Chem. Soc. 2015, 137, 15907–15914. 10.1021/jacs.5b10599. [DOI] [PubMed] [Google Scholar]
- Liang K.; Mitzi D. B.; Prikas M. T. Synthesis and characterization of organic–inorganic perovskite thin films prepared using a versatile two-step dipping technique. Chem. Mater. 1998, 10, 403–411. 10.1021/cm970568f. [DOI] [Google Scholar]
- Han Y.; Xie H.; Lim E. L.; Bi D. Review of two-step method for lead halide perovskite solar cells. Sol. RRL 2022, 6, 2101007. 10.1002/solr.202101007. [DOI] [Google Scholar]
- Wang M.; Feng Y.; Bian J.; Liu H.; Shi Y. A comparative study of one-step and two-step approaches for MAPbI3 perovskite layer and its influence on the performance of mesoscopic perovskite solar cell. Chem. Phys. Lett. 2018, 692, 44–49. 10.1016/j.cplett.2017.12.012. [DOI] [Google Scholar]
- Soltanpoor W.; Dreessen C.; Sahiner M. C.; Susic I.; Afshord A. Z.; Chirvony V. S.; Boix P. P.; Gunbas G.; Yerci S.; Bolink H. J. Hybrid vapor-solution sequentially deposited mixed-halide perovskite solar cells. ACS Appl. Energy Mater. 2020, 3, 8257–8265. 10.1021/acsaem.0c00686. [DOI] [Google Scholar]
- Ummadisingu A.; Grätzel M. Revealing the detailed path of sequential deposition for metal halide perovskite formation. Sci. Adv. 2018, 4, e1701402 10.1126/sciadv.1701402. [DOI] [PMC free article] [PubMed] [Google Scholar]
- Chauhan M.; Zhong Y.; Schötz K.; Tripathi B.; Köhler A.; Huettner S.; Panzer F. Investigating two-step MAPbI3 thin film formation during spin coating by simultaneous in situ absorption and photoluminescence spectroscopy. J. Mater. Chem. A 2020, 8, 5086–5094. 10.1039/C9TA12409H. [DOI] [Google Scholar]
- Kim S.; Jo H. J.; Sung S.; Kim D. Perspective: Understanding of ripening growth model for minimum residual PbI2 and its limitation in the planar perovskite solar cells. APL Mater. 2016, 4, 100901. 10.1063/1.4963841. [DOI] [Google Scholar]
- Yang S.; Zheng Y. C.; Hou Y.; Chen X.; Chen Y.; Wang Y.; Zhao H.; Yang H. G. Formation mechanism of freestanding CH3NH3PbI3 functional crystals: in situ transformation vs. dissolution–crystallization. Chem. Mater. 2014, 26, 6705–6710. 10.1021/cm5028817. [DOI] [Google Scholar]
- Brenner T. M.; Rakita Y.; Orr Y.; Klein E.; Feldman I.; Elbaum M.; Cahen D.; Hodes G. Conversion of single crystalline PbI2 to CH3NH3PbI3: Structural relations and transformation dynamics. Chem. Mater. 2016, 28, 6501–6510. 10.1021/acs.chemmater.6b01747. [DOI] [Google Scholar]
- Arora N.; Greco A.; Meloni S.; Hinderhofer A.; Mattoni A.; Rothlisberger U.; Hagenlocher J.; Caddeo C.; Zakeeruddin S. M.; Schreiber F.; et al. Kinetics and energetics of metal halide perovskite conversion reactions at the nanoscale. Commun. Mater. 2022, 3, 22. 10.1038/s43246-022-00239-1. [DOI] [Google Scholar]
- Kaiser W.; Mosconi E.; Alothman A. A.; Meggiolaro D.; Gagliardi A.; De Angelis F. Halide-driven formation of lead halide perovskites: Insight from ab initio molecular dynamics simulations. Mater. Adv. 2021, 2, 3915–3926. 10.1039/D1MA00371B. [DOI] [Google Scholar]
- Klein J.; Kampermann L.; Mockenhaupt B.; Behrens M.; Strunk J.; Bacher G. Limitations of the Tauc plot method. Adv. Funct. Mater. 2023, 33, 2304523. 10.1002/adfm.202304523. [DOI] [Google Scholar]
- Ahuja R.; Arwin H.; Persson C.; Osorio-Guillén J. M.; Souza de Almeida J.; Moyses Araujo C.; Veje E.; Veissid N.; An C. Y.; Pepe I.; et al. Electronic and optical properties of lead iodide. J. Appl. Phys. 2002, 92, 7219–7224. 10.1063/1.1523145. [DOI] [Google Scholar]
- Frisenda R.; Island J. O.; Lado J. L.; Giovanelli E.; Gant P.; Nagler P.; Bange S.; Lupton J. M.; Schüller C.; Molina-Mendoza A. J.; et al. Characterization of highly crystalline lead iodide nanosheets prepared by room-temperature solution processing. Nanotechnology 2017, 28, 455703. 10.1088/1361-6528/aa8e5c. [DOI] [PubMed] [Google Scholar]
- Barrit D.; Sheikh A. D.; Munir R.; Barbé J. M.; Li R. P.; Smilgies D. M.; Amassian A. Hybrid perovskite solar cells: In situ investigation of solution-processed PbI2 reveals metastable precursors and a pathway to producing porous thin films. J. Mater. Res. 2017, 32, 1899–1907. 10.1557/jmr.2017.117. [DOI] [Google Scholar]
- Fedeli P.; Gazza F.; Calestani D.; Ferro P.; Besagni T.; Zappettini A.; Calestani G.; Marchi E.; Ceroni P.; Mosca R. Influence of the synthetic procedures on the structural and optical properties of mixed-halide (Br, I) perovskite films. J. Phys. Chem. C 2015, 119, 21304–21313. 10.1021/acs.jpcc.5b03923. [DOI] [Google Scholar]
- Lehmann F.; Franz A.; Többens D. M.; Levcenco S.; Unold T.; Taubert A.; Schorr S. The phase diagram of a mixed halide (Br, I) hybrid perovskite obtained by synchrotron X-ray diffraction. RSC Adv. 2019, 9, 11151–11159. 10.1039/C8RA09398A. [DOI] [PMC free article] [PubMed] [Google Scholar]
- Hoke E. T.; Slotcavage D. J.; Dohner E. R.; Bowring A. R.; Karunadasa H. I.; McGehee M. D. Reversible photo-induced trap formation in mixed-halide hybrid perovskites for photovoltaics. Chem. Sci. 2015, 6, 613–617. 10.1039/C4SC03141E. [DOI] [PMC free article] [PubMed] [Google Scholar]
- Zhang Y.; Liu Y.; Li Y.; Yang Z.; Liu S. Perovskite CH3NH3Pb(BrxI1-x)3 single crystals with controlled composition for fine-tuned bandgap towards optimized optoelectronic applications. J. Mater. Chem. C 2016, 4, 9172–9178. 10.1039/C6TC03592B. [DOI] [Google Scholar]
- Nakamura Y.; Shibayama N.; Hori A.; Matsushita T.; Segawa H.; Kondo T. Crystal systems and lattice parameters of CH3NH3Pb(I1–xBrx)3 determined using single crystals: Validity of Vegard’s law. Inorg. Chem. 2020, 59, 6709–6716. 10.1021/acs.inorgchem.9b03421. [DOI] [PubMed] [Google Scholar]
- Wang W. F.; Su J.; Zhang L.; Lei Y.; Wang D.; Lu D.; Bai Y. Growth of mixed-halide perovskite single crystals. CrystEngcomm 2018, 20, 1635–1643. 10.1039/C7CE01691C. [DOI] [Google Scholar]
- Wang Z.; Zhou Y.; Pang S.; Xiao Z.; Zhang J.; Chai W.; Xu H.; Liu Z.; Padture N. P.; Cui G. Additive-modulated evolution of HC(NH2)2PbI3 black polymorph for mesoscopic perovskite solar cells. Chem. Mater. 2015, 27, 7149–7155. 10.1021/acs.chemmater.5b03169. [DOI] [Google Scholar]
- Stamplecoskie K. G.; Manser J. S.; Kamat P. V. Dual nature of the excited state in organic–inorganic lead halide perovskites. Energy Environ. Sci. 2015, 8, 208–215. 10.1039/C4EE02988G. [DOI] [Google Scholar]
- Manser J. S.; Saidaminov M. I.; Christians J. A.; Bakr O. M.; Kamat P. V. Making and Breaking of lead halide perovskites. Acc. Chem. Res. 2016, 49, 330–338. 10.1021/acs.accounts.5b00455. [DOI] [PubMed] [Google Scholar]
- Jain S. M.; Philippe B.; Johansson E. M. J.; Park B. W.; Rensmo H.; Edvinsson T.; Boschloo G. Vapor phase conversion of PbI2 to CH3NH3PbI3: Spectroscopic evidence for formation of an intermediate phase. J. Mater. Chem. A 2016, 4, 2630–2642. 10.1039/C5TA08745G. [DOI] [Google Scholar]
- Weber D. CH3NH3PbX3, ein Pb(II)-system mit kubischer perowskitstruktur/CH3NH3PbX3, a Pb(II)-system with cubic perovskite structure. Z. Naturforsch. B 1978, 33, 1443–1445. 10.1515/znb-1978-1214. [DOI] [Google Scholar]
- Pellet N.; Teuscher J.; Maier J.; Grätzel M. Transforming hybrid organic inorganic perovskites by rapid halide exchange. Chem. Mater. 2015, 27, 2181–2188. 10.1021/acs.chemmater.5b00281. [DOI] [Google Scholar]
- Ghasemi M.; Guo B.; Darabi K.; Wang T.; Wang K.; Huang C.-W.; Lefler B. M.; Taussig L.; Chauhan M.; Baucom G.; et al. A multiscale ion diffusion framework sheds light on the diffusion-stability-hysteresis nexus in metal halide perovskites. Nat. Mater. 2023, 22, 329–337. 10.1038/s41563-023-01488-2. [DOI] [PubMed] [Google Scholar]
- Brunetti B.; Cavallo C.; Ciccioli A.; Gigli G.; Latini A. On the thermal and thermodynamic (In) stability of methylammonium lead halide perovskites. Sci. Rep. 2016, 6, 31896. 10.1038/srep31896. [DOI] [PMC free article] [PubMed] [Google Scholar]
- Fan Z.; Xiao H.; Wang Y.; Zhao Z.; Lin Z.; Cheng H.-C.; Lee S.-J.; Wang G.; Feng Z.; Goddard W. A. Layer-by-layer degradation of methylammonium lead tri-iodide perovskite microplates. Joule 2017, 1, 548–562. 10.1016/j.joule.2017.08.005. [DOI] [Google Scholar]
- Nagabhushana G. P.; Shivaramaiah R.; Navrotsky A. Direct calorimetric verification of thermodynamic instability of lead halide hybrid perovskites. Proc. Natl. Acad. Sci. U. S. A. 2016, 113, 7717–7721. 10.1073/pnas.1607850113. [DOI] [PMC free article] [PubMed] [Google Scholar]
- Yang B.; Keum J.; Ovchinnikova O. S.; Belianinov A.; Chen S.; Du M.-H.; Ivanov I. N.; Rouleau C. M.; Geohegan D. B.; Xiao K. Deciphering halogen competition in organometallic halide perovskite growth. J. Am. Chem. Soc. 2016, 138, 5028–5035. 10.1021/jacs.5b13254. [DOI] [PubMed] [Google Scholar]
- Borrero N. F.; da Silva Filho J. M. C.; Coutinho N. F.; Freitas J. N.; Marques F. C. Thermodynamic analyses on nanoarchitectonics of perovskite from lead iodide: Arrhenius activation energy. J. Inorg. Organomet. Polym. Mater. 2022, 32, 1259–1265. 10.1007/s10904-021-02169-w. [DOI] [Google Scholar]
- Chen Q.; Zhou H.; Hong Z.; Luo S.; Duan H. S.; Wang H. H.; Liu Y.; Li G.; Yang Y. Planar heterojunction perovskite solar cells via vapor–assisted solution process. J. Am. Chem. Soc. 2014, 136, 622–625. 10.1021/ja411509g. [DOI] [PubMed] [Google Scholar]
- Patel J. B.; Milot R. L.; Wright A. D.; Herz L. M.; Johnston M. B. Formation dynamics of CH3NH3PbI3 perovskite following two-step layer deposition. J. Phys. Chem. Lett. 2016, 7, 96–102. 10.1021/acs.jpclett.5b02495. [DOI] [PubMed] [Google Scholar]
- Elmelund T.; Scheidt R. A.; Seger B.; Kamat P. V. Bidirectional halide ion exchange in paired lead halide perovskite films with thermal activation. ACS Energy Lett. 2019, 4, 1961–1969. 10.1021/acsenergylett.9b01280. [DOI] [Google Scholar]
- Elmelund T.; Seger B.; Kuno M.; Kamat P. V. How interplay between photo and thermal activation dictates halide ion segregation in mixed halide perovskites. ACS Energy Lett. 2020, 5, 56–63. 10.1021/acsenergylett.9b02265. [DOI] [Google Scholar]
- Szostak R.; Gonçalves A. D. S.; de Freitas J. N.; Marchezi P. E.; de Araújo F. L.; Tolentino H. C. N.; Toney M. F.; Marques F. C.; Nogueira A. F. In situ and operando characterizations of metal halide perovskite and solar cells: insights from lab-sized devices to upscaling processes. Chem. Rev. 2023, 123, 3160–3236. 10.1021/acs.chemrev.2c00382. [DOI] [PubMed] [Google Scholar]
- Smecca E.; Numata Y.; Deretzis I.; Pellegrino G.; Boninelli S.; Miyasaka T.; Magna A. L.; Alberti A. Stability of solution-processed MAPbI3 and FAPbI3 layers. Phys. Chem. Chem. Phys. 2016, 18, 13413–13422. 10.1039/C6CP00721J. [DOI] [PubMed] [Google Scholar]
- Wang X.; Gong J.; Shan X.; Zhang M.; Xu Z.; Dai R.; Wang Z.; Wang S.; Fang X.; Zhang Z. In situ monitoring of thermal degradation of CH3NH3PbI3 films by spectroscopic ellipsometry. J. Phys. Chem. C 2019, 123, 1362–1369. 10.1021/acs.jpcc.8b12275. [DOI] [Google Scholar]
- McGovern L.; Futscher M. H.; Muscarella L. A.; Ehrler B. Understanding the stability of MAPbBr3 versus MAPbI3: Suppression of methylammonium migration and reduction of halide migration. J. Phys. Chem. Lett. 2020, 11, 7127–7132. 10.1021/acs.jpclett.0c01822. [DOI] [PMC free article] [PubMed] [Google Scholar]
- Kiligaridis A.; Frantsuzov P. A.; Yangui A.; Seth S.; Li J.; An Q.; Vaynzof Y.; Scheblykin I. G. Are Shockley-Read-Hall and ABC models valid for lead halide perovskites?. Nat. Commun. 2021, 12, 3329. 10.1038/s41467-021-23275-w. [DOI] [PMC free article] [PubMed] [Google Scholar]
- Mao W.; Hall C. R.; Chesman A. S.; Forsyth C.; Cheng Y. B.; Duffy N. W.; Smith T. A.; Bach U. Visualizing phase segregation in mixed-halide perovskite single crystals. Angew. Chem., Int. Ed. 2019, 58, 2893–2898. 10.1002/anie.201810193. [DOI] [PubMed] [Google Scholar]
- Zhao Y.; Miao P.; Elia J.; Hu H.; Wang X.; Heumueller T.; Hou Y.; Matt G. J.; Osvet A.; Chen Y.-T.; et al. Strain-activated light-induced halide segregation in mixed-halide perovskite solids. Nat. Commun. 2020, 11, 6328. 10.1038/s41467-020-20066-7. [DOI] [PMC free article] [PubMed] [Google Scholar]
- Suchan K.; Just J.; Beblo P.; Rehermann C.; Merdasa A.; Mainz R.; Scheblykin I. G.; Unger E. Multi-stage phase-segregation of mixed halide perovskites under illumination: A quantitative comparison of experimental observations and thermodynamic models. Adv. Funct. Mater. 2023, 33, 2206047. 10.1002/adfm.202206047. [DOI] [Google Scholar]
- Fujiwara H.; Kato M.; Tamakoshi M.; Miyadera T.; Chikamatsu M. Optical characteristics and operational principles of hybrid perovskite solar cells. Phys. Status Solidi A 2018, 215, 1700730. 10.1002/pssa.201700730. [DOI] [Google Scholar]
- Sutter-Fella C. M.; Li Y.; Amani M.; Ager J. W.; Toma F. M.; Yablonovitch E.; Sharp I. D.; Javey A. High photoluminescence quantum yield in band gap tunable bromide containing mixed halide perovskites. Nano Lett. 2016, 16, 800–806. 10.1021/acs.nanolett.5b04884. [DOI] [PubMed] [Google Scholar]
- Barrit D.; Zhang Y.; Yang T.; Tang M.-C.; Li R.; Smilgies D.-M.; Liu S.; Anthopoulos T. D.; Amassian A.; Zhao K. Sequential formation of tunable-bandgap mixed-halide lead-based perovskites: In situ investigation and photovoltaic devices. Sol. RRL 2021, 5, 2000668. 10.1002/solr.202000668. [DOI] [Google Scholar]
- Levkovets S.; Khyzhun O.; Myronchuk G.; Fochuk P.; Piasecki M.; Kityk I.; Fedorchuk A.; Levkovets V.; Piskach L.; Parasyuk O. Synthesis, electronic structure and optical properties of PbBr1.2I0.8. J. Electron Spectrosc. Relat. Phenom. 2017, 218, 13–20. 10.1016/j.elspec.2017.05.006. [DOI] [Google Scholar]
- Sheikh M. A. K.; Singh S.; Abdur R.; Lee S.-M.; Kim J.-H.; Nam H.-S.; Lee H.; Lee J. Effects of the PbBr2: PbI2 molar ratio on the formation of lead halide thin films, and the ratio’s application for high performance and wide bandgap solar cells. Materials 2022, 15, 837. 10.3390/ma15030837. [DOI] [PMC free article] [PubMed] [Google Scholar]
Associated Data
This section collects any data citations, data availability statements, or supplementary materials included in this article.