

Abstract
Toxicity and emerging drug resistance pose important challenges in PARP inhibitor (PARPi) maintenance therapy of ovarian cancer. We propose that adaptive therapy, which dynamically reduces treatment based on the tumor dynamics, might alleviate both issues. Utilizing in vitro time-lapse microscopy and stepwise model selection, we calibrate and validate a differential equation mathematical model, which we leverage to test different plausible adaptive treatment schedules. Our model indicates that adjusting dosage, rather than skipping treatments, is more effective at reducing drug use while maintaining efficacy, due to a delay in cell kill and a diminishing dose-response relationship. In vivo pilot experiments confirm this conclusion. While our focus is toxicity mitigation, reducing drug use may also delay resistance. This study enhances our understanding of PARPi treatment scheduling and illustrates first steps in developing adaptive therapies for new treatment settings.
A record of this paper’s Transparent Peer Review process is included in the Supplemental Information.
eTOC Summary:
Adaptive therapy tailors treatment to the tumor dynamics and could allow better matching of drug levels to the characteristics of a patient’s disease. Integrating real-time microscopy and mathematical modeling we find that during PARPi maintenance in ovarian cancer, adaptive dose modulation is superior to skipping due to a diminishing dose response and delayed cell kill. This conclusion is confirmed in vivo, and demonstrates how adaptive therapy could enable de-escalating therapy in a personalized fashion.
Graphical Abstract
1. Introduction
PARP (poly-adenosine ribose polymerase) inhibitors (PARPis) are revolutionizing ovarian cancer therapy. These small molecule inhibitors target the PARP family of proteins, in particular PARP1 and PARP2, which help to detect single strand DNA (ssDNA) damage and orchestrate the subsequent repair1,2. PARP inhibition results in a buildup of ssDNA breaks which interfere with DNA regulation and replication (Figure 1a). If the cell attempts to divide, then the replication fork will stall at ssDNA breaks, which causes cell cycle arrest, and double strand breaks2–4 (DSBs). Furthermore, there is growing evidence that PARPis additionally promote this process by trapping PARP proteins directly on the DNA, leaving further obstacles for the cell to resolve4 (Figure 1a). While the damage caused by PARPis can be repaired via the homologous repair (HR) pathway, HR is deficient in many ovarian tumors due to, for example, mutations in BRCA1 or BRCA2. As a result, ovarian cancers rely on more error prone backup mechanisms, such as non-homologous end joining, making PARPis an effective treatment option2–6 (an effect referred to as “synthetic lethality”).
Figure 1.

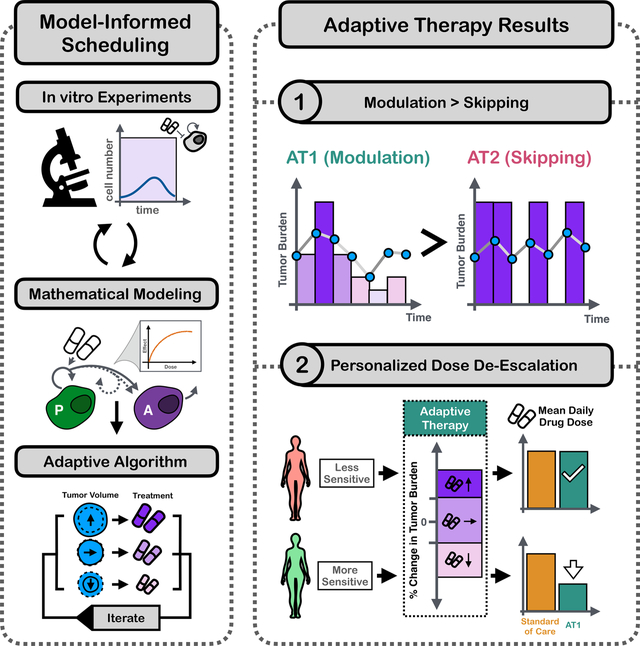
PARPis are revolutionizing ovarian cancer treatment but toxicity and developing resistance are important challenges in the clinic. Here, we developed a mathematical model to help address these issues through more personalized treatment scheduling. a) The mechanism of PARPi-mediated cytotoxicity. PARPs are important proteins in the repair of single strand DNA breaks. But PARPis can trap PARPs on the DNA, which results in stalled replication forks and DSBs during DNA replication. Only cells with intact HR pathways can repair this damage, but tumor cells are typically HR-deficient, and are thus killed. Redrawn with permission from Noordermeer and van Attikum3. b) Outline of our paper. Using in vitro experiments, we derived a mathematical model of PARPi treatment. We proceeded in a stepwise fashion, characterizing the growth, treatment, and dose-response dynamics in turn, and independently validating each step using unseen treatment conditions. Subsequently we leveraged this model to explore plausible adaptive treatment algorithms to reduce cumulative drug use.
Historically, ovarian cancer has been a particularly challenging disease to treat because most patients (70%7) are diagnosed with stage III or IV disease, and because it is remarkably adept at overcoming treatment. 8, 9 But, thanks to PARPis this picture has begun to change. In this study, we will focus on Olaparib (AstraZeneca) which is the longest approved and one of the most widely used of the three currently approved agents. It is given orally and is primarily used as maintenance therapy, which means that treatment is administered after chemotherapy has been completed, with the aim to eradicate the disease or, at least, to push back progression2. Its benefit as a single-agent therapy in patients with germline or somatic BRCA mutations, or as combination therapy with Bevacizumab in patients with an HR deficiency, has been demonstrated in multiple clinical trials8–12, most prominently the SOLO1 (NCT01844986), the SOLO2 (NCT01874353) and the PAOLA-1 (NCT02477644) phase III studies. 12,13But, in all studies most patients still saw their tumor recurring within 5 years11–13. Furthermore, around 40% of patients required dose adjustments due to serious Grade 3 or 4 adverse events, such as anaemia14,15. As such, there is an important need to investigate how we can administer Olaparib more safely and effectively.
Olaparib is currently given according to the maximum tolerated dose (MTD) principle16,17. This means that the dose and frequency of drug administration is chosen to maximize drug exposure whilst maintaining an acceptable toxicity profile. Specifically, patients will take a total dose of 600mg Olaparib per day (2×150mg tablets b.i.d.), and side effects are managed by first temporarily interrupting treatment, and if necessary, reducing the dose to 500mg per day (1×100mg + 1×150mg b.i.d.) and ultimately to 400mg per day (2×100mg tablets b.i.d.)16,18. The rationale for MTD is based on the work by Kaye et al19 and Audeh et al20 who found that reducing dose levels to 50% or 25% of the MTD also reduced the overall response rate from 31% to 25%19, and 33% to 13%20, respectively. However, these dose reductions were large, and they were applied indiscriminately of how sensitive the tumor, or the patient, were to treatment. Furthermore, Fong et al8 found that pharmacodynamic effects plateaued at doses beyond 15% of the MTD, and Francis et al15 detected no negative effect of toxicity-induced treatment reductions during the first 12 weeks of therapy on outcome in the SOLO2 study. This indicates that the exposure-response relationship is clearly diminishing, suggesting that smaller dose reductions may still be possible without markedly impacting response.
The past two decades have revealed that cancers are heterogeneous and dynamic diseases, so that each tumor has its own unique evolutionary history21,22. As a result, the same dose that represents a good trade-off between toxicity and efficacy in one patient, may over- or under-treat another23–25. Furthermore, inter-patient variability in pharmacokinetic processes such as drug uptake or metabolism mean that the same dose results in different levels of exposure in different patients23. Yet, since current dosage recommendations are determined on a population level and only adapted for toxicity but not efficacy, it is challenging to take this inter-patient heterogeneity into account.
The aim of this paper is to investigate whether a personalized approach to treatment scheduling can enable more effective and robust treatment de-escalation of Olaparib maintenance therapy. Our work is motivated by recent promising results of so-called “adaptive therapy” in which therapy is dynamically adjusted according to the tumor’s response dynamics26–29. The underlying rationale is that in advanced cancers, drug tolerant or resistant cells likely exist prior to treatment, but are suppressed by competition for space and resources with more sensitive cancer cell subpopulations26,28. Aggressive treatment at MTD removes this suppression and allows resistance to emerge, but adaptive therapy can leverage competition to extend PFS by maintaining a pool of sensitive cells (e.g. 30–33). The ability of adaptive therapy to delay resistance has been demonstrated in several pre-clinical studies, including in breast cancer34,35, lung cancer36,37, and melanoma38,39, as well as in the chemotherapy treatment of ovarian cancer27,40 where a clinical trial is ongoing (NCT05080556). Clinical feasibility has been demonstrated in a pilot Phase IIb study in androgen deprivation treatment in prostate cancer which reported a 19.2 month increase in median time to progression in comparison to a matched historical control cohort41,42.
Whilst adaptive therapy was developed with the aim of delaying disease progression, it also provides a means for treatment reduction. For example, in the prostate cancer trial, patients received 46% less treatment than the historical control41,43, and adaptive therapy in mouse models of breast34,35 and ovarian cancer40, respectively could steer some tumors into a state in which they remained stable with little to no further treatment36,37,42. Based on these promising results, we hypothesize that adaptive therapy could provide a means to de-escalate PARPi maintenance therapy for ovarian cancer to mitigate pharmacological and financial toxicity. The strategies investigated here could also allow us to better manage resistance and extend PFS even though we will not explicitly consider resistance in this study.
Olaparib’s short half-life, oral administration, and the availability of CA-125 as an easily accessible biomarker to monitor tumor dynamics 44 suggest that adaptive administration may be feasible. However, how should therapy be adapted? Existing adaptive therapy algorithms can be broadly categorized into two types: i) modulation-based approaches which adjust the dose according to response, and ii) skipping-based approaches which always treat at the same (high) dose but omit doses when the tumor is decreasing or under control34,35. The challenge in deciding how and when treatment is adapted is that the number of possible options is too large to exhaustively test in a laboratory. To tackle this issue, we used mathematical modeling which has been establishing itself as a powerful way to improve treatment scheduling45–48. Mathematical models allow for the systematic interrogation of different treatment strategies and unlike traditional laboratory models, they can typically provide outputs in hours rather than days or weeks and are cheap to run (see Botesteanu, et al49 for an in-depth review of mathematical models of ovarian cancer).
In this study, we integrated in vitro experiments and mathematical modeling to characterize the temporal dynamics of ovarian cancer cells under Olaparib treatment, and to investigate whether modulation- or skipping-based adaptive therapy would be more effective and robust at reducing mean drug use (Figure 1b). To calibrate the model, we used in vitro time-lapse microscopy experiments to measure the population dynamics of ovarian cancer cells in response to PARPi treatment under different seeding conditions (low and high initial density) and treatment schedules (continuous and intermittent treatment at different drug concentrations). Leveraging these data, we systematically evaluated different plausible models of treatment response to derive our final calibrated and validated model, and to shed biological insights into the observed dynamics (Figure 1b). To conclude, we used our model to explore different possible PARPi treatment algorithms, showing that strategies which adjust treatment by modulating the dose are predicted to be superior to those skipping treatments. Overall, our study explores how adaptive therapy can be leveraged for personalized treatment de-escalation in PARPi-sensitive disease, and showcases the first steps in developing adaptive therapies in a new treatment setting.
2. Methods:
Resource availability
Lead contact
Requests can be made to the lead contact, Alexander Anderson
(alexander.anderson@moffitt.org).
Materials availability
This study did not generate new, unique reagents.
Data and code availability
The confluence vs time data from the time-lapse microscopy experiments has been deposited at Zenodo (DOI: https://zenodo.org/doi/10.5281/zenodo.10718199). Raw microscopy images will be shared by the lead contact upon request.
The longitudinal volume data, as well as the treatment information for each individual animal in the in vivo experiment has been deposited at Zenodo (DOI: https://zenodo.org/doi/10.5281/zenodo.10718199).
All original code has been deposited at Zenodo and is publicly available as of the date of publication (DOI: https://zenodo.org/doi/10.5281/zenodo.10718199).
Any additional information required to reanalyze the data reported in this paper is available from the lead contact upon request.
Experimental model and study participant details
Cell Culture
OVCAR3 and OVCAR4 cells were acquired from American Type Culture Collection (ATCC, Manassas, VA, 2007 to 2010) and cultured in Roswell Park Memorial Institute (RPMI) medium (ThermoFisher) supplemented with 10% Fetal Bovine Serum and 1% penicillin/streptomycin. Every 3–4 weeks the medium was additionally supplemented with MycoZap (Lonza) to prevent mycoplasma contamination. At all times cells were kept at 37C and in a 5% CO2 atmosphere.
In vivo experiments
We used 6–8 weeks old, female NSG mice (Charles River Laboratories). All animals were maintained in pathogen-free rooms in the Moffitt Cancer Center and Research Institute (Tampa, FL) Vivarium. Animal weights were measured and recorded twice weekly, and the overall health of each animal was noted to ensure timely end points within the experiment. Animals were humanely killed upon progression (tumor size >1500mm2). All experimental procedures were approved by the Institutional Animal Care and Use Committee of the H. Lee Moffitt Cancer Center and University of South Florida.
Methods
Drug response dynamics under continuous treatment
To characterize how the tumor cells grew in the absence of treatment and when exposed continuously to different drug concentrations, we seeded cells in a 48 well flat-bottom plate (Costar Corning) and left them to attach overnight in 200μL culture medium. Subsequently, we aspirated the medium and replaced it with treated growth medium, containing 0, 1, 10, 25, 50 or 100μM Olaparib (AstraZeneca), and monitored their growth for 9 days. We carried out two versions of this assay: i) a “low-density” version in which we seeded cells at 5,000 cells per well, and ii) a “high-density” version in which each well started with 60,000 cells. In each case, 3 replicates were performed for each experimental condition. During the experiment the medium was replaced every 3 days with fresh, drug-containing medium (or drug-free medium in the case of the control wells) to maintain constant drug concentrations. We also tested changing the medium daily but found that this did not change the growth dynamics (Supplementary Figure S1).
To prepare the treated medium, we dissolved Olaparib (AstraZeneca) in 1mL Dimethyl sulfoxide (DMSO), filtered the solution using a 0.22nm syringe filter, and dissolved it in our regular culture medium to obtain a stock solution containing 100μM of drug (DMSO concentration in media: 0.18%). Next, we diluted this maximum tolerated dose (MTD) stock with normal culture medium to obtain batches with 1–50μM Olaparib. We verified that the DMSO did not adversely impact the cells’ growth dynamics (not shown).
Drug response dynamics upon drug withdrawal
To test how the cells responded to treatment withdrawal following different lengths of drug exposure, we seeded 10,000 cells per well in a 48 well flat-bottom plate (Costar Corning) and left them to attach overnight in untreated culture medium. Next, we aspirated the medium and replaced it with treated medium for 1, 2, 4, 7, or 21 days before we withdrew treatment again by replacing the medium with regular culture medium. To maintain constant drug and nutrient concentrations we replaced the medium every 3 days with fresh drug-containing medium (or drug-free medium after the drug had been withdrawn). We repeated this experiment twice: once where cells were treated at 50μM and once where cells were treated at 100μM Olaparib (treated medium was prepared as specified in Section 2.2.). In each case, we carried out 3 replicates for each experimental condition. The experiment lasted a total of 21 days.
Real-time imaging and data processing
Cell growth was monitored once per day using an IncuCyte ZOOM S2 time-lapse microscopy system (Essen BioScience; see Figure 2a for examples). Confluence was measured based on phase-contrast, white light images, which were analyzed using the IncuCyte ZOOM software (10x magnification; confluence estimated based on 2 images per well). On two occasions we accidentally removed large numbers of cells when aspirating out medium during medium changes, and thus we did not include measurements from these wells in our analysis. In addition, when measuring the treatment response of OVCAR4 cells under 100μM Olaparib for 21 days (protocol per Section 2.3.), we found that after 13–14 days the imaging system was greatly overestimating confluence due to the build-up of debris from dead cells on the plate. To avoid this from confounding our results, we decided not to include the data from days 15–21 in our analyses. The raw and curated data are available on our GitHub repository, as is a Jupyter Notebook detailing every data curation/processing step (jnb_dataProcessing.ipynb).
Figure 2.
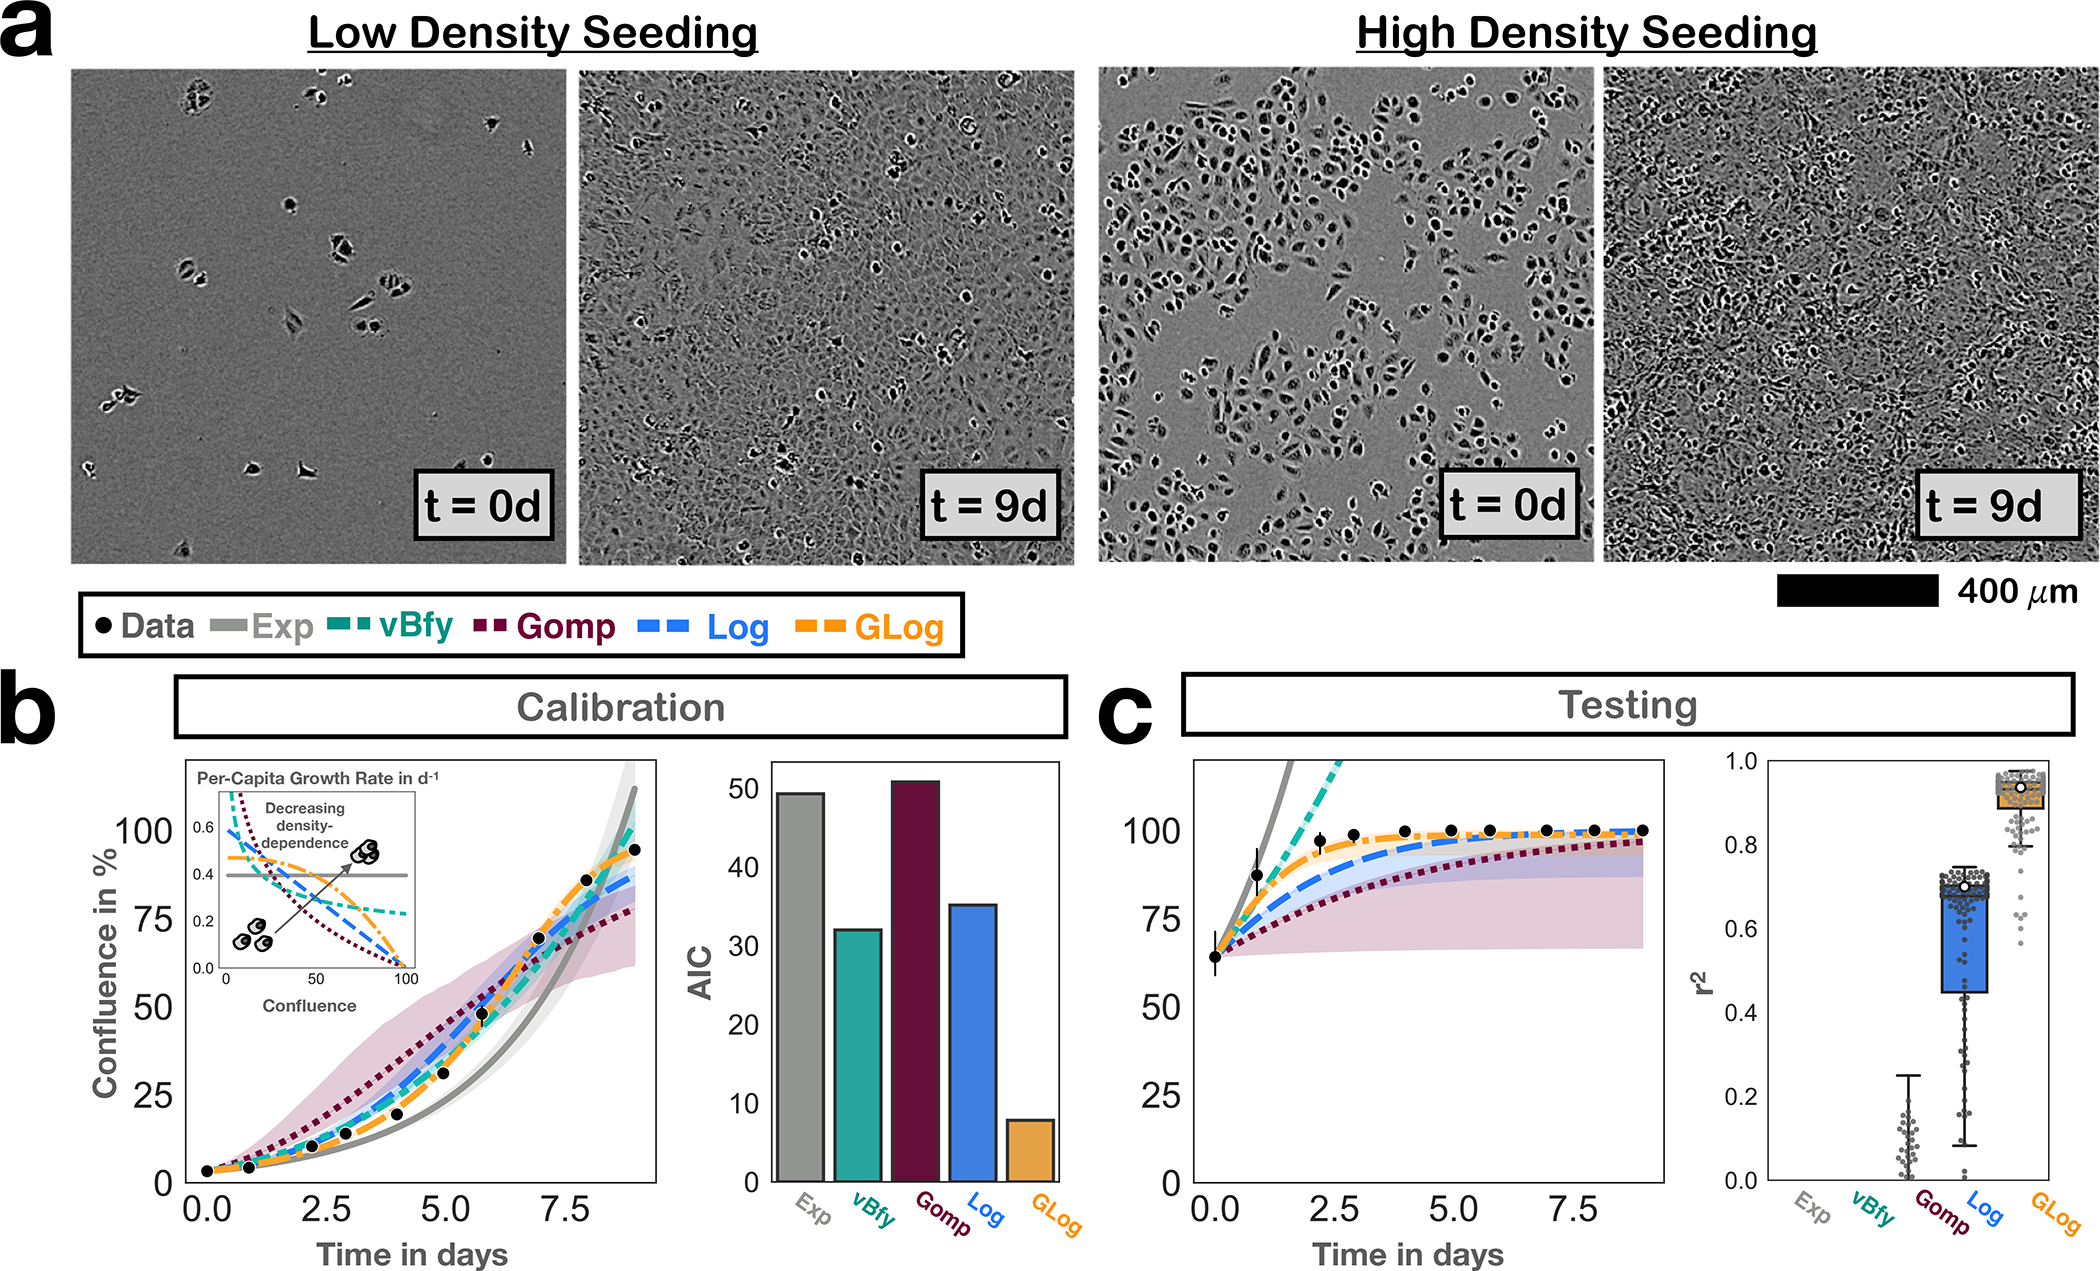
Development of the growth model to describe the population expansion in the absence of treatment. Points and bars denote mean and 95% CIs of observed confluence (n=3 independent replicates). Solid lines show the model predictions based on the maximum likelihood estimate, and bands indicate 95% CIs. a) Representative Incucyte microscopy images based on which we assessed the growth and treatment dynamics over time. b) Comparison of the descriptive ability of 5 commonly used growth models in fitting the untreated growth data from cells seeded at low density (Exp: exponential; vBfy: von Bertalanffy; Gomp: Gompertz; Log: Logistic; GLog: Generalized Logistic; see Section 2.6. for equations; AIC: Akaike Information Criterion). The GLog model achieves the best fit, even if its additional parameter is taken into account (lowest AIC score). c) Testing of the growth models by comparing their predictions for when cells are initially seeded at 60% confluence with the experimentally observed dynamics. This shows that the GLog model is also the most predictive model, and corroborates our choice of this growth model. The box, center line, and whiskers denote the inter-quartile range, median, and 1.5x inter-quartile range, respectively (250 bootstrap replicates; grey dots show a random subset of 125 individual bootstrap replicates). White dots show the performance of the maximum likelihood fit. For clarity, extremely poor predictions (negative r2 values) are not shown.
In vivo experiments
One week before inoculation with tumor cells (5 × 10⁶ OVCAR3 cells, subcutaneously), animals were assigned to one of the following four treatment arms (Supplementary Figure S2): 1: Control group, treated with vehicle (DMSO) intraperitoneally. 2: MTD group, treated with PARPi (Olaparib), 100 mg/kg intraperitoneally, three times per week. 3: AT1 group, which was treated with PARPi (Olaparib) by the AT1 algorithm (dose modulation; see below). 4: AT2 group, which was treated with PARPi (Olaparib) by the AT2 algorithm (dose skipping; see below). Tumor growth was monitored every other day and tumor size was measured by calipers three times a week (Monday, Wednesday, Friday). These measurements were used to inform the dose choices under AT1 and AT2 at these times. Tumor volume was calculated using the following formula: volume = π (short diameter)2 × (long diameter)/6. When the tumor volume reached 200 mm2, treatment was started. Animal weights were measured and recorded twice weekly, and the overall health of each animal was noted to ensure timely end points within the experiment. Animals were humanely killed upon progression (tumor size >1500mm2), and the experiment was ended when half of the animals in a treatment arm had progressed.
Adaptive therapy with dose modulation (AT1):
Given the observed delay in treatment response, all animals were initially treated every other day for at least 5 days before dose modulation was started (100mg/kg). As soon as the tumor stopped growing, the subsequent treatment dose was reduced to 50% of the original dose. When the tumor started growing again (any measurable growth from the previous time point), we applied the original dose again and if the tumor stayed under control we reduced the dose by another 50% (Supplementary Figure S2). To account for errors in the caliper measurements we allowed for a 10% lee-way in the decision-making.
Adaptive therapy with treatment skipping (AT2):
Treatment started at MTD (100 mg/kg) for at least 5 days, and subsequently continued until the tumor stopped growing (no measurable growth from the previous time point). As soon as tumor size growth stopped or reduced, we skipped the next treatment. Treatment started again as soon as the tumor started growing as measured by caliper (Supplementary Figure S2). To account for errors in the caliper measurements we allowed for a 10% lee-way in the decision-making.
Mathematical model development
The aim of our mathematical model was to describe and predict the tumor population size over time in response to different treatment schedules (as measured by the percentage of the well covered by cells, which we will refer to as confluence). Given the continuous nature of the confluence measurements, we chose to model the population dynamics using ordinary differential equations (ODEs), such that N(t) (in % confluence) represents the confluence at time t (in days). We developed our model in three consecutive steps (Figure 1b): Firstly, we identified terms to describe untreated growth (Figure 2). Next, we characterized the dynamics in response to continuous treatment at 100μM Olaparib (Figure 3), and lastly, we extended this model to cover the response at several different drug doses: 10, 50 and 100μM (Figure 4). At each step, we compared different plausible models and picked one to carry forward to the next step (see Table 1 & Supplementary Table S1 for an overview of model parameters and fitting steps). This approach not only increased confidence in our final model choice, but also was an important step to help elucidate underlying biology by ruling out hypotheses that were inconsistent with the data.
Figure 3.

Mathematical modeling of the PARPi treatment response indicates that cells can undergo multiple divisions before entering PARPi-induced cell cycle arrest. Points and bars denote mean and 95% CIs of observed confluence (n=3 independent replicates). Solid lines show the model predictions based on the maximum likelihood estimate, and bands indicate 95% CIs derived via parametric bootstrapping (250 bootstrap replicates). a) Treatment response dynamics and representative images measured with our in vitro imaging setup, showing a delayed response where the population initially expands under treatment before it contracts. b) A simple model which assumes PARPis induce cell cycle arrest immediately once a cell attempts to divide cannot explain this initial expansion seen in the data (Model 1; Equations (1)–(4)). c) A more complex model in which cells need to acquire PARPi-induced damage over multiple rounds of cell division can explain the dynamics under continuous treatment (Model 2; Equations (5)–(9)). Specifically, a value of 2–3 divisions before arrest appears to be most consistent with the data. However, this model predicts faster recovery upon drug withdrawal than what is seen in vitro, suggesting further refinement is required. d) To address this, we tested a model which assumes that the DNA damage that results in cycle arrest is initially induced by PARPis but is subsequently exacerbated through cell division independent of further drug exposure (Model 3; Equations (10)–(13)). This model can explain the dynamics in response to both continuous and intermittent schedules (for corresponding fits/predictions see Supplementary Figure S4b). Assuming that cells rarely recover from arrest, we were able to simplify this model whilst maintaining high fitting and prediction accuracy, which yielded the final treatment model which we carried forward for our study of treatment scheduling (Model 4; Equations (14)–(16); fits/predictions as shown).
Figure 4.

Characterizing the relationship between the treatment dynamics and the drug dose. Points and bars denote mean and 95% CIs of observed confluence (n=3 independent replicates). Solid lines show the model predictions based on the maximum likelihood estimate, and bands indicate 95% CIs derived via parametric bootstrapping (250 bootstrap replicates). a) Approach used to deduce the dose-response relationship. b) Empirical dose-response relationship derived from our data, demonstrating a concave curvature, which cannot be described by the linear dose-response model assumed in Model 4 and motivated the illustrated Hill function model (Model 5). c) Diagram showing how we extended Model 4 by assuming that the damage probability, , increases non-linearly with dose according to a Hill equation (Model 5; Equations (14)–(17)). d) Model fits obtained when calibrating Model 5 with data from 0, 10, 50 and 100μM Olaparib. e) Testing of Model 5 on data from 12 different experimental conditions. Together, Panels d & e show that Model 5 can fit and predict the PARPi response of OVCAR3 cells in vitro under various conditions with high accuracy, including the fact that the treatment response varies with cell density.
Table 1.
Overview of model variables and parameters.
| Variable/Parameter | Description | Range |
|---|---|---|
| Tumor population size at t days (in % confluence) | 0–100 | |
| Size of actively proliferating population at t days (in % confluence) | 0–100 | |
| Size of proliferating population with i rounds of divisions impacted by PARPi-induced damage at t days (in % confluence) | 0–100 | |
| Size of proliferating population with (any) PARPi-induced damage at t days (in % confluence) | 0–100 | |
| Size of arrested population at t days (in % confluence) | 0–100 | |
| Drug concentration in the well at t days (inμM) | 0–100 | |
| Maximum administered drug concentration (in μM) | 100 (fixed) | |
| Cell growth rate (in day−1) | 10−4−2 | |
| Carrying capacity (in % confluence) | 0–100 | |
| Shape parameter determining curvature of density-dependence relationship (dimensionless) | 0–5 | |
| Probability of PARPi-induced cell cycle arrest during cell division when treated at (dimensionless) | 0–1 | |
| Rate at which arrested cells repair themselves (in day −1) | 0–0.5 | |
| Rate at which arrested cells undergo apoptosis and detach from the plate (in day −1) | 0–4 | |
| Growth rate, damage probability, and repair rate of sub-population with rounds of PARP-afflicted cell divisions (with units, respectively, day−1, dimensionless, day−1) | ||
| Rate at which damaged cells become arrested (in day−1) | 0–4 | |
| Average number of divisions a damaged cell undergoes before apoptosis (dimensionless) | 0–2 | |
| PARPi concentration at which half the maximum drug effect is achieved (in μM) | 0–100 | |
| Hill shape parameter determining the curvature of the dose-response relationship (dimensionless) | 0–10 |
Growth Models:
We tested 5 different, commonly-used models of untreated tumor growth representative of different assumptions about the strength of density-dependence (see also Figure 2b and Supplementary Figure S3): i) Exponential growth, which assumes no change in per-capita which assumes cells growth rate with increasing density , ii) von Bertalanffy growth50, grow as a sphere with only the cells on the surface dividing so that the growth rate scales approximately with the sphere’s surface area , iii) Logistic growth, which assumes a linear decrease in per-capita growth rate with density , iv) Gompertzian growth51, which assumes an exponentially decreasing relationship with density , and v) Generalized Logistic growth, which assumes the per-capita growth rate decays according to a power-law . Throughout, (in day−1) denotes the instantaneous growth rate, (in % confluence) is the population’s carrying capacity, and is a dimensionless shape parameter.
Treatment Models:
We assumed that the Olaparib concentration, (in μM), was homogeneous within a well and due to the regular medium replenishment could assumed to be piece-wise constant over time.
To investigate and characterize the treatment response, we examined 4 treatment models with different assumptions about the conditions required for a cell to be forced into apoptosis (note that for each model, we assume generalized logistic growth, as this was the model selected from the 5 growth models we considered). Since it takes time for cells to undergo apoptosis and detach from the plate, we divided the population into an unaffected, proliferating compartment, , and an affected, arrested compartment,
-
Model 1: During mitosis, cells in the compartment have a probability (dimensionless) to acquire PARPi-induced DNA damage, which is a function of the PARPi concentration, . If a cell is damaged, then division is immediately aborted, the cell becomes arrested and undergoes apoptosis at rate (in day−1), unless it is able to repair itself, which occurs at rate (in day−1):
(1) (2)
where for simplicity we assumed in Models 1–4 that the relationship between drug concentration and damage probability was linear:(3) (4) Here, is the maximum administered drug concentration, introduced for scaling purposes, and is the damage probability (dimensionless) when treated at .
To represent the fact that cells are most sensitive to PARPi-induced damage when they are undergoing mitosis, we assumed in Equations (1) & (2) that the rate at which cells are arrested by treatment is proportional to the population’s growth rate. The factor of 2 in Equation (1) accounts for the fact that due to the arrested division no daughter cell will be produced.
- Model 2: This model assumed that a cell needs to acquire multiple PARPi-induced lesions before arrest is induced, so that the population is composed of different proliferating sub-populations with increasing levels of DNA damage, denoted by (for ; in units of % confluence for all compartments):
(5) (6) (7) (8)
where , and are the growth rate, concentration-dependent probability of drug-induced damage, and repair rate for sub-population , , respectively. For the analyses presented in the main text of the paper, we assumed that DNA damage did not change the characteristics of the cell until rounds of damage had been acquired (i.e. , , and for all ). Additional analyses where we allowed and to vary are shown in Supplementary Figures S3–S6.(9) - Model 3: While in Model 2 continued drug exposure was required for a cell to keep accumulating DNA damage, this model assumed that the presence of drug was only necessary for induction of an initial DNA lesion. Damaged cells, (in % confluence), might then continue to divide but would become arrested at a drug-independent rate (in day−1):
(10) (11) (12)
where again we assumed a linear dose-effect relationship ( given by Equation (4)).(13) -
Model 4: This model was a simplified version of Model 3, derived by assuming that repair was negligible. In addition, this model assumed that the extra divisions a damaged cell may undergo before arrest could be summarized in a single step, so that a cell that was damaged by drug would on average give rise to (dimensionless) arrested daughter cells:
(14) (15) (16) Like Models 1–3 this model assumed that was linear (Equation (4)).
Dose-Response Model:
In the final step, we explored the relationship between dose and treatment effect. We extended Model 4 by assuming that the drug effect was non-linear, so that the damage probability in Equations (14) & (15) was given by:
| (17) |
where (in μM) was the drug concentration at which half the maximum possible effect was achieved and was a non-dimensional shape parameter. The result is the final model we carried forward for prediction-making, referred to as Model 5 (Equations (14)–(17)).
Model calibration and validation
We calibrated each model by using a Maximum Likelihood approach in which we minimized the root mean squared error (RMSE) between the model-predicted confluence, , and the experimentally observed data. Specifically, we fitted to the average of the measured confluence across the three replicates per time point. Following the three steps outlined in Figure 1b, we used data from three sets of experimental conditions to sequentially infer the parameters related to growth (, , and , treatment (, , , , and , and dose-response components of the model ( and ), respectively (Supplementary Table S1). When transitioning from one step to the next all parameters related to the prior component(s) were kept fixed. When inferring and , we fitted to data from three conditions simultaneously (continuous treatment at 10, 50, and 100μM) by minimizing the combined RMSE across the three conditions. For initial conditions, we assumed that all cells were initially in the proliferating compartment so that (or for Model 2) was equal to the observed confluence at time 0, and all other compartments were set to 0. Initial conditions were not allowed to vary during fitting (Supplementary Table S1).
To test the ability of our models to predict the treatment dynamics under unseen experimental conditions, we performed three sets of validation experiments (Figure 1b). In these, we set the initial conditions in the ODE model equal to those observed in vitro (again assuming all cells to be in the compartment), and compared the dynamics predicted by simulating the model forward with that observed experimentally. Notably, all parameters were kept fixed in these experiments.
Uncertainty quantification
Parametric bootstrapping was used to estimate the uncertainty in our parameter estimates and model predictions. To do so, we used the fitted model to simulate 250 synthetic experimental replicates, for , by sampling residuals from the error model as follows: , where is the residual and is the residual variance of the Maximum Likelihood model fit, . Here, is the sum of squared residuals of the Maximum Likelihood fit and is the number of free (fitted) parameters. Next, we fitted the model to each of the synthetic replicates using the same protocol as when fitting the real data. Unless otherwise stated, each of these optimization runs was started from a different random guess within the parameter space. This yielded a distribution of bootstrap estimates for the model parameters and model predictions, from which we derived the presented confidence intervals. To propagate the uncertainty when proceeding from estimating the growth (, , and ), to the treatment (, , , , and ), and subsequently the dose-response parameters ( and ), we applied the following protocol: for each bootstrap replicate , we set the fixed parameters to the values obtained in ith bootstrap during the step in which we estimated these parameters. For example, the value of in the 1st bootstrap for Models 1–5 was taken from the 1st bootstrap when estimating from fitting to the growth data in Step 1 of the model development process. The reason why we chose a parametric method rather than a more assumption-agnostic, non-parametric method was that we only had three replicates available per experimental condition. We also tested uncertainty estimation using the delta-method52, which yielded comparable results (Supplementary Figure S7).
Numerical methods
All data analyses, model fitting and simulations were carried out in Python 3.8. Specifically, we used the DOP853 explicit Runge-Kutta method in scipy 1.6.2 to solve the ODEs, and the lmfit package53 (version 1.0.2) and the Levenberg-Marquardt algorithm implemented in the least_squares method in scipy to carry out model fitting. Visualizations were produced with Pandas 1.2.4, Matplotlib 3.5.2, and Seaborn 0.11.1. All code is available at: https://github.com/MathOnco/PARPi_Model.
3. Results
The aim of this paper was to investigate the feasibility of alternative treatment schedules for Olaparib which maintain or even enhance tumor control but reduce drug use. To do so, we performed a series of in vitro experiments to develop, calibrate, and validate a mathematical model of the treatment response dynamics (Figure 1b). Subsequently, we explored implications for scheduling, showing that dose modulation-based adaptive therapy is more effective and robust at reducing drug use in this setting than dose-skipping. We repeated our analysis on two commonly used human epithelial ovarian cancer cell lines (OVCAR3 and OVCAR4). These were originally derived from ascites and were chosen to model experimentally the peritoneal disease that PARPi maintenance seeks to manage. Furthermore, we generally started our experiments and simulations from low density populations (5–20% confluence) to reflect the small tumor burden at the start of treatment. As both cell lines yielded similar results, we focus on OVCAR3 and refer to the supplementary material for the OVCAR4 results.
3.1. Untreated cells growth dynamics indicates non-linear density dependence
The cytotoxic effect of PARPis is based on their interference with the DNA replication machinery and the induction of double strand DNA breaks. We therefore first analyzed the growth dynamics of OVCAR3 cells in the absence of treatment in order to accurately capture the fraction of dividing cells over time. Using time-lapse microscopy and image analysis, we collected images daily, such as those shown in Figure 2a, and from these quantified the population size over time as a percentage of how much of the visible area was overgrown (% confluence). Subsequently, we compared the observed trajectory with five plausible and commonly used mathematical models, representing different assumptions about how rapidly the fraction of dividing cells decreased as the population approached confluence (their “density dependence”; Figure 2b; see Section 2.6. for the equations). We found that a generalized logistic model was the most consistent with the observed growth dynamics, even when we penalized for its additional parameters (Figure 2b). The corresponding concave shape of the density dependence relationship suggests reduced contact inhibition, consistent with the cancerous nature of these cells. Repeating this analysis with OVCAR4 cells showed stronger density dependence but yielded otherwise similar conclusions (Supplementary Figures S3a & b).
Next, we sought to test how well this model could predict growth under experimental conditions different to those for which we had calibrated it. Given that AT relies on cells competing in close proximity30,31,54, we chose to test the model in its ability to predict growth when we seeded cells at a higher initial density (60% confluence). This analysis corroborated our choice of the generalized logistic model, although for both cell lines it slightly under-predicted the initial growth rate of the population (Figure 2c & Supplementary Figure S3c). The parameter estimates for each cell line are summarized in Supplementary Figures S3d & e, respectively.
3.2. Even at high doses, there is a time delay before the population begins to shrink
Having characterized the cells’ growth dynamics, we turned to study their response to therapy. To do so, we exposed the cells to continuous treatment at 100μM Olaparib for 21d. This experiment revealed that, despite high-dose treatment, the population tended to initially expand before a treatment-induced regression could be observed (Figure 3a). To understand the reasons behind this delay in treatment response, and to develop a means for subsequent in silico schedule optimization, we next extended our mathematical model to capture these dynamics.
PARPis interfere with the DNA repair and replication machinery which induces cell cycle arrest, and eventually results in apoptosis if cells are unable to repair themselves (Figure 1a). Based on this understanding, we tested a model in which we assumed that the tumor population could be divided into two subpopulations (Figure 3b): i) Cells which are actively cycling and unaffected by PARPi (P), and ii) cells in PARPi-induced cell cycle arrest (A). Further, we assumed that during treatment drug caused cell cycle arrest in a fraction of cells in the proliferating subpopulation (those undergoing mitosis during this period) and thereby moved them from the to the compartment. Once arrested, these cells would either repair themselves and return to the proliferating compartment or would undergo apoptosis and detach from the plate. Seeking to keep our model as simple as possible, we initially assumed that if there was Olaparib induced damage, then the cell would immediately abort division and go into arrest (Model 1; Figure 3b; Equations (1)–(4)). Fitting this model to our data, we found that it was able to reproduce the biphasic behavior of expansion and contraction we had observed experimentally (Figure 3b). However, whilst qualitatively in agreement, the model predicted a much less pronounced initial expansion than what we had seen in vitro, suggesting that the assumption of immediate cell cycle arrest was inconsistent with our data (Figure 3b).
3.3. Modeling indicates that cells undergo 1–2 extra divisions before PARPi-induced arrest
Based on this observation, we tested a model in which we assumed that multiple divisions under PARPi exposure were required to amount sufficient damage to induce cell cycle arrest (Model 2; Equations (5)–(9)). In this model, the cell accumulated DNA damage if affected by the PARPi during mitosis but it still successfully completed cell division. Only after too many “hits” were received, was the cell forced to abort division and was pushed into cell cycle arrest (Figure 3c). In addition, cells could repair damage and for simplicity we assumed that partial damage did not alter the behavior of the cell, so that parameters were the same across all proliferating compartments, . Fitting this model, we found that assuming a cell underwent 2–3 cell divisions before it was forced into arrest, reliably reproduced the in vitro data (Figure 3c & Supplementary Figure S4a; r2 values of 0.91 and 0.9, respectively). We concluded that Olaparib-induced damage did not appear to induce arrest immediately, but that instead cell death resulted from the build-up of further damage over multiple rounds of cell division.
3.4. PARPi cytotoxicity involves both drug-dependent and drug-independent steps
Given this observation, an important follow-up question was whether treatment interruptions would interfere with the action of the drug. If cells needed to be damaged not just once, but multiple times, and the continued presence of drug was necessary to induce damage, then this would mean that withdrawal of treatment too early may not allow for enough time to induce cell death. To investigate this hypothesis, we simulated an experiment in which we treated cells for varying lengths of time (1d, 2d, 4d, 7d), after which we removed treatment. As expected, the model predicted that the population would start growing again within 24h after drug removal (Figure 3c and Supplementary Figure S4b). However, comparing these predictions with the dynamics when we repeated this experiment in vitro, we found that the recovery predicted by the model was too fast (Figure 3c and Supplementary Figure S4b). This suggested that the cells were continuing to experience the impact of the PARPi-induced damage even once treatment had been withdrawn.
To characterize the way in which the cells were impacted, we tested whether this lingering effect took the form of either a decreasing proliferation rate or an increasing drug sensitivity as damage accumulated in a cell, but neither model was able to explain the data (Supplementary Figures S4b & S5a–b). Examining why this was the case, we found that while decreasing the proliferation rate reduced the growth rate, it also reduced the cells’ drug sensitivity, resulting in a build-up of damaged, but still proliferating, cells which explained why the model predicted too fast a regrowth upon drug withdrawal (compare the levels of P1(t) in Supplementary Figure S4b). This observation prompted us to revisit our assumption that drug exposure was required for the further build-up of DNA damage after an initial PARPi-inflicted lesion. So, we iterated testing with a refined model in which cells continued to divide after PARPi damage but eventually underwent apoptosis independent of further treatment, unless they had been able to repair themselves (Model 3; Figure 3d; Equations (10)–(13)). This model was able to recapitulate the treatment response under continuous, as well as intermittent, treatment with high accuracy, suggesting that PARPi-induced cytotoxicity involved both drug-dependent and drug-independent steps, as might be expected from PARP trapping, where the PARPi locks onto a lesion site and prevents repair (Supplementary Figures S4b & S5a–b). Repeating these analyses with the OVCAR4 cells corroborated this result (Supplementary Figure S6a–c) and adds support to the growing evidence for the importance of PARP trapping in PARPi action.
3.5. A slow repair rate simplifies the model needed for prediction-making
Having investigated how PARPis damage cells, we turned to consider the question of the rate of repair. Examining the estimates for provided by Models 1–3 for both cell lines indicated that little repair appeared to be taking place (Supplementary Figures S5c & S6d). This observation not only provided further biological insight, but also suggested a way of simplifying our model. While Model 3 was useful for gaining a mechanistic understanding of the actions of Olaparib, its complexity meant that it was difficult to parameterize it with the data at hand, seen, for example, in the notable uncertainty associated with the sizes of the individual subpopulations (Supplementary Figure S4b). By neglecting repair, we were able to reduce our model back to two populations, consisting of healthy proliferating cells, , and arrested cells on the way to apoptosis, . In this way, the transient rounds of cell division following PARPi-induced damage could be combined into a single step, where a new parameter captured the number of divisions a damaged cell would undergo before cell cycle arrest (Model 4; Figure 3d; Equations (14)–(16)). For both cell lines, this model provided fits and predictions as good as, if not better than, the more complex Model 3, with less uncertainty in its predictions and parameter estimates (Figure 3d & Supplementary Figures S5 & S6).
3.6. Analysis of the response at different doses reveals positive cooperativity in drug action
In the last step of model development, we sought to characterize how the treatment dynamics varied with drug dose (Figure 1b). This was so that we could subsequently use the model to investigate treatment algorithms which adapted not just whether or not treatment was given, but also adjusted the dose. To do so, we first used our in vitro time-lapse imaging pipeline to measure the response dynamics of cells continuously exposed to 1, 10, 25, and 50μM of Olaparib for 9 days. We then fitted Model 4 to each drug level, allowing the treatment-induced damage probability, , to vary freely with dose (Figure 4a). This analysis revealed a concave dose-response relationship for , indicating that the dose relationship was not linear, as we had assumed in Model 4, but that there was evidence for positive cooperativity in PARPi action (Figure 4b). We concluded that acquiring a PARPi-induced lesion appeared to increase the probability that a cell would suffer further PARPi-induced damage. We also explored whether or varied with dose but did not find evidence to support this (Supplementary Figures S8a & b).
To integrate this positive cooperativity into our mathematical model, we extended Model 4 by introducing a Hill function to describe the relationship between the dose and the treatment-induced damage probability, (Model 5; Figure 4c; Equations (14)–(17)). After calibrating the shape parameter, , and half-effect parameter, , using the data at dose levels 10, 50 and 100μM we found that this model was able to closely recapitulate the experimentally observed drug-response relationship (Figure 4b), as well as the associated treatment dynamics (Figure 4d; see Figure S8c & d for a summary of the parameter estimates). Repeating this analysis with a different set of “training” doses (e.g. 1, 25, 100μM; not shown) and with OVCAR4 (Supplementary Figures S9a & b) corroborated our conclusions.
3.7. The model is highly predictive and reveals that drug response changes with cell density
To validate the final form (Model 5) of our mathematical model, we tested its ability to predict the treatment dynamics under combinations of different conditions (varying doses, seeding densities, and continuous vs intermittent schedules). We found that for both cell lines our model was able to predict the observed dynamics with high accuracy (Figure 4e and Figures S8d & S9c–f; see Figure S9g for the OVCAR4 parameters). In particular, our mathematical model predicted that the cells would recover quickly after drug withdrawal and would experience a certain protection from treatment when grown at higher density. These predictions were validated in vitro (Figure 4e) and suggested that how, and when, treatment was adapted would have to be carefully planned. Thus, in the final part of this study, we leveraged our calibrated and validated mathematical model to study different possible adaptive treatment strategies.
3.8. Model simulations of different adaptive therapy algorithms indicate dose modulation may perform better than dose skipping
In the prostate cancer adaptive therapy trial by Zhang, et al.42,55, the authors alternated between drug administration and drug holidays to keep tumor size between the baseline value at the start of treatment and 50% of this value (as measured by PSA). However, PARPi maintenance therapy immediately follows systemic therapy and possibly surgery or radiation therapy, so that there is typically little or no evidence of remaining disease at the start of treatment10,14, making a strategy similar to that of Zhang, et al.42,55 difficult to implement. As an alternative, we investigated two previously published adaptive algorithms which adjust treatment based, not on tumor size, but on changes in size (Figure 5a): i) AT127,34, which modulates the dose administered at the current time point, increasing it if the tumor grows too quickly and decreasing it if tumor growth slows sufficiently, and ii) AT234, which performs dose-skipping akin to Zhang, et al.42,55, except that doses are skipped when the growth rate drops below some threshold. In this way, these algorithms could be deployed even when no tumor is visible and/or CA-125 levels are “normal”, since decisions can be made based on the rate of change of the CA-125 levels. To make these algorithms easier to implement we made two simplifications compared to Enriquez-Navas et al34: for AT1 we selected from one of only five dose levels (0, 12.5, 25, 50, 100μM), separated by factors of , and for AT2 we assessed growth rate over one-step rather than two-step intervals (Figure 5a).
Figure 5.

Mathematical modeling and in vivo experiments suggest that adaptive treatment strategies can be used to de-escalate therapy, but that doses should be modulated rather than skipped. a) Two candidate adaptive therapy algorithms, modified from Enriquez-Navas, et al.34 used as starting points for the development of a PARPi-specific strategy. Both adjust treatment based on the tumor’s growth rate, but differ in how these adjustments are made: AT1 modulates the dose, whereas AT2 will completely skip treatment. b) Simulations using Model 5 showing that adaptive dose modulation (AT1) can control tumor growth whilst using less drug than continuous therapy, but that under adaptive skipping (AT2) the tumor can escape. Parameters: , ; AT1: , , , , . Treatment interval: 3d. Solid lines and drug levels (pink bars) show the model predictions based on the maximum likelihood estimate, and bands indicate 95% CIs derived via parametric bootstrapping (250 bootstrap replicates). c) Mean drug dose administered per treatment interval in the simulations in b). The bars show the maximum likelihood predictions. The box-and-whisker plots and grey dots illustrate the distribution across 250 bootstrap estimates. The box, center line, and whiskers denote the inter-quartile range, median, and 1.5x inter-quartile range, respectively (dots show a random subset of 125 individual bootstrap replicates). d) Representative examples of mice treated with the different strategies from Panel b), illustrating how treatment is dynamically adjusted (see Figure S10 for all individual trajectories). e) Average weekly tumor growth data across all four cohorts, confirming the model predictions that adaptive modulation (AT1) can achieve comparable tumor control to continuous therapy (n=6 animals per group). Large points and error bars denote the mean size and 95% confidence intervals for each treatment arm, respectively (note: one animal in the CT group was found dead after 3w and thus excluded from these calculations). Small points indicate individual measurements. All measurements were taken at the same time, but to enhance readability, data are displayed with a small offset along the x-axis. Inset: Mean Olaparib dose administered per treatment interval, showing that adaptive therapy can significantly reduce cumulative drug use (two-sided t-test statistics: * p<0.05, **:p<0.01). The box, center line, and whiskers denote the inter-quartile range, median, and 1.5x inter-quartile range, respectively. Bars mark the mean across the treatment group.
Using our mathematical model, we tested whether these strategies could reduce drug use whilst maintaining control over the tumor. Our simulations showed that by gradually up- and down-titrating the dose, AT1 has two advantages over AT2: 1) AT1 can keep the tumor in check, and 2) AT1 can reduce the cumulative dose by 55% relative to continuous treatment (Figures 5b & c). In contrast, under AT2 the tumor was predicted to expand rapidly, even at a higher cumulative dose (65% relative to CT). In addition, for both protocols the model predicted considerable variability in the possible trajectories over time, indicating that even small differences in the values of tumor parameters, or treatment timing, could potentially result in distinct outcomes (Figure 5b).
To test these predictions empirically, we attempted to repeat these experiments in vitro, but found that it was not possible to culture cells for multiple treatment cycles in the same dish without replating (not shown). Thus, we moved to an in vivo setting which provided confirmatory evidence that adaptive dose modulation (AT1) can greatly reduce drug use whilst inhibiting tumor growth as well as continuous MTD treatment (Figures 5d–e). In contrast, dose skipping (AT2) also reduced cumulative drug use, but resulted in poorer outcomes (Figure 5d–e), with 3 animals developing particularly rapid disease progression (Figure 5d “responder” vs “failure”; for all individual trajectories, see Figure S10; note: to simplify experiments, we only used four dose levels for AT1: 0, 25, 50, ).
3.9. Curvature of the dose-response relationship explains why dose modulation is better than skipping for reducing cumulative dose
How can we explain the difference in performance between adaptive dose modulation and skipping? To address this question, we considered two fixed (non-adaptive) versions of these protocols: i) a flat dose reduction where we treat continuously at a fixed, lower dose, and ii) intermittent dose skipping where we reduce cumulative dose by skipping treatment at fixed intervals. Using our mathematical model, we simulated treatment for 180d, and tested how the final tumor size changed as we reduced the total amount of treatment administered (Figure 6a). Our results show that both approaches can be used for small total dose reductions. However, when de-escalating therapy by more than 30% only a dose reduction approach can continue to maintain tumor control, recapitulating the difference between AT1 and AT2 (Figure 6a).
Figure 6.

The shape of the dose-response relationship determines by how much and by what means (modulation vs skipping) treatment can be de-escalated, which supports the use of adaptive dose modulation to tailor treatment de-escalation to the patient-specific dose-response curve. Solid lines and drug levels (pink bars) show the model predictions based on the maximum likelihood estimate, and bands indicate 95% CIs derived via parametric bootstrapping (250 bootstrap replicates). (a) Systematic comparison of reducing cumulative dose through either continuous treatment at a reduced dose (dose reduction), or by skipping doses (spread across 5–25 breaks across the treatment period). For small reductions either strategy is possible, but for further de-escalation only dose reduction can still control the tumor, as exemplified in the simulations (right). Parameters: , . (b) Comparison of the rate of DNA damage induced when de-escalating treatment by either 10% or 50% in the simulations in Panel a. As long as the damage rate exceeds 0.5 tumor growth is inhibited. Due to the concave curvature of dose-response relationship, (orange line), which we inferred in Section 3.6. the damage induced when reducing the dose but treating continuously (green circle) is always higher than that when skipping doses (pink square). Thus, dose reduction can de-escalate therapy more effectively than dose skipping. (c) Treatment dynamics are very sensitive to the tumor’s dose-response relationship, which motivates personalizing treatment de-escalation via adaptive therapy. While continuous treatment at MTD can control all three cases, it misses opportunities for therapy de-escalation in more sensitive tumors. However, a population-wide dose reduction risks under-treating less sensitive patients. By adjusting to the tumor’s response dynamics, an adaptive dose modulation approach can help to better tailor the amount of treatment required for a specific patient. For the base case parameter fits were taken from OVCAR3 cells (Supplementary Figure S8c). AT1 parameters: . Treatment interval: 30d.
Next, we investigated what causes this difference. One plausible hypothesis was that skipping fails because the tumor grows to higher densities during treatment breaks which makes it more resistant to the subsequent round of treatment. To test this, we varied the number of breaks during treatment skipping and found that it had little impact on the results (Figure 6a; see also Figure S11a). Subsequently, we leveraged the mechanistic nature of our model to ask if a specific aspect of the drug response dynamics was responsible. Carrying out a parameter sensitivity analysis, in which we systematically varied each parameter in turn we found that the difference between the two strategies was primarily driven by the parameters , and which determine the treatment-induced damage probability at a given dose level, , as well as by the tumor growth rate (; Figure S11b).
Thus, we can explain both by how much and by what means (dose reduction or skipping) we can de-escalate treatment. Figure 6b illustrates the rate of DNA damage in the simulations that we inflict on the tumor as a function of dose. During dose reduction the mean rate of damage directly follows the relationship, , we derived in Section 3.6. (orange curve), whereas during skipping, the average rate of damage is linearly proportional to the time spent under MTD treatment (black line). When we reduce the dose by 10% then both protocols damage on average more than 50% of dividing cells, so that the tumor shrinks and is, thus, controlled (Figure 6b). However, due to the concave curvature of the dose-response relationship, , when we seek the greater dose reduction of 50%, only continuous treatment can maintain sufficient cell kill whereas the average cell kill under skipping is insufficient to stop tumor growth (Figure 6b; for an example of the dynamics in case of a convex , see Supplementary Figures S11c & d). In fact, using this argument, we can derive analytic expressions for the de-escalated dose level up to which either approach can be used:
and for the theoretical minimum to which the dose could be lowered so that the tumor would still shrink (assuming continuous treatment and a concave relationship):
| (18) |
The so-calculated values for and agree well with our numerical simulations (Figure 6a).
3.10. Adaptive therapy enables personalized dose reduction
Currently, the treatment plan for PARPi maintenance is adjusted only in case of toxicity or progression. However, our results indicate that the amount of drug required to control a patient’s tumor depends closely on the characteristics of that tumor’s dose-response relationship, and thus can vary notably between patients. To illustrate this point, we simulated three “virtual patients” which are identical except for some small heterogeneity in (Figure 6c). Continuous treatment at the maximum drug concentration achievable in human plasma (22 μM), can control the tumor in all three cases, but over-treats two of them (D2<22 μM for Patients 1 & 2). At the same time, this heterogeneity also means that de-escalating dose using a “one-size-fits-all” strategy across the whole cohort is challenging: for example, when treat at a 17% lower dose (the initial reduction foreseen in case of toxicity), the tumor control in Patients 1 & 3 is much poorer (Figure 6c). These simulations show that in order to avoid potentially under-treating less sensitive tumors we are forced to treat at the MTD.
We propose that adaptive therapy provides a tool to better tailor the amount of drug given to an individual patient by integrating the tumor’s dynamics into the decision-making. To illustrate this point, we treated the same three patients with a modified form of AT1 that uses the dose levels already available in the clinic to manage toxicity ([MTD, 83% MTD, 67%MTD]), and that revisits the treatment plan on a clinically feasible, monthly timescale (30d). By switching to a higher dose when the tumor grows, and decreasing it otherwise, this strategy can achieve final tumor sizes that are comparable to that of MTD continuous therapy, whilst seizing the opportunities for dose reductions in the more drug-sensitive patients (Patients 1 & 2, Figure 6c).
4. Discussion
PARPis are promising to revolutionize ovarian cancer care, but toxicity, financial costs, and drug resistance mean that not all patients benefit equally, and often improvements are only temporary. Recent results in androgen-deprivation treatment of prostate cancer have shown that by adapting treatment to the treatment response of the individual patient, it may be possible to delay progression and reduce drug use42,55. While the rationale behind adaptive therapy is to delay resistance by leveraging competition between sensitive and resistant tumor populations, in this study we focused solely on the dynamics of sensitive cells. We did so for two reasons: firstly, this is the dominant population at the start of treatment, and any adaptive therapy protocol will need to ensure that we can control this population before we can evaluate potential benefits in inhibiting resistance. Secondly, by integrating the tumor’s response dynamics into the decision-making, adaptive therapy also allows patient-specific treatment tailoring that better reflects the amount of drug required to control a particular patient’s disease. As such, our study contributes to the development of adaptive therapy by exploring a new clinical setting (Olaparib maintenance therapy of ovarian cancer), and by investigating it explicitly as a tool to reduce drug use to mitigate pharmacological and financial toxicity.
We proceeded by developing a mathematical model with which we could characterize the processes driving the treatment response dynamics over time and with which we could, relatively cheaply, test different plausible adaptive algorithms. To the best of our knowledge, our model is the first mechanistic mathematical model of PARPi treatment in the literature, and it was systematically derived from, and validated with, in vitro experimental data. Using our model, we asked whether Olaparib maintenance should be adapted by judiciously skipping doses or by dynamically modulating the dose level? We found, first in simulations, and subsequently in in vivo experiments, that there can be a considerable difference in outcome between both approaches and that the modulation-based approach should be preferred. Leveraging the mechanistic nature of our mathematical model, we showed that the reason for this difference is the shape of the relationship between dose and the drug effect that we had deduced from the in vitro experiments. The concave nature of this relationship implies that the intermediate doses administered during dose modulation suppress tumor growth on average more than the more intense, but also shorter, periods of treatment at MTD during dose-skipping. Our conclusions are consistent with the wide therapeutic window of Olaparib observed clinically8,17,20, and prior observations about the superiority of a modulation-based approach31,34. In these studies, the better performance of modulation-based adaptive therapy was linked to its impact on the spatial architecture of the tumor31 and remodeling of the environment34. We have shown that the pharmacologic response must also be considered. Moreover, our argument is in principle generalizable to other measures of “response” (e.g. changes in spatial architecture) and may provide a conceptual framework to integrate the effects of adaptive therapy on different time and spatial scales to guide decisions on the most effective strategy. We encourage further study of so-called “second-order” treatment effects caused by non-linear dose-response relationships56.
Every cancer has a unique evolutionary history and as a result differs in its sensitivity to treatment. However, while inter-patient heterogeneity is a well-accepted fact, currently treatment is adjusted only in case of toxicity or progression. Using our model and clinically feasible time scales and doses, we provided a proof-of-principle that by reducing dose when we see the tumor respond, it is possible to de-escalate therapy to better reflect the level that is required to control a patient’s disease.
At the same time, our work uncovered several challenges that should be addressed in the next step of protocol development. Firstly, there was a delay in the drug response, which meant that even when treated continuously at a relatively high dose of 100μM (the physiological dose is around 20μM17) it would take around 7 days before the population would begin to recede. Through our integrated modeling approach, we systematically evaluated different plausible mechanistic explanations for this delay, which suggested that despite acquiring PARPi-induced DNA damage, cells underwent 1–2 further rounds of cell division before cell cycle arrest was induced. Delays in Olaparib response in vitro have been reported also by others, reflected, for example in assessments of Olaparib efficacy after 5–10 days rather than the more conventional 3 days60,61. Our study offers a quantitative and mechanistic understanding of Olaparib response dynamics. It underscores the importance of judiciously selecting the time point for evaluating Olaparib efficacy and provides a toolkit to facilitate this decision. Future work should test whether this time point changes over multiple on/off cycles, and how to integrate this knowledge into an adaptive protocol.
Secondly, in Figure 5 we observed considerable variation in the predicted treatment dynamics under adaptive therapy, indicating that the frequency at which decisions are made and the specific thresholds used to drive decision-making need to be further optimized. The challenge in doing so is that these parameters need to be tailored to the time scale of the tumor response dynamics, i.e. ideally, they in-turn should also be “adapted”. As a first step, it might be possible to use mathematical models and longitudinal burden data to identify those patients for whom treatment can be de-escalated, as, for example, demonstrated by the CA125-based KELIM statistics57, or the PSI metric for radiation58,59. Building on this idea, we have recently proposed a way in which the parameters of the skipping-based algorithm by Zhang et al42 could be personalized by using mathematical modeling and deep learning, using data collected during an initial set of adaptive therapy “probing cycles”60. It would be interesting to investigate how this concept could be extended to modulation-based strategies and how to quantify and improve the robustness of adaptive therapy more generally37,61.
Finally, we observed that more densely seeded cells appeared to experience protection from treatment. In support of this observation, others62 have found that spheroid cultures are more resilient to Olaparib treatment than 2-D cell culture, and we hypothesize that this is due to fewer opportunities for cell division in denser cultures. While in the maintenance setting tumor burden is small, which is why we have generally considered lower density cultures/populations in this paper, cancer cells could still find themselves in locally dense environments due to normal tissue constraints. If confirmed in patients, density-dependent drug sensitivity might therefore limit the maximum tumor burden we could maintain and thereby limit the competitive suppression we can exert on any resistant cells. More generally, our results about the limitations as to when and how we can reduce treatment send a new and important cautionary note: in most adaptive therapy studies so far, we have had, or have assumed, full control over the sensitive cells33,63,64, but this may not always be the case.
There are a number of limitations to our work. Firstly, while we have discussed how to reduce drug use, this does not necessarily mitigate toxicity, since side effects may also still occur at lower doses. To address this, one could couple our mathematical model of the tumor pharmacodynamics with models of normal tissue response (e.g. 65,66). Similarly, our assumption that the dose remains constant between treatment changes should be replaced with more accurate models of Olaparib pharmacokinetics 67. Secondly, whilst we did partially validate our results in vivo, most of our conclusions are based on 2-D in vitro experiments. There are limitations to such an experimental model: i) growth medium changes to vary drug dose can confound measurements by mechanically disturbing the cells or due to incomplete drug wash-out, ii) cell-cell interactions and nutrient dynamics are limited compared to 3-D, and iii) key elements of the tumor microenvironment are missing, such as endothelial or immune cells. While we provided initial in vivo validation to begin addressing these limitations, we note that our immunodeficient and subcutaneous animal model is still a highly simplified representation of the real tumor environment during PARPi maintenance therapy. Future research should extend our work to more realistic systems, such as orthotopic intraperitoneal mouse models, treated through oral gavage rather than intraperitoneal injection. In addition, such work should study how the treatment dynamics might be modified by the chemotherapy that precedes PARPi maintenance.
Finally, it will be key to extend our work to include drug-resistant cells and determine whether, or not, our proposed adaptive regimen can delay progression. It is intriguing that only about half of the animals performed poorly under dose-skipping in the in vivo experiments. One explanation could be that these tumors were intrinsically less sensitive, so that the cumulative dose administered was insufficient to control tumor growth (akin to the scenario illustrated in Figure 6b). Alternatively, it is plausible that resistance developed during therapy. Future research should test these hypotheses by performing ex vivo drug sensitivity testing and should measure the ecological interactions between sensitive and resistant cells68.71,72
To summarize, we have presented a systematic analysis of the treatment dynamics during PARPi therapy in ovarian cancer. By closely integrating experiments and mathematical modeling we were able derive insights into the underlying biology and build confidence in our final model. We have intentionally reported the iterative nature of this process, to emphasize that the strength of modeling is not only to rule-in hypotheses (“good fits”) but also to rule them out (“bad fits”). Our work demonstrates how adaptive therapy might be used as a tool to reduce drug use and mitigate toxicity in Olaparib maintenance therapy and provides the groundwork for future research on delaying resistance. With the growing use of PARPis in other cancers, such as prostate and breast cancer, we believe that our results may be of interest more broadly, and we encourage further exploration of adaptive scheduling as a means for patient-specific toxicity and resistance management.
Supplementary Material
Key resources table.
| REAGENT or RESOURCE | SOURCE | IDENTIFIER |
|---|---|---|
| Antibodies | ||
| Bacterial and virus strains | ||
| Biological samples | ||
| Chemicals, peptides, and recombinant proteins | ||
| Olaparib | LC laboratories | Cat# O-9201 |
| Critical commercial assays | ||
| Deposited data | ||
| Confluence vs time data obtained from processing microscopy images | This paper | Zenodo: https://zenodo.org/doi/10.5281/zenodo.10718199 |
| Longitudinal volume data from in vivo experiment | This paper | Zenodo: https://zenodo.org/doi/10.5281/zenodo.10718199 |
| Experimental models: Cell lines | ||
| Human: OVCAR3 cells | ATCC | HTB-161 |
| Human: OVCAR4 cells | ATCC | CVCL_1627 |
| Experimental models: Organisms/strains | ||
| Mouse: NOD scid gamma (NSG) | The Jackson Laboratory | IMSR_JAX:005557 |
| Oligonucleotides | ||
| Recombinant DNA | ||
| Software and algorithms | ||
| Incucyte Zoom Analysis Software | Essen Bioscience | |
| Anaconda Python (Python Version 3.8.) | Anaconda Inc. | https://www.anaconda.com/ |
| Model calibration and validation pipeline using parametric bootstrapping for uncertainty estimation | This paper | https://zenodo.org/doi/10.5281/zenodo.10718199 |
| Other | ||
| Incucyte Zoom Real-Time Microscopy System | Essen Bioscience | |
Highlights:
Adapting to tumor dynamics could de-escalate PARPi maintenance in ovarian cancer.
Via theory-experiment iteration we develop a math model for schedule optimization.
Model selects modulation over skipping due to kill delay and diminishing dose response.
Adaptive modulation halves drug use relative to continuous treatment in vivo.
Acknowledgements
We would like to thank Samantha Byrne and Punit Borad for their assistance with the experiments, and three anonymous reviewers for their detailed and helpful feedback. The authors gratefully acknowledge funding by the National Cancer Institute via the Cancer Systems Biology Consortium (CSBC) U01CA232382 (supporting M.S., M.R.-T., B. G., A.R.A.A), and support from the Moffitt Center of Excellence for Evolutionary Therapy. This work is partly supported by NCI grants: R01CA249016–01, R01CA272601–01, and U01CA261841–01.
Footnotes
Declaration of Interests: M.S. is now a postdoctoral research fellow at the Cleveland Clinic, OH, but all work presented in this article was conducted at the H Lee Moffitt Cancer Center & Research Institute. R.M.W. reports grants and consulting fees from Merck, consulting fees from Tesaro/GSK, consulting fees from Genentech, consulting fees from Legend Biotech, grants and consulting fees from AbbVie, grants and consulting fees from Astrazeneca, consulting fees from Novacure, consulting fees, grants and stock from Ovation Diagnostics, honoraria from Clovis Oncology, consulting fees and grants from Eisai, consulting fees from Seagen, consulting fees from Shattuck Labs, consulting fees from Immunogen, and consulting fees and grants from Regeneron (all outside the submitted work). All other authors declare no competing interests.
Publisher's Disclaimer: This is a PDF file of an unedited manuscript that has been accepted for publication. As a service to our customers we are providing this early version of the manuscript. The manuscript will undergo copyediting, typesetting, and review of the resulting proof before it is published in its final form. Please note that during the production process errors may be discovered which could affect the content, and all legal disclaimers that apply to the journal pertain.
References
- 1.Tangutoori S, Baldwin P, and Sridhar S (2015). PARP inhibitors: A new era of targeted therapy. Maturitas 81, 5–9. 10.1016/j.maturitas.2015.01.015. [DOI] [PubMed] [Google Scholar]
- 2.Franzese E, Centonze S, Diana A, Carlino F, Guerrera LP, Napoli MD, Vita FD, Pignata S, Ciardiello F, and Orditura M (2019). PARP inhibitors in ovarian cancer. Cancer Treat. Rev. 73, 1–9. 10.1016/j.ctrv.2018.12.002. [DOI] [PubMed] [Google Scholar]
- 3.Noordermeer SM, and Attikum H van (2019). PARP Inhibitor Resistance: A Tug-of-War in BRCA-Mutated Cells. Trends Cell Biol. 29, 820–834. 10.1016/j.tcb.2019.07.008. [DOI] [PubMed] [Google Scholar]
- 4.D’Andrea AD (2018). Mechanisms of PARP inhibitor sensitivity and resistance. DNA Repair 71, 172–176. 10.1016/j.dnarep.2018.08.021. [DOI] [PubMed] [Google Scholar]
- 5.Farmer H, McCabe N, Lord CJ, Tutt ANJ, Johnson DA, Richardson TB, Santarosa M, Dillon KJ, Hickson I, Knights C, et al. (2005). Targeting the DNA repair defect in BRCA mutant cells as a therapeutic strategy. Nature 434, 917–921. 10.1038/nature03445. [DOI] [PubMed] [Google Scholar]
- 6.Bryant HE, Schultz N, Thomas HD, Parker KM, Flower D, Lopez E, Kyle S, Meuth M, Curtin NJ, and Helleday T (2005). Specific killing of BRCA2-deficient tumours with inhibitors of poly(ADP-ribose) polymerase. Nature 434, 913–917. 10.1038/nature03443. [DOI] [PubMed] [Google Scholar]
- 7.Permuth-Wey J, and Sellers TA (2009). Epidemiology of ovarian cancer. Methods Mol. Biol. 472, 413–437. 10.1007/978-1-60327-492-0_20. [DOI] [PubMed] [Google Scholar]
- 8.Fong PC, Boss DS, Yap TA, Tutt A, Wu P, Mergui-Roelvink M, Mortimer P, Swaisland H, Lau A, O’connor MJ, et al. (2009). Inhibition of Poly(ADP-Ribose) Polymerase in Tumors from BRCA Mutation Carriers. N. Engl. J. Med. 361, 123–134. 10.1056/nejmoa0900212. [DOI] [PubMed] [Google Scholar]
- 9.Ledermann J, Harter P, Gourley C, Friedlander M, Vergote I, Rustin G, Scott C, Meier W, Shapira-Frommer R, Safra T, et al. (2012). Olaparib maintenance therapy in platinum-sensitive relapsed ovarian cancer. N. Engl. J. Med. 366, 1382–1392. 10.1056/nejmoa1105535. [DOI] [PubMed] [Google Scholar]
- 10.Friedlander M, Matulonis U, Gourley C, Bois A. du, Vergote I., Rustin G., Scott C., Meier W., Shapira-Frommer R., Safra T., et al. (2018). Long-term efficacy, tolerability and overall survival in patients with platinum-sensitive, recurrent high-grade serous ovarian cancer treated with maintenance olaparib capsules following response to chemotherapy. Br. J. Cancer 119, 1075–1085. 10.1038/s41416-018-0271-y. [DOI] [PMC free article] [PubMed] [Google Scholar]
- 11.Poveda A, Floquet A, Ledermann JA, Asher R, Penson RT, Oza AM, Korach J, Huzarski T, Pignata S, Friedlander M, et al. (2020). Final overall survival (OS) results from SOLO2/ENGOT-ov21: A phase III trial assessing maintenance olaparib in patients (pts) with platinum-sensitive, relapsed ovarian cancer and a BRCA mutation. J. Clin. Oncol. 38, 6002–6002. 10.1200/jco.2020.38.15_suppl.6002. [DOI] [Google Scholar]
- 12.Ray-Coquard I, Leary A, Pignata S, Cropet C, González-Martín A, Marth C, Nagao S, Vergote I, Colombo N, Mäenpää J, et al. (2023). Olaparib plus bevacizumab first-line maintenance in ovarian cancer: final overall survival results from the PAOLA-1/ENGOT-ov25 trial. Ann. Oncol. 34, 681–692. 10.1016/j.annonc.2023.05.005. [DOI] [PubMed] [Google Scholar]
- 13.Banerjee S, Moore KN, Colombo N, Scambia G, Kim BG, Oaknin A, Friedlander M, Lisyanskaya A, Floquet A, Leary A, et al. (2020). Maintenance olaparib for patients (pts) with newly diagnosed, advanced ovarian cancer (OC) and a BRCA mutation (BRCAm): 5-year (y) follow-up (f/u) from SOLO1. Annals of Oncology 31, S613. [Google Scholar]
- 14.Moore K, Colombo N, Scambia G, Kim BG, Oaknin A, Friedlander M, Lisyanskaya A, Floquet A, Leary A, Sonke GS, et al. (2018). Maintenance olaparib in patients with newly diagnosed advanced ovarian cancer. N. Engl. J. Med. 379, 2495–2505. 10.1056/nejmoa1810858. [DOI] [PubMed] [Google Scholar]
- 15.Francis KE, Kim SI, Friedlander M, Gebski V, Coquard IR, Clamp A, Penson RT, Oza A, Perri T, Huzarski T, et al. (2022). The impact of olaparib dose reduction and treatment interruption on treatment outcome in the SOLO2/ENGOT-ov21 platinum-sensitive recurrent ovarian cancer. Annals of Oncology. 10.1016/j.annonc.2022.02.222. [DOI] [PubMed] [Google Scholar]
- 16.Moore KN, and Birrer MJ (2018). Administration of the Tablet Formulation of Olaparib in Patients with Ovarian Cancer: Practical Guidance and Expectations. Oncol. 23, 697–703. 10.1634/theoncologist.2017-0485. [DOI] [PMC free article] [PubMed] [Google Scholar]
- 17.Mateo J, Moreno V, Gupta A, Kaye SB, Dean E, Middleton MR, Friedlander M, Gourley C, Plummer R, Rustin G, et al. (2016). An Adaptive Study to Determine the Optimal Dose of the Tablet Formulation of the PARP Inhibitor Olaparib. Target. Oncol. 11, 401–415. 10.1007/s11523-016-0435-8. [DOI] [PubMed] [Google Scholar]
- 18.LP AP (2017). Lynparza (olaparib) capsules [prescribing information]. AstraZeneca Pharmaceuticals LP: Wilmington, DE. [Google Scholar]
- 19.Kaye SB, Lubinski J, Matulonis U, Ang JE, Gourley C, Karlan BY, Amnon A, Bell-McGuinn KM, Chen L-M, Friedlander M, et al. (2012). Phase II, Open-Label, Randomized, Multicenter Study Comparing the Efficacy and Safety of Olaparib, a Poly (ADP-Ribose) Polymerase Inhibitor, and Pegylated Liposomal Doxorubicin in Patients With BRCA1 or BRCA2 Mutations and Recurrent Ovarian Cancer. Journal of Clinical Oncology 30, 372–379. 10.1200/jco.2011.36.9215. [DOI] [PubMed] [Google Scholar]
- 20.Audeh MW, Carmichael J, Penson RT, Friedlander M, Powell B, Bell-McGuinn KM, Scott C, Weitzel JN, Oaknin A, Loman N, et al. (2010). Oral poly(ADP-ribose) polymerase inhibitor olaparib in patients with BRCA1 or BRCA2 mutations and recurrent ovarian cancer: A proof-of-concept trial. Lancet 376, 245–251. 10.1016/s0140-6736(10)60893-8. [DOI] [PubMed] [Google Scholar]
- 21.Merlo LMF, Pepper JW, Reid BJ, and Maley CC (2006). Cancer as an evolutionary and ecological process. Nature Reviews Cancer 6, 924–935. [DOI] [PubMed] [Google Scholar]
- 22.Maley CC, Aktipis A, Graham TA, Sottoriva A, Boddy AM, Janiszewska M, Silva AS, Gerlinger M, Yuan Y, Pienta KJ, et al. (2017). Classifying the evolutionary and ecological features of neoplasms. Nature Reviews Cancer 17, 605–619. 10.1038/nrc.2017.69. [DOI] [PMC free article] [PubMed] [Google Scholar]
- 23.Beumer JH (2013). Without therapeutic drug monitoring, there is no personalized cancer care. Clinical Pharmacology and Therapeutics 93, 228–230. 10.1038/clpt.2012.243. [DOI] [PubMed] [Google Scholar]
- 24.Stampfer HG, Gabb GM, and Dimmitt SB (2019). Why maximum tolerated dose? Br. J. Clin. Pharmacol. 85, 2213–2217. 10.1111/bcp.14032. [DOI] [PMC free article] [PubMed] [Google Scholar]
- 25.Sachs JR, Mayawala K, Gadamsetty S, Kang SP, and Alwis D.P. de (2016). Optimal Dosing for Targeted Therapies in Oncology: Drug Development Cases Leading by Example. Clin. Cancer Res. 22, 1318–1324. 10.1158/1078-0432.ccr-15-1295. [DOI] [PubMed] [Google Scholar]
- 26.Gatenby RA (2009). A change of strategy in the war on cancer. Nature 459, 508–509. 10.1038/459508a. [DOI] [PubMed] [Google Scholar]
- 27.Gatenby RA, Silva AS, Gillies RJ, and Frieden BR (2009). Adaptive therapy. Cancer Res. 69, 4894–4903. 10.1158/0008-5472.can-08-3658. [DOI] [PMC free article] [PubMed] [Google Scholar]
- 28.Gatenby RA, and Brown JS (2020). Integrating evolutionary dynamics into cancer therapy. Nature Reviews Clinical Oncology 17, 675–686. 10.1038/s41571-020-0411-1. [DOI] [PubMed] [Google Scholar]
- 29.West J, Adler F, Gallaher J, Strobl M, Brady-Nicholls R, Brown J, Roberson-Tessi M, Kim E, Noble R, Viossat Y, et al. (2023). A survey of open questions in adaptive therapy: Bridging mathematics and clinical translation. eLife 12, e84263. 10.7554/elife.84263. [DOI] [PMC free article] [PubMed] [Google Scholar]
- 30.Strobl MAR, Gallaher J, West J, Robertson-Tessi M, Maini PK, and Anderson ARA (2022). Spatial structure impacts adaptive therapy by shaping intra-tumoral competition. Commun. Med. 2, 1–18. 10.1038/s43856-022-00110-x. [DOI] [PMC free article] [PubMed] [Google Scholar]
- 31.Gallaher JA, Enriquez-Navas PM, Luddy KA, Gatenby RA, and Anderson ARA (2018). Spatial heterogeneity and evolutionary dynamics modulate time to recurrence in continuous and adaptive cancer therapies. Cancer Res. 78, 2127–2139. 10.1158/0008-5472.can-17-2649. [DOI] [PMC free article] [PubMed] [Google Scholar]
- 32.Bacevic K, Noble R, Soffar A, Ammar OW, Boszonyik B, Prieto S, Vincent C, Hochberg ME, Krasinska L, and Fisher D (2017). Spatial competition constrains resistance to targeted cancer therapy. Nature communications 8, 1–15. [DOI] [PMC free article] [PubMed] [Google Scholar]
- 33.Viossat Y, and Noble R (2021). A theoretical analysis of tumour containment. Nature Ecology & Evolution, 1–10. [DOI] [PMC free article] [PubMed] [Google Scholar]
- 34.Enriquez-Navas PM, Yoonseok K, Das T, Hassan S, Silva AS, Foroutan P, Ruiz E, Martinez G, Minton S, Gillies RJ, et al. (2016). Exploiting evolutionary principles to prolong tumor control in preclinical models of breast cancer. Sci. Transl. Med. 8, 327ra24. 10.1126/scitranslmed.aad7842. [DOI] [PMC free article] [PubMed] [Google Scholar]
- 35.Seyedi S, Teo R, Foster L, Saha D, Mina L, Northfelt D, Anderson KS, Shibata D, Gatenby R, Cisneros L, et al. (2023). Testing Adaptive Therapy Protocols using Gemcitabine and Capecitabine on a Mouse Model of Endocrine-Resistant Breast Cancer. bioRxiv, 2023.09.18.558136. 10.1101/2023.09.18.558136. [DOI] [PMC free article] [PubMed] [Google Scholar]
- 36.Wang J, Zhang Y, Liu X, and Liu H (2021). Is the fixed periodic treatment effective for the tumor system without complete information? Cancer Management and Research 13, 8915–8928. 10.2147/cmar.s339787. [DOI] [PMC free article] [PubMed] [Google Scholar]
- 37.Wang J, Zhang Y, Liu X, and Liu H (2021). Optimizing adaptive therapy based on the reachability to tumor resistant subpopulation. Cancers 13, 5262. 10.3390/cancers13215262. [DOI] [PMC free article] [PubMed] [Google Scholar]
- 38.Smalley I, Kim E, Li J, Spence P, Wyatt CJ, Eroglu Z, Sondak VK, Messina JL, Babacan NA, Maria-Engler SS, et al. (2019). Leveraging transcriptional dynamics to improve BRAF inhibitor responses in melanoma. EBioMedicine 48, 178–190. 10.1016/j.ebiom.2019.09.023. [DOI] [PMC free article] [PubMed] [Google Scholar]
- 39.Maltas J, Killarney ST, Singleton KR, Strobl MAR, Washart R, Wood KC, and Wood KB (2023). Drug dependence in cancer is exploitable by optimally constructed treatment holidays. Nat. Ecol. Evol, 1–16. 10.1038/s41559-023-02255-x. [DOI] [PMC free article] [PubMed] [Google Scholar]
- 40.Hockings H, Lakatos E, Huang W, Mossner M, Khan MA, Metcalf S, Nicolini F, Smith K, Baker A-M, Graham TA, et al. (2023). Adaptive therapy achieves long-term control of chemotherapy resistance in high grade ovarian cancer. 10.1101/2023.07.21.549688. [DOI] [Google Scholar]
- 41.Zhang J, Cunningham J, Brown J, and Gatenby R (2022). Evolution-based mathematical models significantly prolong response to abiraterone in metastatic castrate-resistant prostate cancer and identify strategies to further improve outcomes. eLife 11, 1–105. [DOI] [PMC free article] [PubMed] [Google Scholar]
- 42.Zhang J, Cunningham JJ, Brown JS, and Gatenby RA (2017). Integrating evolutionary dynamics into treatment of metastatic castrate-resistant prostate cancer. Nat. Commun. 8, 1816. 10.1038/s41467-017-01968-5. [DOI] [PMC free article] [PubMed] [Google Scholar]
- 43.Mason NT, Burkett JM, Nelson RS, Pow-Sang JM, Gatenby RA, Kubal T, Peabody JW, Letson GD, McLeod HL, and Zhang J (2021). Budget Impact of Adaptive Abiraterone Therapy for Castration-Resistant Prostate Cancer. American Health and Drug Benefits. https://www.ahdbonline.com/issues/2021/march-2021-vol-14-no-1/3089-budget-impact-of-adaptive-abiraterone-therapy-for-castration-resistant-prostate-cancer. [PMC free article] [PubMed] [Google Scholar]
- 44.Zhang M, Cheng S, Jin Y, Zhao Y, and Wang Y (2021). Roles of CA125 in diagnosis, prediction, and oncogenesis of ovarian cancer. Biochimica et Biophysica Acta - Reviews on Cancer 1875, 188503. 10.1016/j.bbcan.2021.188503. [DOI] [PubMed] [Google Scholar]
- 45.Altrock PM, Liu LL, and Michor F (2015). The mathematics of cancer: Integrating quantitative models. Nat. Rev. Cancer 15, 730–745. 10.1038/nrc4029. [DOI] [PubMed] [Google Scholar]
- 46.Barbolosi D, Ciccolini J, Lacarelle B, Barlési F, and André N (2016). Computational oncology-mathematical modelling of drug regimens for precision medicine. Nat. Rev. Clin. Oncol. 13, 242–254. 10.1038/nrclinonc.2015.204. [DOI] [PubMed] [Google Scholar]
- 47.Hernandez-Boussard T, Macklin P, Greenspan EJ, Gryshuk AL, Stahlberg E, Syeda-Mahmood T, and Shmulevich I (2021). Digital twins for predictive oncology will be a paradigm shift for precision cancer care. Nat. Med. 27, 2065–2066. 10.1038/s41591-021-01558-5. [DOI] [PMC free article] [PubMed] [Google Scholar]
- 48.Strobl MAR, Gallaher J, Robertson-Tessi M, West J, and Anderson ARA (2023). Treatment of evolving cancers will require dynamic decision support. Ann. Oncol. 34, 867–884. 10.1016/j.annonc.2023.08.008. [DOI] [PMC free article] [PubMed] [Google Scholar]
- 49.Botesteanu DA, Lipkowitz S, Lee JM, and Levy D (2016). Mathematical models of breast and ovarian cancers. Wiley Interdiscip. Rev.: Syst. Biol. Med. 8, 337–362. 10.1002/wsbm.1343. [DOI] [PMC free article] [PubMed] [Google Scholar]
- 50.Bertalanffy L von (1957). Quantitative Laws in Metabolism and Growth. Q Rev Biology 32, 217–231. 10.1086/401873. [DOI] [PubMed] [Google Scholar]
- 51.Gompertz (1825). On the nature of the function expressive of the law of human mortality, and on a new mode of determining the value of life contingencies. Philos. Trans. R. Soc. Lond. 115, 513–583. 10.1098/rstl.1825.0026. [DOI] [PMC free article] [PubMed] [Google Scholar]
- 52.Krzanowski WJ (2010). An Introduction to Statistical Modelling (Wiley). [Google Scholar]
- 53.Newville M, Stensitzki T, Allen DB, and Ingargiola A (2014). LMFIT: Non-Linear Least-Square Minimization and Curve-Fitting for Python. 10.5281/zenodo.11813. [DOI] [Google Scholar]
- 54.Bacevic K, Noble R, Soffar A, Ammar OW, Boszonyik B, Prieto S, Vincent C, Hochberg ME, Krasinska L, and Fisher D (2017). Spatial competition constrains resistance to targeted cancer therapy. Nat. Commun. 8, 1–15. 10.1038/s41467-017-01516-1. [DOI] [PMC free article] [PubMed] [Google Scholar]
- 55.Zhang J, Cunningham J, Brown J, and Gatenby R (2022). Evolution-based mathematical models significantly prolong response to abiraterone in metastatic castrate-resistant prostate cancer and identify strategies to further improve outcomes. eLife 11, e76284. 10.7554/elife.76284. [DOI] [PMC free article] [PubMed] [Google Scholar]
- 56.West J, Strobl M, Armagost C, Miles R, Marusyk A, and Anderson ARA (2020). Antifragile therapy. bioRxiv, 2020.10.08.331678. 10.1101/2020.10.08.331678. [DOI] [Google Scholar]
- 57.You B, Robelin P, Tod M, Louvet C, Lotz JP, Abadie-Lacourtoisie S, Fabbro M, Desauw C, Bonichon-Lamichhane N, Kurtz JE, et al. (2020). CA-125 ELImination rate constant K (KELIM) is a marker of chemosensitivity in patients with ovarian cancer: Results from the phase II CHIVA trial. Clinical Cancer Research 26, 4625–4632. 10.1158/1078-0432.ccr-20-0054. [DOI] [PubMed] [Google Scholar]
- 58.Prokopiou S, Moros EG, Poleszczuk J, Caudell J, Torres-Roca JF, Latifi K, Lee JK, Myerson R, Harrison LB, and Enderling H (2015). A proliferation saturation index to predict radiation response and personalize radiotherapy fractionation. Radiation Oncology 10. 10.1186/s13014-015-0465-x. [DOI] [PMC free article] [PubMed] [Google Scholar]
- 59.Zahid MU, Mohsin N, Mohamed ASR, Caudell JJ, Harrison LB, Fuller CD,Moros EG, and Enderling H (2021). Forecasting Individual Patient Response to Radiotherapy in Head and Neck Cancer with a Dynamic Carrying Capacity Model. International Journal of Radiation Oncology*Biology*Physics. 10.1016/j.ijrobp.2021.05.132. [DOI] [PMC free article] [PubMed] [Google Scholar]
- 60.Gallagher K, Strobl M, Gatenby R, Maini P, and Anderson A (2023). Learning to Adapt - Deep Reinforcement Learning in Treatment-Resistant Prostate Cancer. 10.1101/2023.04.28.538766. [DOI] [Google Scholar]
- 61.Dua R, Ma Y, and Newton PK (2021). Are Adaptive Chemotherapy Schedules Robust? A Three-Strategy Stochastic Evolutionary Game Theory Model. Cancers 13, 2880. 10.3390/cancers13122880. [DOI] [PMC free article] [PubMed] [Google Scholar]
- 62.Sheta R, Bachvarova M, Plante M, Renaud MC, Sebastianelli A, Gregoire J,Navarro JM, Perez RB, Masson JY, and Bachvarov D (2020). Development of a 3D functional assay and identification of biomarkers, predictive for response of high-grade serous ovarian cancer (HGSOC) patients to poly-ADP ribose polymerase inhibitors (PARPis): targeted therapy. J. Transl. Med. 18, 439. 10.1186/s12967-020-02613-4. [DOI] [PMC free article] [PubMed] [Google Scholar]
- 63.Hansen E, Woods RJ, and Read AF (2017). How to Use a Chemotherapeutic Agent When Resistance to It Threatens the Patient. PLoS Biol. 15, e2001110. 10.1371/journal.pbio.2001110. [DOI] [PMC free article] [PubMed] [Google Scholar]
- 64.Hansen E, and Read AF (2020). Modifying adaptive therapy to enhance competitive suppression. Cancers 12, 1–13. 10.3390/cancers12123556. [DOI] [PMC free article] [PubMed] [Google Scholar]
- 65.Gall L, Jardi F, Lammens L, Piñero J, Souza TM, Rodrigues D, Jennen DGJ, Kok TM, Coyle L, Chung S, et al. (2023). A dynamic model of the intestinal epithelium integrates multiple sources of preclinical data and enables clinical translation of drug-induced toxicity. CPT: Pharmacomet. Syst. Pharmacol. 10.1002/psp4.13029. [DOI] [PMC free article] [PubMed] [Google Scholar]
- 66.Friberg LE, Henningsson A, Maas H, Nguyen L, and Karlsson MO (2002). Model of chemotherapy-induced myelosuppression with parameter consistency across drugs. Journal of Clinical Oncology 20, 4713–4721. 10.1200/jco.2002.02.140. [DOI] [PubMed] [Google Scholar]
- 67.Zhou D, Li J, Bui K, Learoyd M, Berges A, Milenkova T, Al-Huniti N, Tomkinson H, and Xu H (2019). Bridging Olaparib Capsule and Tablet Formulations Using Population Pharmacokinetic Meta-analysis in Oncology Patients. Clin. Pharmacokinet. 58, 615–625. 10.1007/s40262-018-0714-x. [DOI] [PubMed] [Google Scholar]
- 68.Farrokhian N, Maltas J, Dinh M, Durmaz A, Ellsworth P, Hitomi M, McClure E, Marusyk A, Kaznatcheev A, and Scott JG (2022). Measuring competitive exclusion in non–small cell lung cancer. Sci Adv 8, eabm7212. 10.1126/sciadv.abm7212. [DOI] [PMC free article] [PubMed] [Google Scholar]
Associated Data
This section collects any data citations, data availability statements, or supplementary materials included in this article.
Supplementary Materials
Data Availability Statement
The confluence vs time data from the time-lapse microscopy experiments has been deposited at Zenodo (DOI: https://zenodo.org/doi/10.5281/zenodo.10718199). Raw microscopy images will be shared by the lead contact upon request.
The longitudinal volume data, as well as the treatment information for each individual animal in the in vivo experiment has been deposited at Zenodo (DOI: https://zenodo.org/doi/10.5281/zenodo.10718199).
All original code has been deposited at Zenodo and is publicly available as of the date of publication (DOI: https://zenodo.org/doi/10.5281/zenodo.10718199).
Any additional information required to reanalyze the data reported in this paper is available from the lead contact upon request.