

Keywords: electrical pulse stimulation, exercise, exerkine, skeletal muscle
Abstract
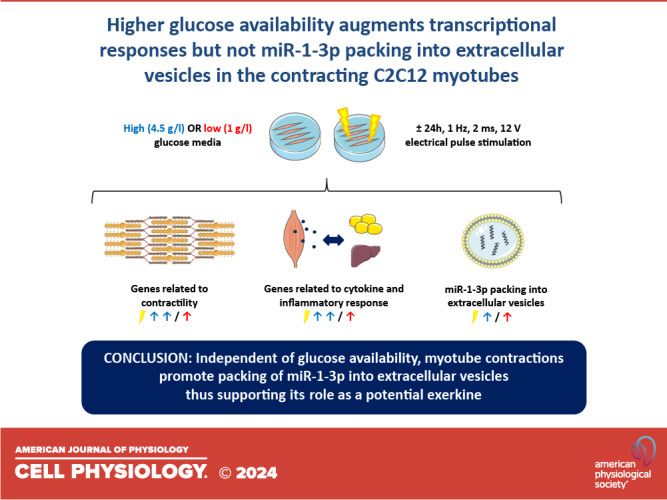
Exercise-like electrical pulse stimulation (EL-EPS) of myotubes mimics many key physiological changes induced by in vivo exercise. Besides enabling intracellular research, EL-EPS allows to study secreted factors, including muscle-specific microRNAs (myomiRs) carried in extracellular vesicles (EVs). These factors can participate in contraction-induced intercellular cross talk and may mediate the health benefits of exercise. However, the current knowledge of these responses, especially under variable nutritional conditions, is limited. We investigated the effects of EL-EPS on C2C12 myotube transcriptome in high- and low-glucose conditions by messenger RNA sequencing, while the expression of EV-carried miRNAs was analyzed by small RNA sequencing and RT-qPCR. We show that higher glucose availability augmented contraction-induced transcriptional changes and that the majority of the differentially expressed genes were upregulated. Furthermore, based on the pathway analyses, processes related to contractility and cytokine/inflammatory responses were upregulated. In addition, we report that EL-EPS increased packing of miR-1-3p into EVs independent of glucose availability. Together our findings suggest that in vitro EL-EPS is a usable tool not only to study contraction-induced intracellular mechanisms but also extracellular responses. The distinct transcriptional changes observed under variable nutritional conditions emphasize the importance of careful consideration of media composition in future exercise-mimicking studies.
NEW & NOTEWORTHY The present study examined for the first time the effects of exercise-like electrical pulse stimulation administered under distinct nutritional conditions on 1) the transcriptome of the C2C12 myotubes and 2) their media containing extracellular vesicle-carried microRNAs. We report that higher glucose availability augmented transcriptional responses related especially to contractility and cytokine/inflammatory pathways. Agreeing with in vivo studies, we show that the packing of exercise-responsive miR-1-3p was increased in the extracellular vesicles in response to myotube contractions.
INTRODUCTION
Exercise is known to promote health as well as to ameliorate and treat many diseases caused by sedentary lifestyles and obesity (1). During exercise skeletal muscles can modify not just their own but also the metabolism of other organs, such as the liver and adipose tissue (2). Exerkines are molecules released in response to acute and/or chronic exercise exerting their effects through endocrine, paracrine, and/or autocrine pathways (3). Many organs including skeletal muscle produce and release these exerkines, such as proteins/peptides, cytokines, nucleic acids, metabolites, as well as extracellular vesicles (EVs), and release them into circulation in response to exercise (2, 4). Numerous in vivo and in vitro studies have identified and validated various exerkines as well as some of their functions and target tissues (for review, see Refs. 2 and 3). Previous studies have shown that skeletal muscle-specific exercise-like electrical pulse stimulation (EL-EPS) (5) of the myotubes can mimic many intra- and extracellular responses of in vivo exercise at the cellular (5, 6) and omics (7) levels. In addition, we have previously shown that media glucose availability altered the metabolic responses of the C2C12 myotubes to EL-EPS (8). Because myotube gene expression is significantly impacted by the media glucose content (9, 10) and exercise responses have been reported to be affected by carbohydrate availability in vivo (11), it is important to examine how EL-EPS together with the variable nutritional conditions affects myotube transcriptome and regulation of the expression of genes encoding, for example, different exerkines.
Accumulating evidence demonstrates that EVs can encapsulate exerkines and transmit this functional cargo, such as microRNAs (miRNAs) (12, 13), via circulation to nearby and/or distant organs and tissues (14). We (15) and others (16) have shown that acute exercise induces changes in the miRNA cargo of EVs. Furthermore, some of the health-beneficial effects and adaptations of exercise have been reported to be mediated by miRNAs (17), thus making them an appealing target for biomarker research. Previous studies have shown that the levels of muscle-specific miRNAs, i.e., myomiRs, such as miR-1, miR-133a, and miR-206, are increased in the circulating EVs after exercise (12, 13). EVs are a heterogeneous group of membrane-bound particles found virtually from all biofluids in vivo and from conditioned cell culture media in vitro (17). Because the EV content can vary depending on the physiological state of the cells from which they originate (18), it is important to study how nutrient availability affects EV-mediated intercellular cross talk in response to myotube contractions. In addition, in vitro approaches are needed to study the myotube-derived EVs because in vivo models cannot exclude the possibility that the EVs collected from the circulation, even in the presence of certain predetermined markers, are not of muscular origin.
This study aimed to analyze the effects of the chronic low-frequency EL-EPS together with varying media glucose content on the C2C12 myotube transcriptome and EV cargo. Several bioinformatic analyses were used to reveal the underlying mechanisms through which EL-EPS and/or availability of nutrients affect physiological responses and related pathways.
MATERIALS AND METHODS
Cell Culture
The murine C2C12 myoblasts purchased from American Type Culture Collection (Manassas, VA) were grown and differentiated identically as previously described in detail (8). Briefly, the myoblasts were seeded on six-well plates and grown in high glucose (HG, 4.5 g/L, #BE12-614F, Lonza, Basel, Switzerland) containing growth medium. After reaching over 90% confluence, the fusion into myotubes was promoted by the HG-containing differentiation medium (DM) (8). Representative images of the C2C12 myotubes differentiated with the identical protocol have been published previously elsewhere by us (19). The media volume per well during differentiation and experiments was 2 mL. All the experiments were performed using cells with passage numbers between 6 and 8 in a humidified environment at 37°C and 5% CO2.
Exercise-Like Electrical Pulse Stimulation
The experiments were conducted on days 4–6 post myotube differentiation by using either high or low glucose (LG, 1 g/L, #BE12-707F, Lonza) DMEM identically as previously described (8) (Fig. 1). Briefly, if LG medium was used, the cells were acclimatized to LG DM from day 4 post differentiation. At day 5 post differentiation, serum- and antibiotic-free HG or LG DMEM supplemented with 2 mM l-glutamine (#25030, Gibco, Rockville, MD) was added for 1 h (20). Serum-free conditions are important not only to exclude the effects of switching to serum-free medium (20) but also to avoid co-isolation of exogenous EVs or other signal carrier particles, such as high-density lipoproteins (21). Next, the medium was removed, the myotubes were rinsed with phosphate-buffered saline (PBS, #10010, Gibco), and fresh serum-free HG or LG DMEM supplemented with 2 mM l-glutamine was added. The low-frequency EL-EPS was applied for 24 h (1 Hz, 2 ms, 12 V) using C-dish carbon electrodes attached to C-Pace device (Ionoptix Corporation, Milton, MA). Carbon electrodes that were not attached to the C-Pace device were also placed on the control plates for the EV extraction experiments (sRNA-seq). This was done to exclude the effects of the electrodes on the EV extraction because EVs have a high affinity to different types of surfaces, at least plastic (22). On day 6 post differentiation, the samples were harvested immediately after cessation of EL-EPS. To remove cell debris, media were centrifuged for 5 min at 382 g at 4°C and the supernatants were stored at −80°C until EV extraction. Simultaneously, the myotubes were washed with PBS, scraped into 340 μL of DNA/RNA Shield (#R1100, Zymo Research, Irvine, CA), and stored at room temperature (RT) until total RNA extraction.
Figure 1.
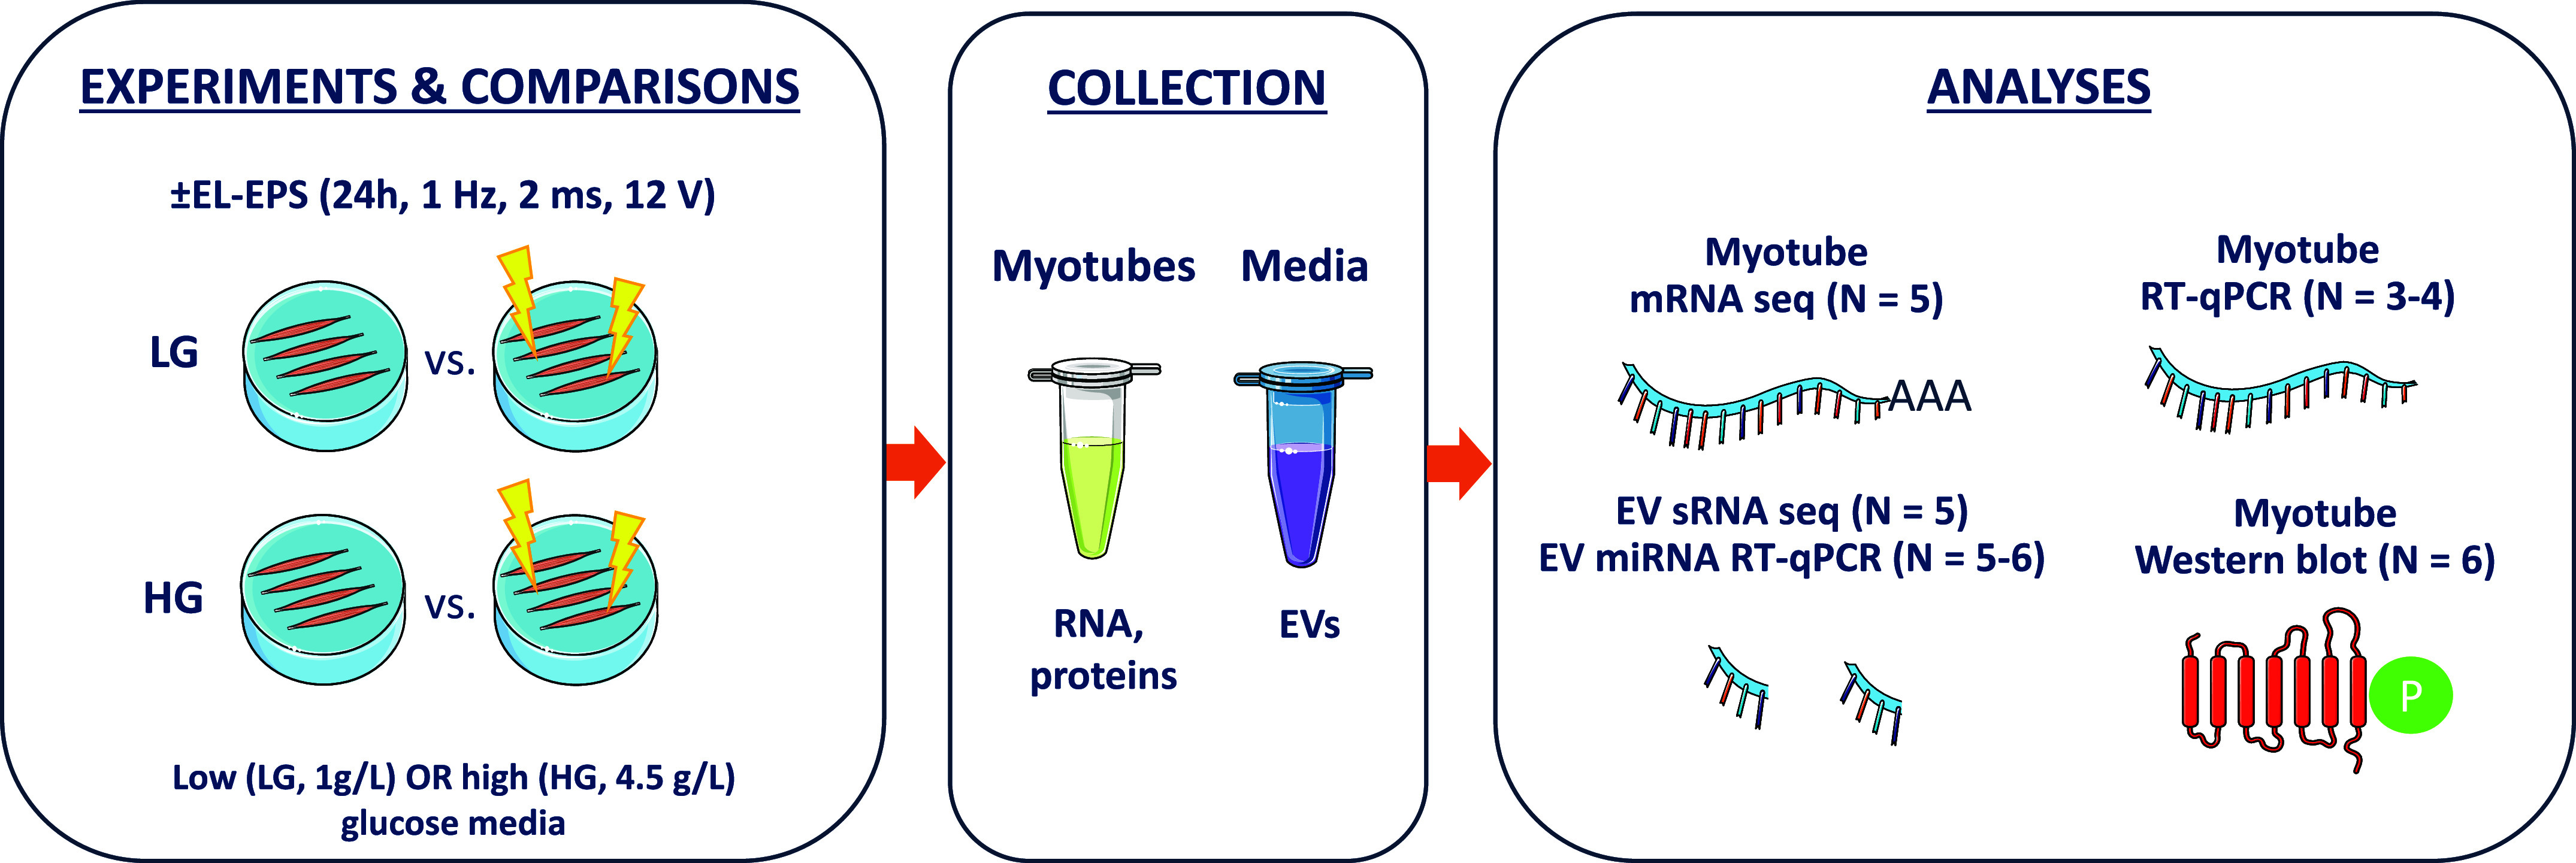
Schematic presentation of the study design.
Validation of the EV Isolation by Nanoparticle Tracking Analysis and Electron Microscopy
The EVs were isolated using exoRNeasy serum/plasma midi kit (#77044, Qiagen, Hilden, Germany) as previously described (23). For the validation of the EV isolation protocol, 1.5 mL of media was used. Briefly, EVs were eluted by adding 140 μL of elution buffer XE (#76214, Qiagen) followed by 5 min incubation and centrifugation for 5 min at 500 g at RT. The collected eluate was then mixed with 360 μL of PBS that was filtered through a 0.2-μm filter, transferred into a 100 K ultra-filter device (UFC5100, Amicon, Millipore, Darmstadt, Germany), and centrifuged for 10 min at 14,000 g at RT. Then, the EVs were washed three times with filtered PBS to purify EVs from possible debris originating from the affinity columns, and the flow-through was discarded. The concentrate was recovered by centrifugation for 2 min at 1,000 g at RT, according to the manufacturer’s protocol. The analyses of the particle size (nanoparticle tracking analysis) and morphology (electron microscopy) were conducted at the University of Helsinki EV core (Helsinki, Finland) as previously described (23, 24). Low protein binding tubes were used whenever possible during the EV sample collection and purification.
RNA Extraction
Nucleic acid extraction from the C2C12 myotube lysates stored in the DNA/RNA Shield (Zymo Research) was conducted using Chemagic 360 automated nucleic acid extraction instrument (Perkin Elmer, Boston, MA). The total RNA extraction from the EVs was conducted using the exoRNeasy Serum/Plasma Midi Kit (#77144 or after discontinuation #77044, Qiagen), according to the manufacturer’s protocol. Briefly about the EV RNA extraction, media from two or three wells were pooled and run through the exoRNeasy spin columns. During the RNA extraction for RT-qPCR, miRNeasy Serum/Plasma Spike-In Control, cel-miR-39 (#219610, Qiagen) was added to be used as an internal control.
Library Preparation and mRNA-Sequencing
The total RNA samples of the cell lysates were first treated with dsDNase (EN0771, Thermo Fisher Scientific, Waltham, MA) to eliminate genomic DNA. Then, RNA concentration and integrity were measured with TapeStation (Agilent Technologies, Santa Clara, CA), according to the manufacturer’s instructions. The average RNA integrity number (RIN) value was 8.97 ± 0.22 (means ± standard error) showing low degradation of RNA. The sequencing libraries for the gene expression profiling (3' mRNA-seq) were prepared using a commercial kit (012.24 A, QuantSeq 3′ mRNA-Seq Library Prep Kit for Ion Torrent, Lexogen, Inc., Vienna, Austria), according to the manufacturer’s protocols. After measuring the DNA concentrations with Qubit dsDNA HS Assay Kit (Invitrogen), the barcoded libraries were pooled in equimolar concentrations (5 ng of each). The pool was then purified with 1.2× sparQ PureMag Beads (QuantaBio, Beverly, MA) and run on a High Sensitivity D1000 Screen Tape (Agilent Technologies) to determine the quality and molarity of the pool. To bind the template to the Ion Sphere Particles (ISPs), emulsion PCR was conducted in OneTouch2 instrument with Ion PGM Hi-Q OT2 Kit (Life Technologies, Carslbad, CA) following the protocol for 400 bp template, according to the manufacturer’s instructions. The ISPs were loaded into an Ion 318 v2 BC chip and sequencing was performed in Ion Torrent Personal Genome Machine using Ion PGM Hi-Q View Sequencing Kit (Life Technologies) similarly as described previously (25). To obtain a similar amount of reads from all samples, the data were pooled from two 318 v2 chips.
Library Preparation and Small RNA-Sequencing
After the EV RNA extraction, the RIN values were not measured as small RNA (sRNA) is less sensitive to degradation and as the RNA concentration was low. The small RNA libraries for the miRNA expression profiling (sRNA-seq) were prepared using a commercial kit (#4475936, Ion Total RNA-Seq Kit v2, 12 reaction kit, Thermo Fisher Scientific), according to the manufacturer’s protocols with slight modifications. The products were amplified using primer pair M13_IA 5′- TGTAAAACGACGGCCAGTGGCCAAGGCG-3′ and P1 5′- CCACTACGCCTCCGCTTT-3′ using the Platinum Supermix and for second time using the primer P1 and the IonA_bc_M13 adapter 5′- CCATCTCATCCCTGCGTGTCTCCGACTCAGXXXTGTAAAACGACGGCCAGT-3′, where XXX refers to the IonXpress barcode. The barcoded samples were pooled in equal volumes and 100–140-bp sized PCR products (including 92 bp of adapter sequences) were isolated using 1.6% NuSieve agarose (Lonza) gel electrophoresis and Nucleospin Gel and PCR Cleanup (Macherey-Nagel) extraction. From this step onward, the sequencing protocol is identical to mRNA protocol described in Library Preparation and mRNA-Sequencing, except that the samples were sequenced using Ion GeneStudio S5 System with the 540 chip (Life Technologies).
cDNA Synthesis and Real-Time Quantitative PCR
For the RT-qPCR from the cell lysates, genomic DNA was eliminated, and the cDNA was synthesized using Maxima H first strand cDNA synthesis kit with dsDNase (#K1682, Thermo Fisher Scientific), according to the manufacturer’s protocol. The RT-qPCR was conducted as previously described (26). The efficiency-corrected 2−ΔΔCt method was used for the RT-qPCR data analysis and 36b4 was the housekeeping gene used for normalization. The Bio-Rad Prime PCR Assays (Bio-Rad Laboratories, Hercules, CA) used were as follows: Cxcl1 (qMmuCED0003898), Cxcl5 (qMmuCED0003886) and Scml4 (qMmuCED0050877). The primer sequences for 36b4 were 5′-GGCCCTGCACTCTCGCTTTC-3′ and 5′- TGCCAGGACGCGCTTGT-3′ and for Tceal7 5′-TTGTGGCAAGGAGAAGAGAAG-3′ and 5′-TGAAATTGCCTTCCAGTCGC-3′. For the RT-qPCR from the EVs, the extracted total RNA was reverse transcribed by using 12 µL of the RNA and miScript II RT Kit (#218161, Qiagen), according to manufacturer’s instructions. The RT-qPCR was conducted as previously described for miRNAs and the data was analyzed by using the equation 2−ΔCq (23). The spike-in control cel-miR-39-3p was used for normalization. The miScript Primer Assays (Qiagen) used in the RT-qPCR were miR-1-3p (MS00008358), miR-133a-3p (MS00031423), and cel-miR-39-3p (MS00019789). For miR-206-3p the miScript Primer Assay was not available, and hence it was ordered separately (sequence 5′- TGGAATGTAAGGAAGTGTGTGG-3′, Invitrogen, Thermo Fisher Scientific). For all the studied miRs, the sequence of the universal primer was 5′- GAATCGAGCACCAGTTACGC-3′. All the RT-qPCRs were conducted using the CFX96 Real-Time PCR Detection System combined with CFX Manager software (Bio-Rad Laboratories).
Western Blot
Due to the identical culturing and methodological arrangements, the same protein lysates and Western blot protocol were used as we previously described (8). Briefly, 10 µg of protein was loaded on 4%–20% Criterion TGX Stain-Free protein gels (No. 5678094, Bio-Rad Laboratories) followed by separation using SDS-PAGE. Stain-free technology was used to control loading and for data normalization to the total protein content. After blocking, the primary antibodies were probed overnight at 4°C. The primary antibodies purchased from Cell Signaling Technology (Danvers, MA) and their dilutions used were as follows: p-C/EBPβThr235 (#3084, 1:1,000), p-Iκβ/αSer32/36 (#9246, 1:1,000), p-IKKα/βSer176/180 (#2697, 1:1,000), p-NF-κBSer536 (#3033, 1:1,000), p-STAT3Tyr705 (#9145, 1:1,000), and STAT3 (#9139, 1:1,000). The CCL2/MCP1 (NBP1-07034, 1:1,000) was purchased from Novus Biologicals (Littleton, CO) and MYH1E (MF 20, concentrate, 1:3,000) from Developmental Studies Hybridoma Bank (Iowa City, IA). The horseradish peroxidase-conjugated secondary IgG anti-mouse (1:30,000) and anti-rabbit (1:10,000) antibodies were purchased from Jackson ImmunoResearch Laboratories (West Grove, PA). Enhanced chemiluminescence (SuperSignal west femto maximum sensitivity substrate; Pierce Biotechnology, Rockford, IL) and ChemiDoc MP device (Bio-Rad Laboratories) were used for protein visualization.
Bioinformatic Analyses
The mRNA-seq data analysis steps from the initial quality check to differential expression analysis were conducted using Chipster software (https://chipster.csc.fi/) (27), while sRNA-seq sequence processing was conducted using CLC Genomics Workbench version 22 software (Qiagen) and further data analyses with edgeR. In more detail, for the mRNA data processing, the read quality was first analyzed using multiQC for many FASTQ files. The quality control results show Phred scores ranging from over 30 at the beginning of the sequences to ∼23 at the base 300. The mean per-sequence Phred score was 27.9, and the mean sequence length was 155 bases. Next, the reads were aligned to the selected genome using STAR for single-ended reads. To count the number of aligned reads per gene, HTSeq tool was used. The average number of reads per sample was 346,191, resulting in an average of 255,387 reads being unambiguously mapped to the genes. The maximum read sequence number per run using the Ion Torrent PGM chips is ∼400,000–560,000 per sample for 20 samples. Our average was 346,191 reads per sample showing adequate technical success. About 23% of the reads were discarded because they could be aligned to more than one region. The total number of unique genes identified was 15,273 and this data was further analyzed to determine the differentially expressed genes (DEGs) using edgeR. From this step onwards, the data were analyzed using the following softwares: Gene Set Enrichment Analysis (GSEA, https://www.gsea-msigdb.xorg/gsea/index.jsp), Ingenuity Pathway Analysis (IPA, Qiagen, https://digitalinsights.qiagen.com/products-overview/discovery-insights-portfolio/analysis-and-visualization/qiagen-ipa/), and ShinyGO (28) (http://bioinformatics.sdstate.edu/go/). The GSEA is frequently used in exercise studies due to its low bias and ability to reveal changes in the expression of a large set of genes even when the average change of gene expression is 20% or even lower (29, 30), which typically is the case with exercise (31, 32). The GSEA was conducted using fgsea R package as previously described (33). The GSEA analysis included genes with at least four reads in the comparisons. When using ShinyGO, only DEGs (FDR < 0.05) from the pool of the stimulated versus the pool of the nonstimulated comparison (EPS main effect) as well as all the genes as background (including more than 4 reads per sample) were input to the analysis. For miRNAs, on average 2.39 M reads per sample were processed, adapter sequences were trimmed, and 9–40 bp long sequences were selected for the analyses. Reads (1.1–2.3 M per sample after trimming) were annotated against miRbase-Release_v22 (Mus musculus), allowing length-based isomiRs, two additional/missing upstream and downstream bases and mismatches. In the case of sRNA-seq, miRNAs with very low expression (less than 5 samples with at least 2 counts) were filtered out. The miRNA counts were normalized by trimmed mean of M values (TMM) method (34) using edgeR-package (35). Overall, we detected 163 miRNAs from the EVs and of these, the top 50 miRNAs with the highest normalized expression were chosen for further analyses unless otherwise stated.
Statistical Analyses
The statistical significance was set at Benjamini–Hochberg corrected false discovery rate (FDR) < 0.05 for multiple testing and fold change (FC) >|1.2|to discover DEGs. These DEGs were directed for the pathway/enrichment analyses using IPA (all comparisons) and ShinyGO (EPS main effect). For GSEA, all expressed mRNAs (which had at least 4 reads in total) were ranked in all the comparisons and used for further GSEA. For the statistical evaluation of the main and interaction effects in sRNA-seq, RT-qPCR (cell lysates), and Western blot, the two-way multivariate analysis of variance (two-way MANOVA) was used, whereas the group comparisons were performed using multivariate Tukey’s test (IBM SPSS Statistics, version 26 for Windows, SPSS Chicago, IL). Permutational multivariate analysis of variance (PERMANOVA) analysis of normalized miRNA counts was carried out using vegan R-package (36) and all 163 miRNAs. The miRNA RT-qPCR results (group comparisons as well as EL-EPS and glucose effects) were analyzed using Mann–Whitney U test (IBM SPSS Statistics). The extreme outliers from all the RT-qPCR analyses were removed based on Grubbs’ test (https://www.graphpad.com). GraphPad Prism software (v10.0.2) was used to prepare the bar graphs. The VIsualization and Integration of Metabolomics Experiments (VIIME) software (https://www.viime.org/#/) was used to generate the principal component analysis (PCA) score plot and the heat maps (37). Some of the plots were generated using the ggplot2 package (38) in the R programming language (version 4.3.1). The data are presented as means ± SE unless otherwise stated. The level of statistical significance was set at P < 0.05 when FDR was not used.
RESULTS
Higher Glucose Availability Augmented Gene Expression Responses after EL-EPS
The effects of EL-EPS and media glucose content on the C2C12 myotube transcriptome were analyzed after the 24 h EL-EPS by mRNA-seq. We observed eight and 66 DEGs in LG and HG conditions after EL-EPS, respectively (Fig. 2A). A comparison of the combined LG and HG groups with and without EL-EPS (EPS effect) resulted in 65 DEGs (Fig. 2A). Altogether, six DEGs (Cxcl1, Cxcl5, Myh2, Tceal7, Csrp3, and Ier3) were shared between these three comparisons (Fig. 2A). The principal component analysis (PCA) of the DEGs showed that the stimulated and nonstimulated groups were clearly separated independent of the glucose availability (Fig. 2B). The heat map clustering of the DEGs show that all eight DEGs observed under LG condition were upregulated, while HG condition (50 upregulated and 16 downregulated DEGs) and EPS effect (50 upregulated and 15 downregulated DEGs) resulted in substantially more upregulated than downregulated DEGs (Fig. 2, C–E).
Figure 2.
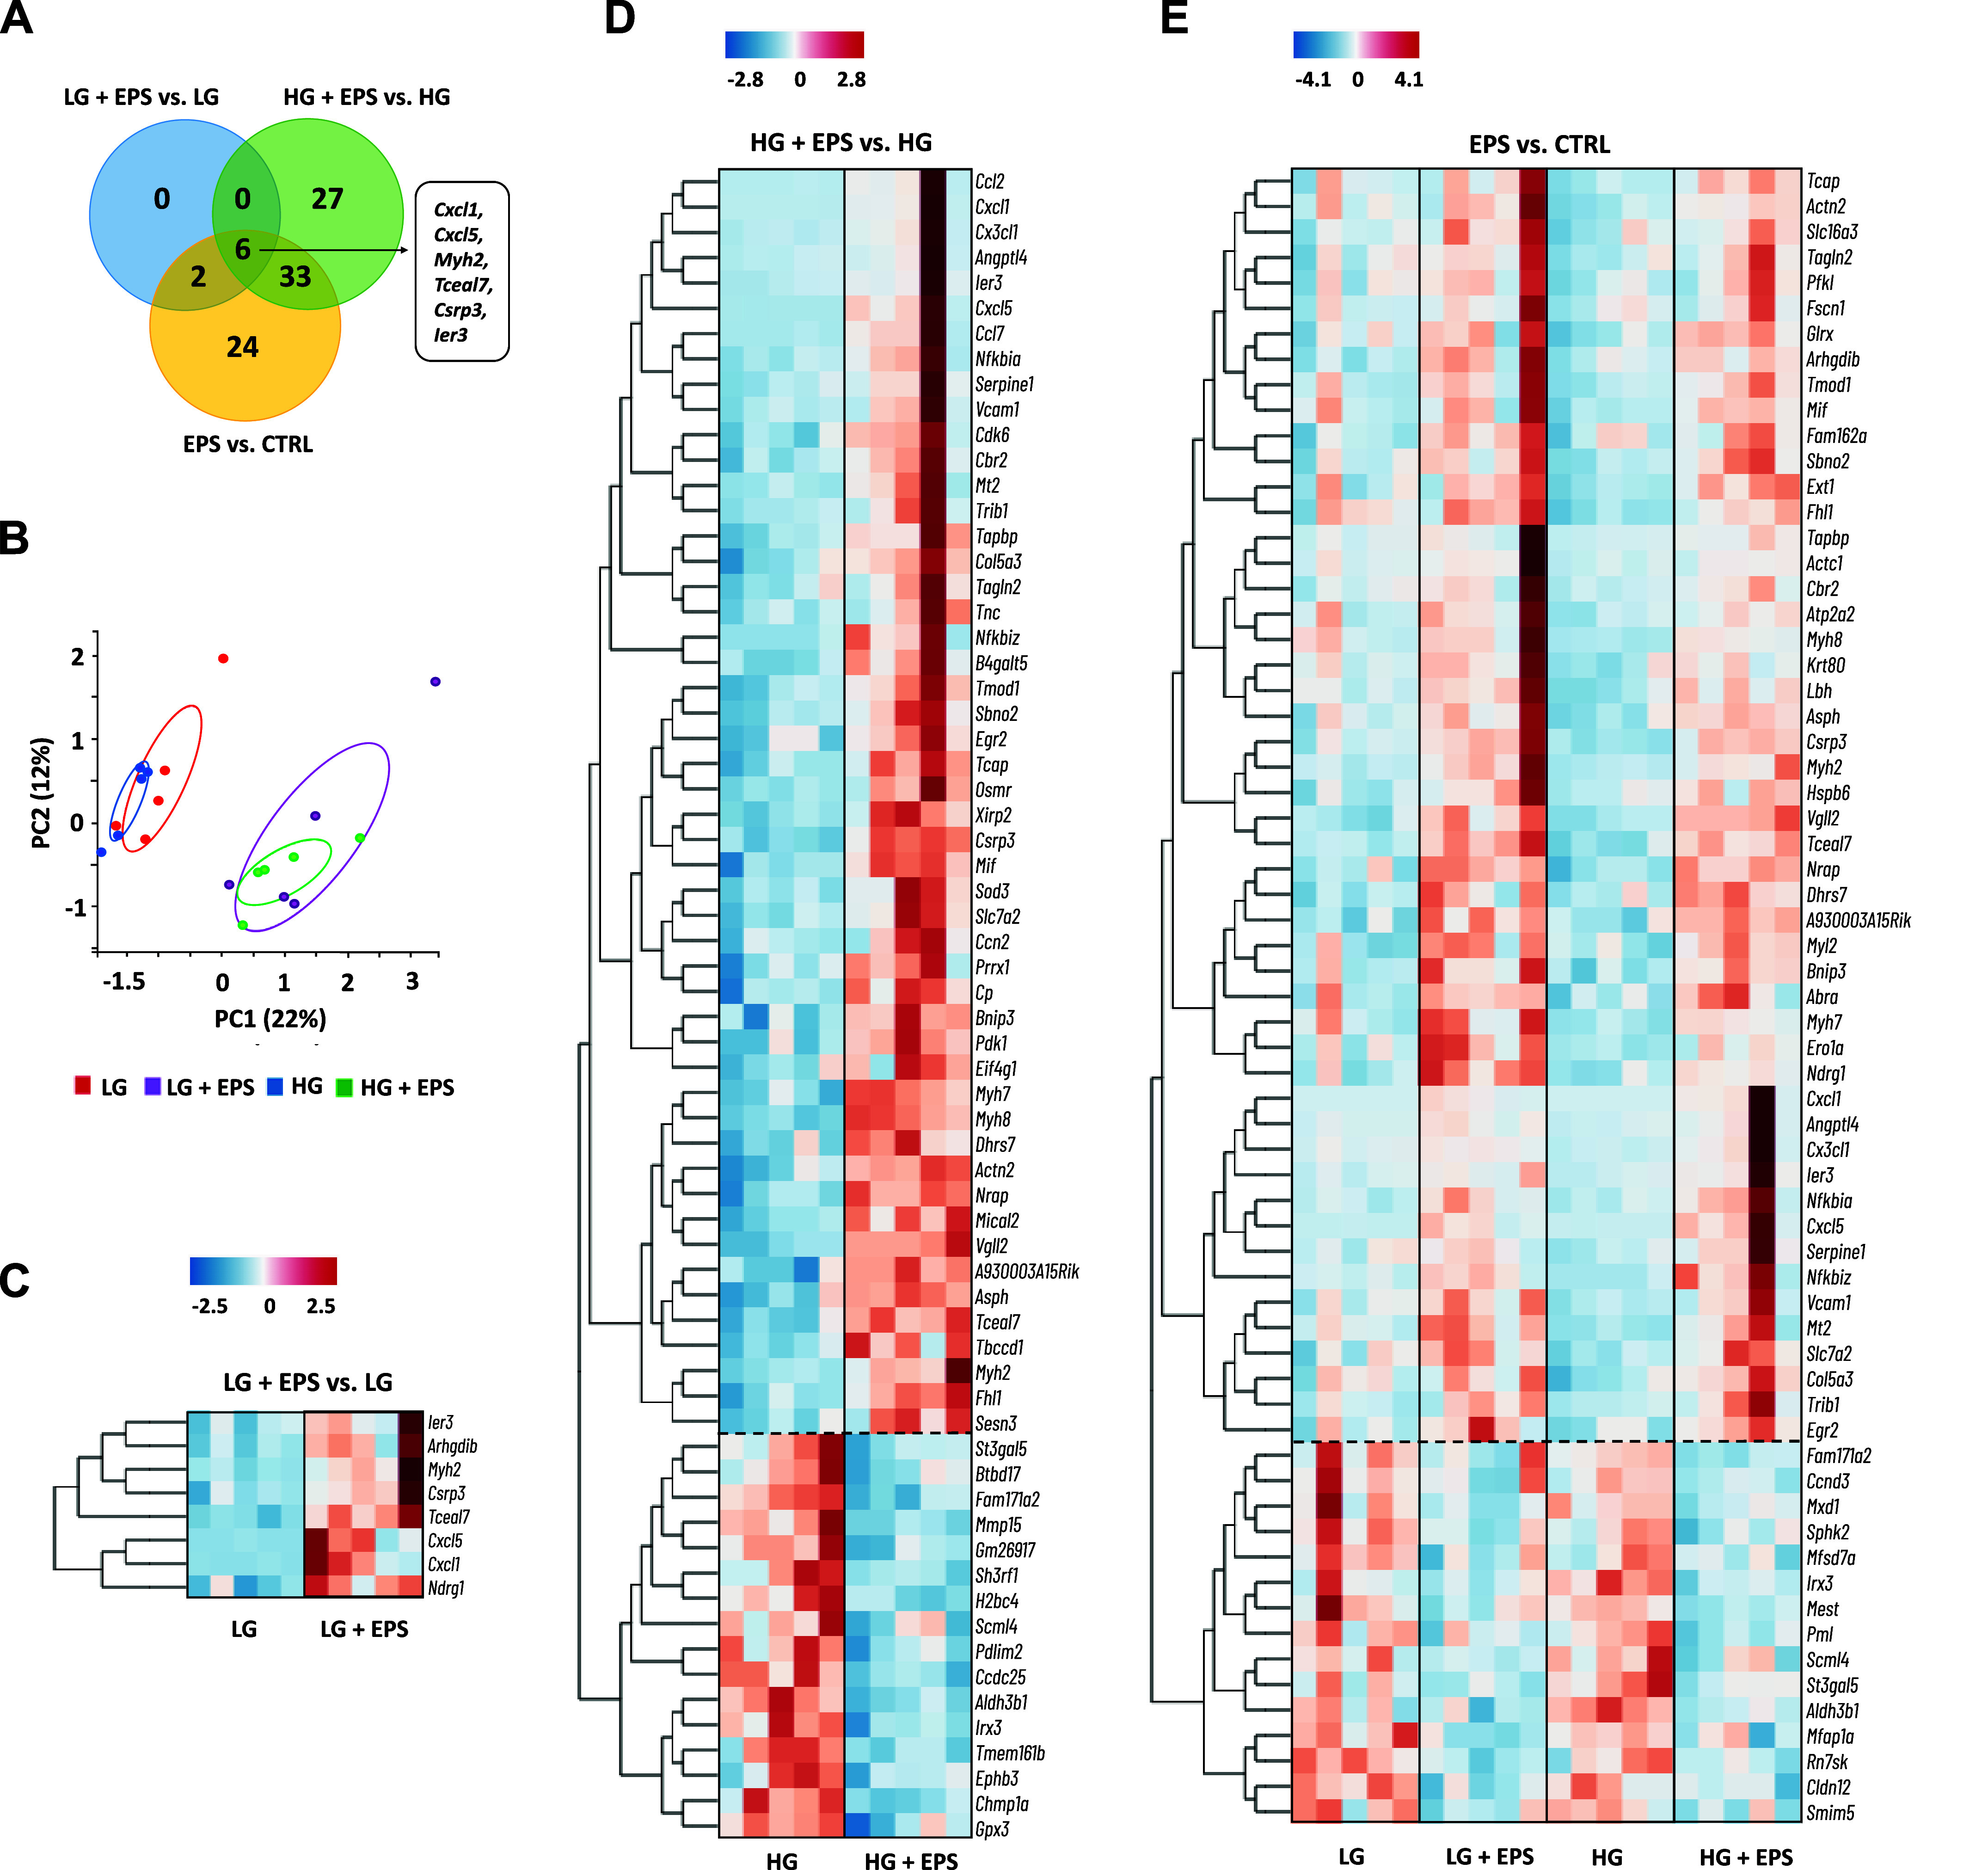
The effects of exercise-like electrical pulse stimulation (EL-EPS, EPS in the figure) and media glucose availability on the C2C12 myotube transcriptome. A: Venn graph of the differentially expressed genes (DEGs). B: principal component analysis (PCA) of the DEGs. The read counts were used to create the PCA score plot. The heat map categorization of the DEGs after EL-EPS in low (C) and high glucose (D) (LG and HG, respectively) condition as well as in the pool of the stimulated vs. non-stimulated samples (EPS vs. CTRL) (E). The dashed lines cluster the DEGs that respond similarly to EL-EPS in each comparison. The heat map categorization is based on k-means clustering and the coloring on the z-scores. In A, false discovery rate < 0.05 and fold change >|1.2 |. n = 5 per group except in EPS vs. CTRL, n = 10 per group.
To complement the mRNA-seq results, we analyzed the expression of a few of the most upregulated and downregulated genes by RT-qPCR. Concordantly with the mRNA-seq results, in comparison with nonstimulated myotubes, the expression of Cxcl1, Cxcl5, and Tceal7 were higher (EPS main effects, P < 0.05) and Scml4 was lower (EPS main effect, P = 0.057) in the EL-EPS-stimulated myotubes (Fig. 3, A–D).
Figure 3.

Complementary analysis of the mRNA-seq results after exercise-like electrical pulse stimulation (EL-EPS, EPS in the figure) by RT-qPCR. The mRNA expression of Cxcl1 (A), Cxcl5 (B), Tceal7 (C), and Scml4 (D). For the analysis of EL-EPS and media glucose content (EPS and HG main effects, respectively) and their interaction effect, the two-way MANOVA was used. The group comparisons were analyzed with multivariate Tukey’s test. In the figures, the values are presented as normalized to low glucose (LG) = 1 or high glucose (HG) = 1. n = 3–4 per group. *P < 0.05 and ***P < 0.001, respectively.
Pathways Related to Myotube Contractibility and Inflammatory Responses Were Upregulated in Response to EL-EPS Independent of the Glucose Availability
To understand the pathways to which the identified DEGs belong, we conducted bioinformatic analyses using Gene Set Enrichment Analysis (GSEA) and Ingenuity Pathway Analysis (IPA). The GSEA analysis was performed by using the Gene Ontology Biological Processes (GOPB) database (Fig. 4, A and B), and for completeness, this analysis was also run with Kyoto Encyclopedia of Genes and Genomes (KEGG) and REACTOME databases (Supplemental Fig. S1 and Supplemental Table S1). Regardless of the database used, we found that the enriched pathways after EL-EPS were mainly related to muscle architecture and contractile ability as well as cytokine and inflammatory responses, independent of the media glucose availability (Fig. 4, A and B, Supplemental Fig. S1, and Supplemental Table S1). The IPA analyses showed that the DEGs with molecular and cellular functions related to growth, proliferation, development, movement, assembly, and organization were upregulated by EL-EPS as were intercellular signaling and interaction pathways. To complement GSEA and IPA analyses, ShinyGo analysis was conducted. By using this approach, we observed that EL-EPS induced 180 enriched GOPBs, nine KEGG, four REACTOME, nine Gene Ontology Molecular Functions, and 13 Gene Ontology Cellular Component (FDR < 0.05, Supplemental Table S2). With ShinyGO, many processes were similar as with GSEA and IPA in response to EL-EPS, including processes related to contractility and inflammatory response (Fig. 4, Supplemental Fig. S1, Supplental Table S1, and Supplemental Table S2).
Figure 4.
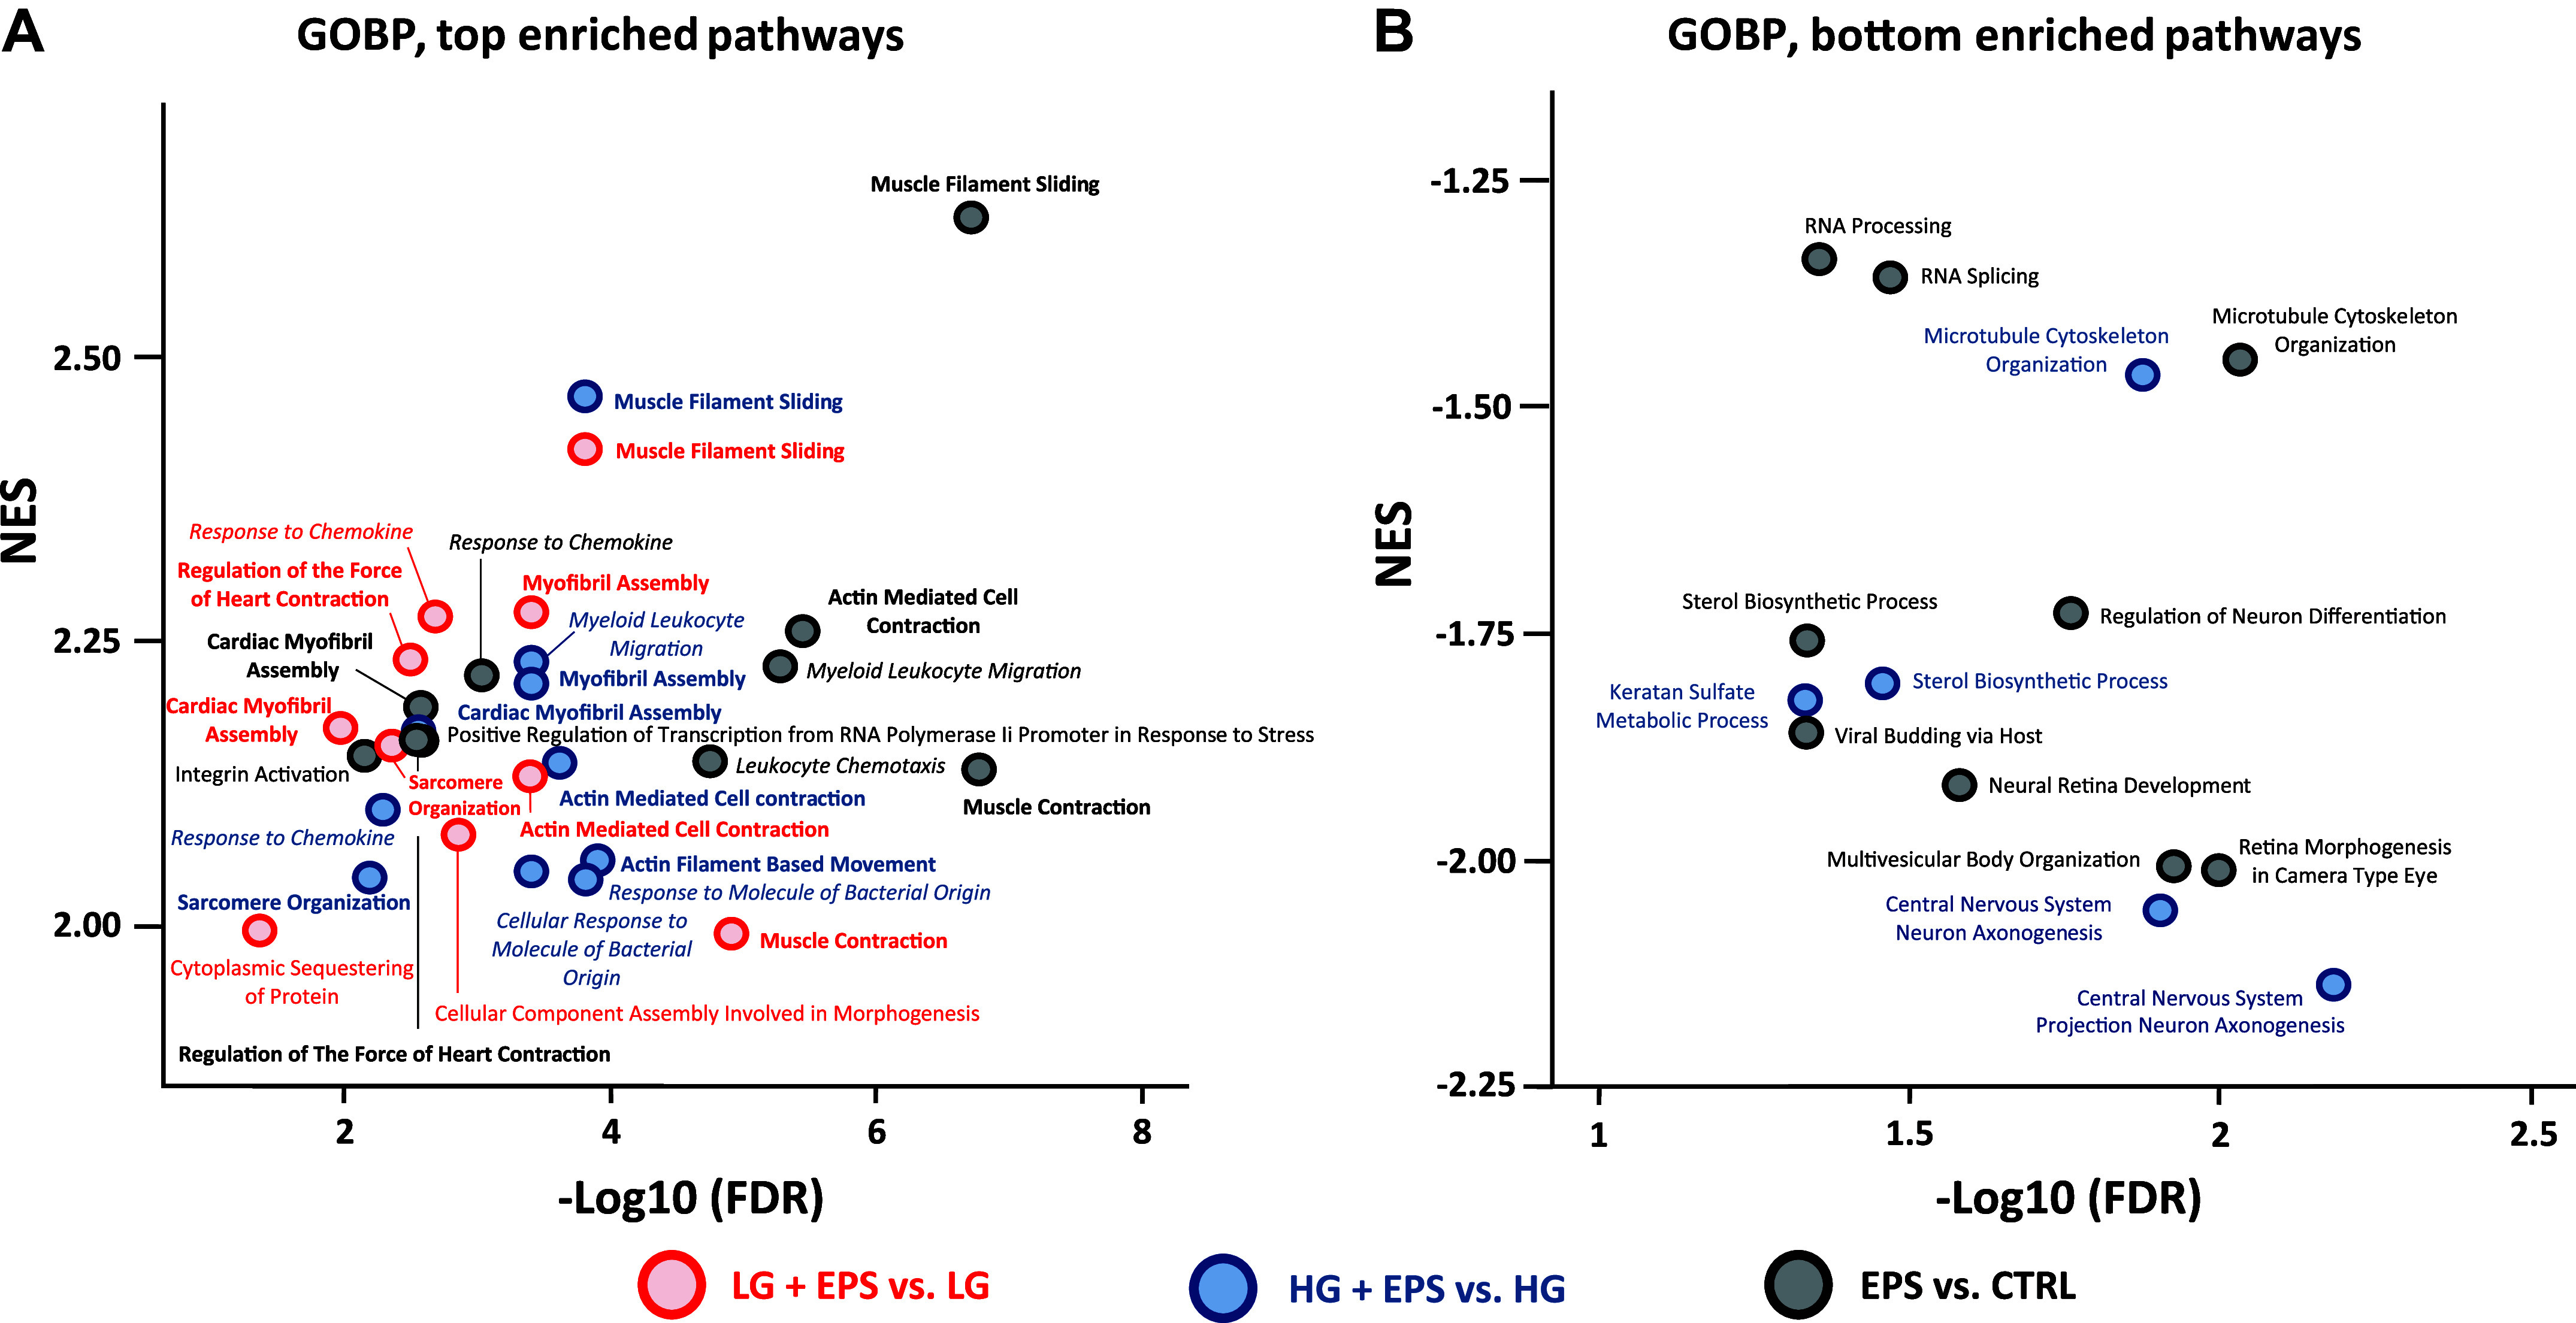
The top ten top (A) and bottom (B) pathways after exercise-like electrical pulse stimulation (EL-EPS, EPS in the figure) on the C2C12 myotubes. The bioinformatic gene set enrichment analysis (GSEA) pathway analyses were conducted by using Gene Ontology Biological Processes (GOPB) database. Data in the figures are categorized by normalized enrichment scores (NES) and −Log10 of false discovery rate (FDR) values. Note that FDR < 0.05 equals >1.3 in −Log10 (FDR) scale and for clarity, the X- and Y-axes do not start at zero for the plots. Bold = pathway related to contractility and/or muscle structure, italics = pathway related to cytokine and other inflammatory responses. n = 5 per group except for a pool of stimulated vs. non-stimulated (EPS vs. CTRL) comparison, n = 10 per group.
Notably, we aimed to compare our previous metabolomics (8) and the present transcriptomics data to conduct trans-omic analyses using Metscape module in the Cytoscape platform (https://cytoscape.org). Our 1H-NMR metabolomics revealed significant changes in energy metabolism-related intermediates (8), whereas only a small number of changes in metabolic DEGs were observed in the present study. Given the paucity of metabolic transcriptional changes, MetScape analysis did not reveal interactions between the omics.
It is interesting to note that there were very few alterations in metabolic pathways identified in any of the datasets. Using the KEGG database, we observed an increase in the normalized enrichment score (NES) in oxidative phosphorylation in response to myotube contractions in LG conditions along with an increase in both the pentose phosphate pathway (PPP) and fructose and mannose metabolism in stimulated versus nonstimulated conditions (EPS vs. CTRL, Supplemental Fig. S1 and Supplemental Table S1). The REACTOME database revealed an increase in the tricarboxylic acid cycle and respiratory electron transport in response to myotube contractions in LG conditions (Supplemental Fig. S1 and Supplemental Table S1).
To elucidate whether the activities of some of the pathways suggested by the bioinformatic analyses were affected at the protein level, we analyzed the myosin heavy chain 1 isoform (MF 20) content and cytokine/inflammatory pathways (CCL2, p-C/EBPβThr235 p-IKKα/βSer176/180, p-Iκβ/αSer32/36, p-NF-κBSer536, p-STAT3Tyr705, and STAT3) from the C2C12 myotubes after EL-EPS. Of these, when compared with the respective controls, the phosphorylation of NF-κBSer536 was greater in response to EL-EPS and media glucose content (EPS main effect, P < 0.05 and glucose main effect, P < 0.01, respectively, Fig. 5A). The phosphorylation level or the content of CCL2, MF 20, STAT3Tyr705, and total STAT3 remained unaffected (Fig. 5, B–E), whereas p-C/EBPβThr235, p-IKKα/βSer176/180, and p-Iκβ/αSer32/36 were undetected.
Figure 5.
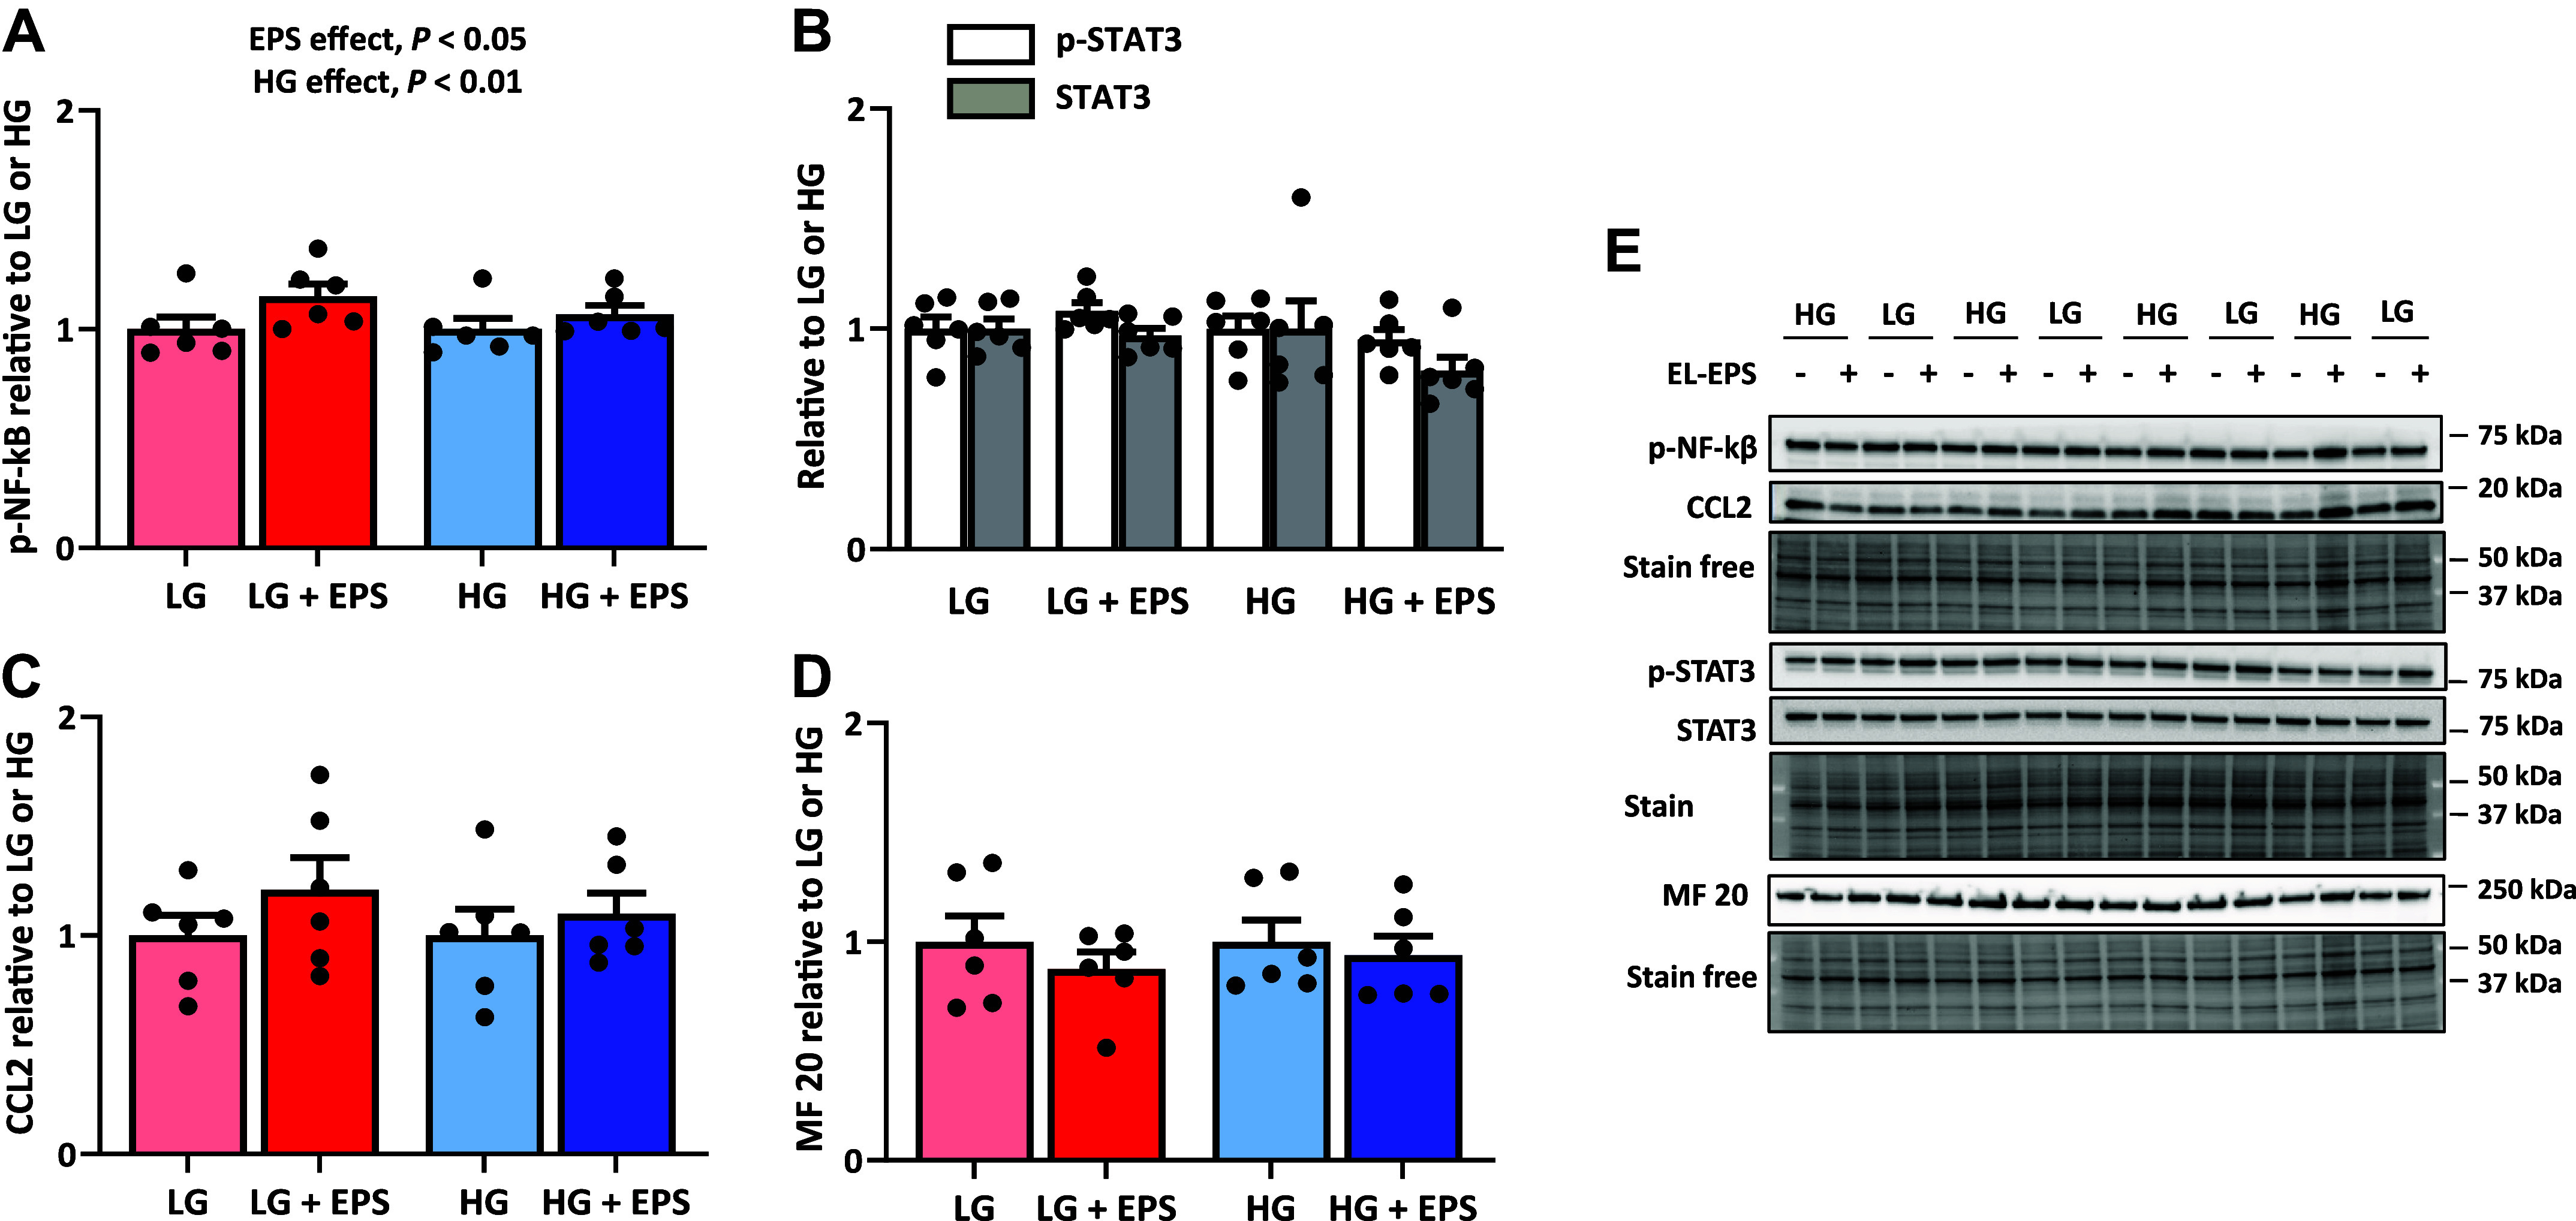
The effects of the exercise-like electrical pulse stimulation (EL-EPS, EPS in the figure) and media glucose content on cytokine and inflammatory signaling as well as on contractile protein. Phosphorylated NF-κBSer536 (A), phosphorylated STAT3Tyr705 and total STAT3 (B), CCL2 (C) and myosin heavy chain 1 (MF 20) (D). E: representative blots. −, no stimulation; +, stimulation. In the figures, the values are presented as normalized to low glucose (LG) = 1 or high glucose (HG) = 1. The two-way MANOVA was used to analyze EL-EPS and media glucose content effects (EPS and HG main effects, respectively) and their interaction effect, whereas group comparisons were analyzed with multivariate Tukey’s test. n = 6 per group.
Although Media Glucose Content Had Greater Effects on EV miRNAs than EL-EPS, Packing of Exercise-Responsive miR-1-3p into EVs Was Greater after Stimulation
To elucidate whether miRNA release occurs in cultured myotubes in response to EL-EPS, we collected the cell culture media, extracted the EVs, and analyzed the representative samples using nanoparticle tracking analysis and electron microscopy. Based on the nanoparticle tracking analysis of the representative samples, the EV number appears to be greater in the HG media and lower in LG media of the stimulated myotubes in comparison to nonstimulated myotubes, while electron microscopy showed that the extracted EVs were of the expected size (∼100 nm) in all conditions (Supplemental Fig. S2).
Next, we analyzed EV samples using sRNA-seq. Our sRNA-seq data showed that the C2C12 myotubes release EVs with similar miRNA content as previously reported for in vivo skeletal muscle (13), including miR-206-3p, miR-1-3p, and miR-133a-3p (Fig. 6A, Supplemental Table S2). Further data analysis of the top 50 most abundant miRNAs showed that media glucose availability had a greater effect on EV miRNA content than EL-EPS. In more detail, based on the heat map clustering, eight miRNAs were affected by media glucose content and none by the EL-EPS. More specifically, the content of miR-196a-5p, let-7f-5p, and miR-26a-5p in EVs were higher in HG conditions, whereas miR-378c, miR-378a-3p, miR-322-5p, miR-140-3p, and miR-19b-3p were higher in LG conditions (HG main effect, P < 0.05, Fig. 6B). However, when we further analyzed all the 163 miRNAs using PERMANOVA analysis, we found no differences between any of the groups. In addition to sRNA-seq, we used RT-qPCR to analyze the expression of a few best-known exercise-responsive miRNAs from the EVs. Based on these analyses, we demonstrate that similar to in vivo exercise, myotube contractions increased the packing of specific miRNAs to the released EVs. More specifically, when compared with the respective controls, the expression of miR-1-3p was greater in response to EL-EPS (EPS effect, P < 0.05), whereas miR-206-3p expression tended to be greater (EPS effect, P = 0.074) (Fig. 6, C and D). Numerically miR-133a-3p also increased by several folds, but due to high intersample variation, this result was nonsignificant (EPS effect, P = 0.242) (Fig. 6E).
Figure 6.
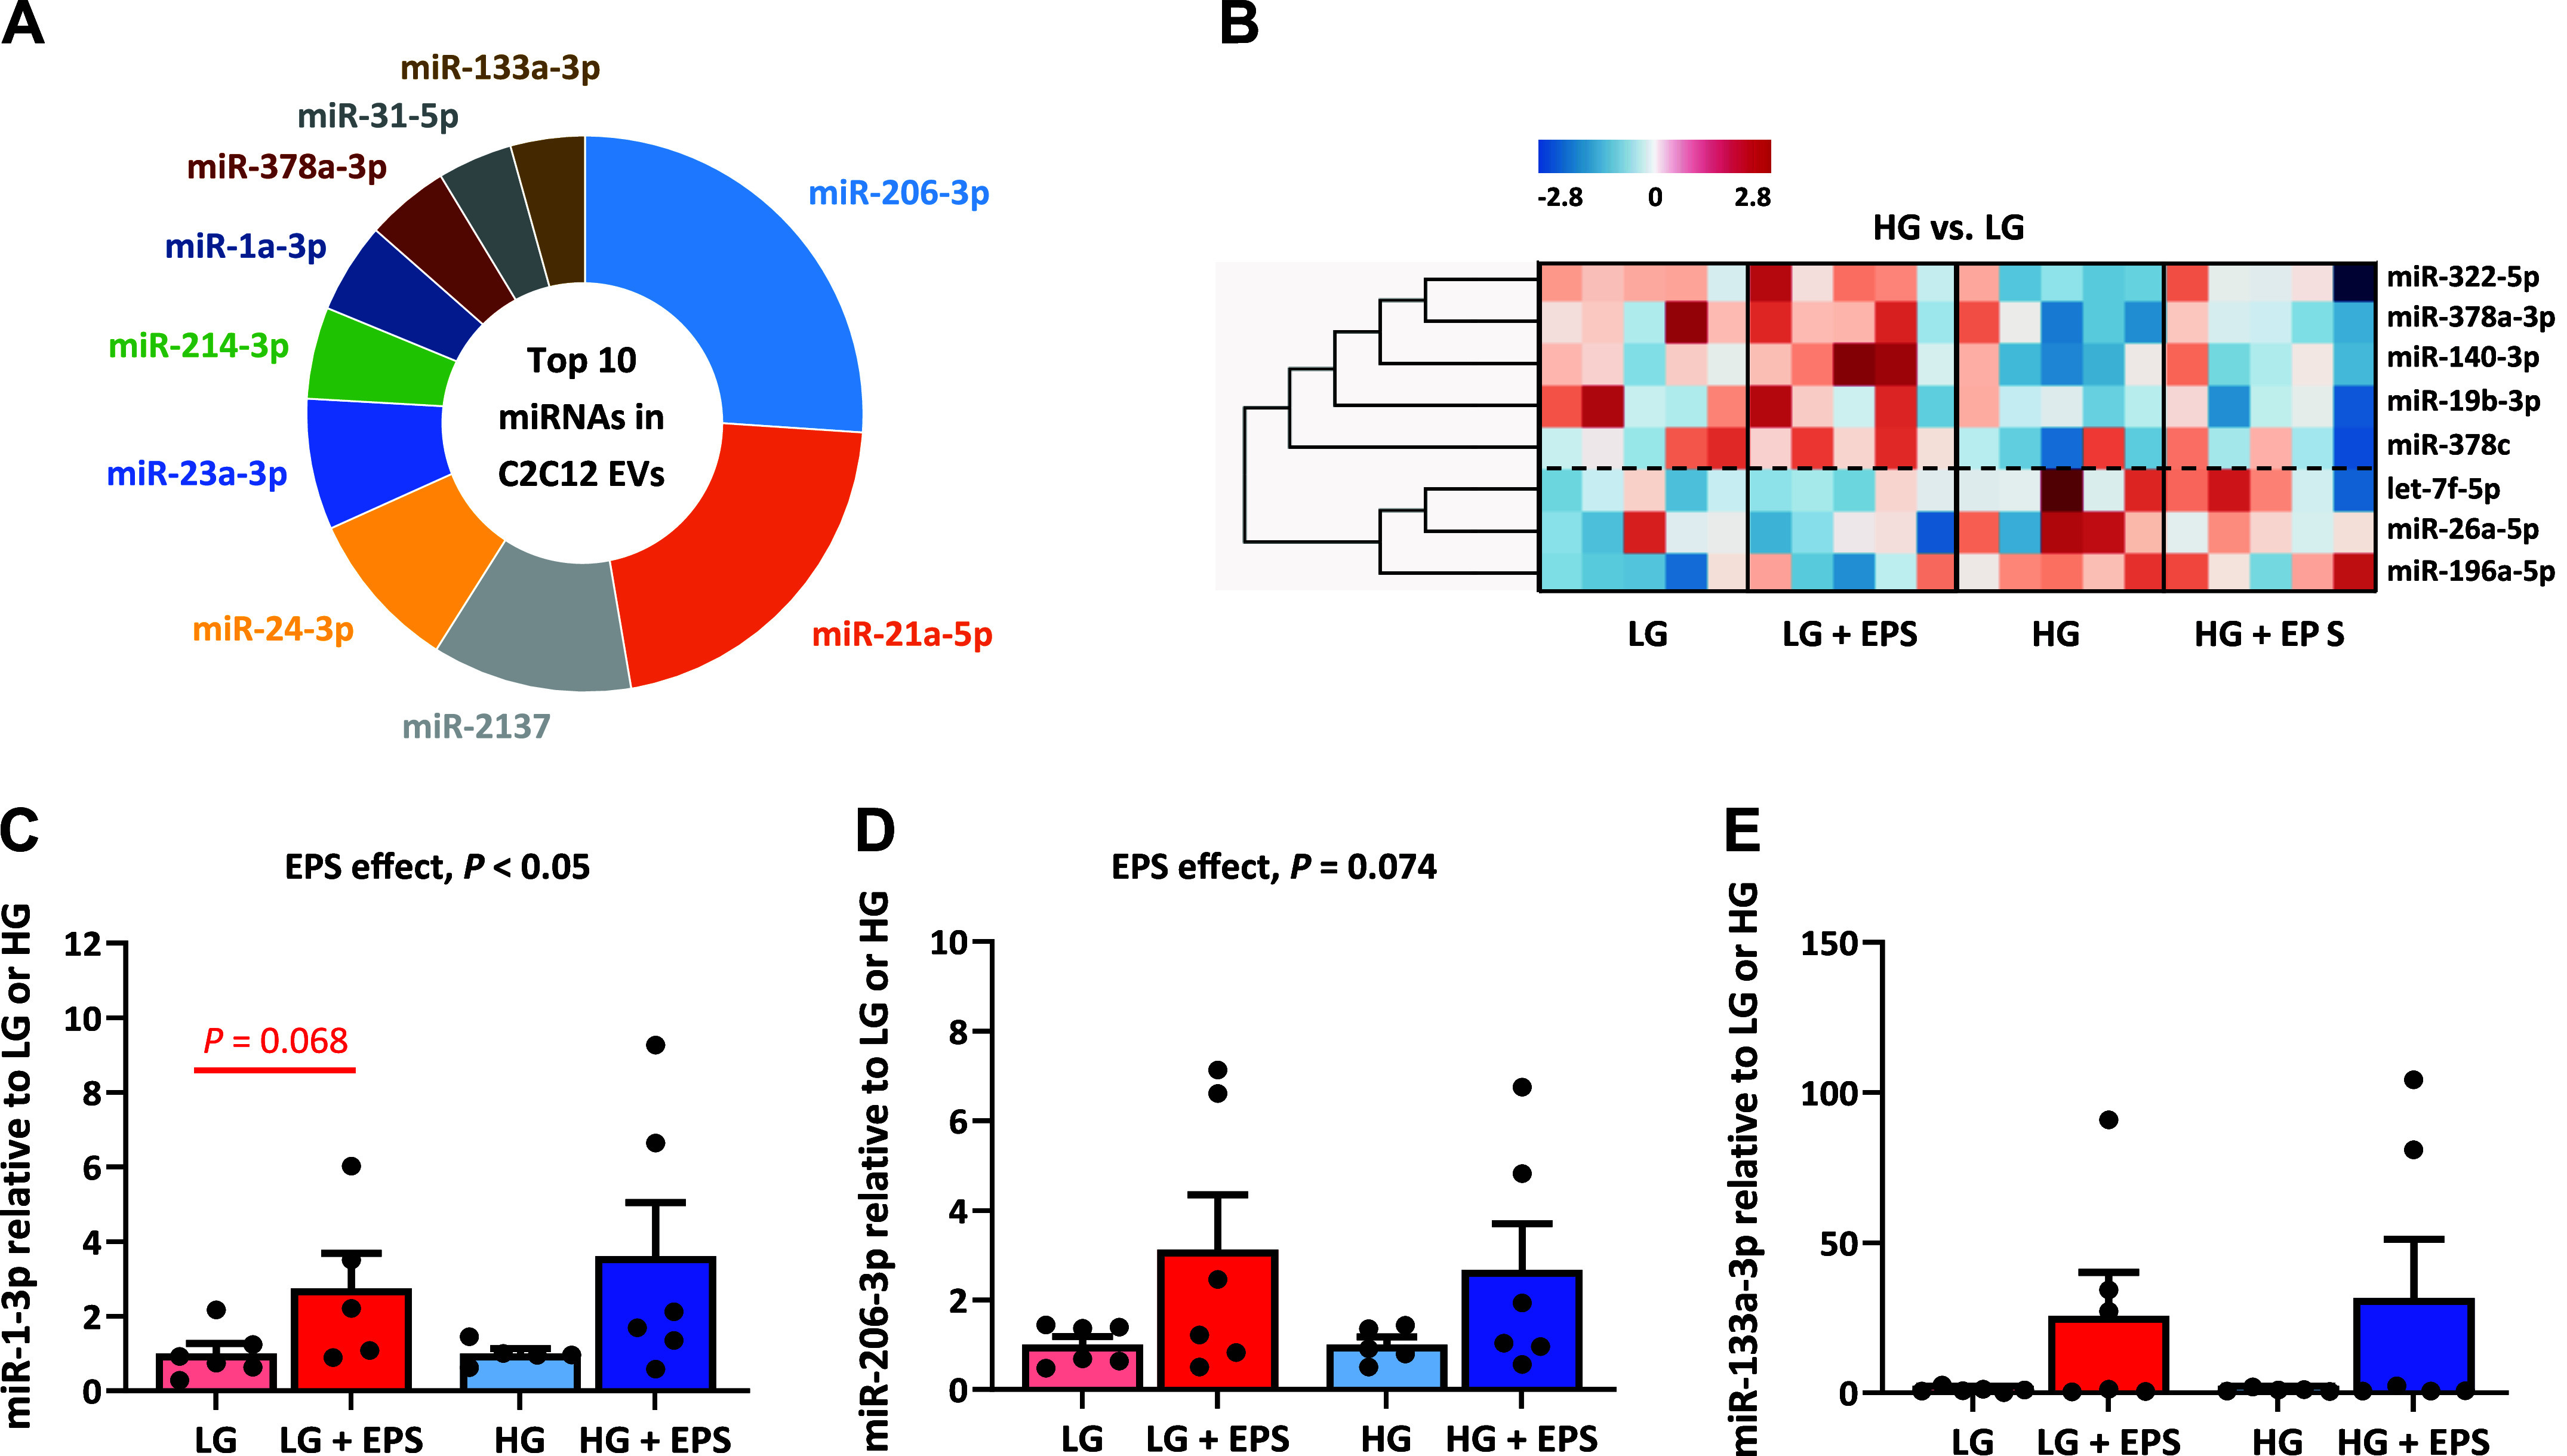
The effects of the exercise-like electrical pulse stimulation (EL-EPS, EPS in the figure) on the extracellular vesicle (EV) microRNA (miRNA) content. A: top 10 miRNAs in the C2C12 cell-derived EVs based on small RNA sequencing. The proportions represent the percentage of the top 50 miRNAs analyzed. All four groups were pooled for the analysis. B: the heat map categorization of the EV-derived miRNAs in the pool of the high and low glucose samples (HG vs. LG, respectively). The dashed line clusters the miRNAs that respond similarly to the media glucose content. The heat map categorization is based on k-means clustering and the coloring on the z-scores. The expression of miR-1-3p (C), miR-206-3p (D), and miR-133a-3p (E) analyzed by RT-qPCR. The values are presented as normalized to LG or HG = 1. In B, the two-way MANOVA was used to analyze EL-EPS and media glucose content effects (EPS and HG main effects, respectively) and their interaction effect, whereas group comparisons were analyzed with multivariate Tukey’s test. In C–E, EPS and HG effects as well as the group comparisons were conducted using Mann–Whitney U test. In A, n = 20, in B, n = 10 per group (HG vs. LG), and in C–E, n = 5–6 per group.
DISCUSSION
The number of in vitro studies examining transcriptional changes after EL-EPS has increased rapidly in recent years (10, 39–45), but, to our knowledge, studies investigating the interaction between nutritional availability and exercise responses are lacking. In the present study, we demonstrate that the contraction-induced changes in the C2C12 myotube transcriptome including reorganization of contractile units and cytokine/inflammatory responses were amplified under high glucose compared with low glucose conditions. This supports our previous metabolomics findings showing that higher glucose availability augmented metabolic responses in the contracting C2C12 myotubes (8). Notably, more DEGs and pathways were upregulated than downregulated in response to myotube contractions, which suggests that especially under high glucose condition, the repressors of transcription were overrun by the activators. Furthermore, to the best of our knowledge, this is the first study to analyze skeletal muscle cell-derived EVs and their miRNA content after EL-EPS conducted under variable nutritional conditions. We report that several miRNAs were released from the C2C12 myotube-derived EVs and show that the packing of miR-1-3p into the EVs was increased in response to myotube contractions independent of the glucose availability. Our sRNA-seq findings, however, suggest that glucose availability has more prominent effects on myotube EV miRNA content than the EL-EPS.
Based on the pathway analyses, the most upregulated cellular processes after EL-EPS were related to myotube contraction and structural modifications as well as cytokine and other inflammatory responses. The myotubes do not contract immediately after EL-EPS due to the lack of adequate sarcomere architecture (46). De novo sarcomere assembly and reorganization of the cytoskeleton are needed for the visible contractions and thus it is reasonable that muscle filament sliding, myofibril assembly, sarcomere organization, and muscle contraction pathways were upregulated in response to EL-EPS independent of the glucose availability. We showed in agreement with previous findings (10, 47) that although the gene expression of different myosin heavy chain isoforms was upregulated in response to myotube contractions especially when more glucose was available, the protein level of at least myosin heavy chain 1 isoform remained unaltered. Previously, the absence of mRNA-protein correlations has been explained by the post-transcriptional mechanisms needed for the mRNA to be turned into protein as well as by a broad range of protein half-lives (48). The changes in myosin heavy chain isoforms may be explained by the fact that the skeletal muscle cells in the culture are at variable differentiation stages. Indeed, differentiation of the C2C12 myoblasts into myotubes has been shown to increase the expression of variable myosin heavy chain isoforms (49), while Tceal7, a gene previously related to improved muscle cell differentiation after muscle damage (50) was also upregulated after EL-EPS independent of the glucose availability. Moreover, EL-EPS itself may also promote differentiation and maturation of the myoblasts into myotubes (51, 52). Overall, our results suggest that repeated contractions promoted remodeling of the myotube architecture to promote contractility and possibly differentiation of the cells, especially with high glucose availability.
Similar to in vivo exercise (53), cytokine and other inflammatory pathways including response to chemokine, chemokine signaling pathway, and cytokine signaling in the immune system were enhanced after EL-EPS, and we found that this occurred independent of the glucose availability. Concordantly with the previous EL-EPS studies (39, 41, 54, 55), the expression of the members belonging to the CXC (Cxcl1, Cxcl5, and Cx3cl1) and CC [Ccl2 and Ccl7, also known as monocyte chemoattractant protein (MCP)-1 and MCP-3, respectively] chemokine families were upregulated after EL-EPS, especially with high glucose availability. Others have demonstrated that many of the CXC and CC chemokines are released into the circulation/cell culture media in response to exercise and/or muscle cell/myotube contractions (39, 54–56), probably partly via β2-adrenoceptor antagonist (clenbuterol)-mediated mechanisms (10). In vivo, cytokine and other inflammatory responses induced by acute exercise may promote the infiltration of macrophages into the skeletal muscle (57). This could enhance skeletal muscle regeneration and/or hypertrophy possibly via CXCL1, CX3CL1, and CCL2 (57–59). In vitro, the increased media content of CXCL1 and CXCL5 have been reported to regulate C2C12 myoblast migration and differentiation after EL-EPS (58, 60), while CCL2 release into the media in an NF-κB-dependent manner may promote monocyte chemoattraction in vitro and possibly infiltration in vivo (58). Supporting the potential chemokine and inflammatory signaling after EL-EPS, we observed increased phosphorylation (activation) of NF-κB, which supports some (39, 58), but not all (47) studies. To summarize, together our results show that EL-EPS produced similar cytokine and inflammatory responses in the skeletal muscle cells as does in vivo exercise and that these responses were augmented by higher glucose availability. These processes are important to promote exercise-induced adaptations in the skeletal muscle in vivo (61) but this remains to be demonstrated in vitro.
Besides contractility and inflammation, many metabolic processes were affected by EL-EPS. We have previously reported that EL-EPS enhanced glycolysis in the myotubes based on increased lactate production and release, especially with high glucose availability (8). Here, we report concordantly that the expression of phosphofructokinase liver B-type (Pfkl) and pyruvate dehydrogenase kinase 1 (Pdk1) increased after EL-EPS. Phosphofructokinase is the key enzyme regulating glycolysis. Pyruvate dehydrogenase (PDH) promotes the conversion of pyruvate to acetyl-CoA, whereas enhanced PDK1 activation shifts the conversion of pyruvate towards lactate (62). Previously, the phosphorylated form of PDH has been reported to decrease in the C2C12 cells after EL-EPS (42), which could increase the activity of the PDH enzyme and promote glucose oxidation in the cells, a response we previously reported after EL-EPS (8). In addition to increased lactate synthesis, lactate transport mechanisms may have been enhanced in response to myotube contractions. The solute carrier family 16 member 3 (Slc16a3, also known as MCT4) was upregulated in response to EL-EPS. It belongs to the monocarboxylate cotransporter (MCT) family that transports, e.g., pyruvate and lactate, across different membranes (63). The significance of SLC16A3 in the regulation of lactate efflux might be elevated in glycolytic cells (63) and indeed, the C2C12 myotubes can be considered relatively glycolytic cells (44). Together, the changes we have observed both at the levels of metabolites (8) and transcription in this study show that the production and probably handling of lactate were improved in the C2C12 myotubes in response to EL-EPS. These observations are in accordance with human data on lactate metabolism in response to exercise (64).
In addition to glycolysis, pentose phosphate pathway (PPP), a parallel metabolic pathway to glycolysis, was among the top enriched processes in response to myotube contractions. In accordance, others have previously observed contraction-induced activation of PPP in the C2C12 myotubes after short-term high-frequency EL-EPS (42). They suggested that PPP activation might occur partly via reactive oxygen species (ROS) as well as Akt, extracellular regulated kinase (ERK), and c-Jun N-terminal kinase (JNK) signaling (42). Notably, we have also reported increased JNK phosphorylation after EL-EPS accompanied with increased glycolytic metabolism (8). Parallel to glycolysis, activation of PPP pathway after EL-EPS may be an adaptive response to myotube contractions (42) to support the synthesis of nucleotides, certain aromatic amino acids, and lipids needed, for example, for hypertrophy and membrane recovery (65). Related to PPP activation and ROS, we observed contraction-induced upregulation in the expression of superoxide dismutase 3, extracellular (Sod3) as well as another possibly exercise-responsive (66) redox enzyme participating in antioxidant defense, glutaredoxin (Glrx). In accordance, ROS has been suggested to regulate transcription of antioxidant enzymes including SOD and glutathione peroxidase-1 (GPX1) after in vivo exercise (67). In vitro, others have shown that adequate protection against excessive ROS effects seems to be important to maintain myotube contractility (68) and mitochondrial function (69) during EL-EPS. Thus, future studies are recommended to examine how different EL-EPS protocols affect distinct pathways, including PPP and ROS, and what is their physiological significance.
The circulating miRNAs respond rapidly to exercise stimulus (70), thus making them an interesting group of potential exerkines to study not only in vivo but also in vitro. To date, miRNA studies have focused on in vivo exercise (for review, see Ref. 13, 17) showing that, for example, miR-1, miR-21, miR-133, miR-155, and miR-206 could act as biomarkers of changes in exercise capacity (71). In addition, human primary myotubes have also been previously shown to release miR-1 containing EVs in response to EL-EPS (72). Concordantly with these studies, we demonstrate that miR-1-3p as well as potentially miR-206-3p and miR-133a-3p, were increased in the EVs in response to myotube contractions independent of the media glucose availability thus suggesting these could act as potential exerkines. Among other processes, EV-derived miRNAs have been shown to promote myoblast differentiation (73). More specifically, in the C2C12 cells miR-1 enhanced myogenesis, whereas miR-133a promoted proliferation (74). In addition, miR-206 has been shown to promote the differentiation of the C2C12 cells (75). Beyond differentiation, miR-1 regulates mitochondrial metabolism (76, 77), whereas miR-133a may be an important mediator of exercise-induced adaptations in the skeletal muscle (78). miR-206 is involved in processes related to, but not limited to, skeletal muscle development, growth/adaptation, and regeneration (79). Although in vivo studies have demonstrated that the number of circulating EVs increases during exercise (14), this might not be the case in vitro (80). We observed that the EV number was possibly increased in high, but not in low glucose condition. This suggests that myotube contractions increased the abundance of the miRNAs, but not necessarily the number of EVs. Others have shown that short-term low-frequency EL-EPS had no effects on EV size distribution or protein markers (80). Yet, as in the present study, the EV number was investigated only from a representative sample and not individual samples, this needs to be verified in future studies.
Although both sRNA-seq and RT-qPCR identified similar miRNAs that have been linked to in vivo skeletal muscle and exercise (13, 16), our results were not fully compatible with the methods. Based on the sRNA-seq, media glucose content had greater effects on the EV-carried miRNAs than on EL-EPS, while RT-qPCR showed a contraction-induced increase in the miR-1-3p content, which was not confirmed by sRNA-seq. These observations are likely explained by methodological differences. Most importantly, normalization of the sRNA-seq and RT-qPCR results differ from each other [i.e., trimmed mean of M values (34) vs. spike-in cel-miR-39-3p, respectively]. Furthermore, it has been previously shown that when comparing RT-qPCR to RNA-seq, 15%–20% of protein-coding genes were considered nonconcordant, and these genes were typically lower expressed and shorter (81). Since our study focused on sRNAs that are expressed at relatively low abundancy in cell media EVs, it is likely that these factors, together with the normalization, explain the observed difference between sRNA and RT-qPCR results. Finally, most of the sRNAs identified by sRNA-seq were other than miRNAs, while the RT-qPCR approach used focuses more selectively on miRNAs. To summarize the miRNA results, in agreement with the existing literature, we show that miR-1-3p content in the EVs was greater in response to EL-EPS, but more research is needed to gain a comprehensive view of miRNA/sRNA packing and EV release in response to myotube and muscle contractions.
In vivo, greater disturbances in skeletal muscle metabolism are thought to augment exercise-induced adaptations (82). The type, intensity, and duration of exercise can increase the metabolic load in the skeletal muscle and possibly lead to greater adaptations, while nutritional strategies can also be used. Indeed, carbohydrate restriction and training under low carbohydrate availability and glycogen-depleted state have been shown to enhance some of the metabolic adaptations to endurance exercise, such as mitochondrial biogenesis (11). Interestingly, we report here that myotube contractions induced greater responses in the gene expression as well as previously in the metabolites (8) under HG condition. The reason for these responses may be related to the viability of the cells. Our metabolomics studies showed that glucose was almost completely depleted from the media and cells under low glucose condition (8), which may limit the metabolism of these glycolytic C2C12 cells relying heavily on carbohydrate metabolism. However, other processes, such as miRNA packing and previously reported exerkine secretion and fatty acid oxidation (8) were less affected by the media glucose content. To summarize, our current and previous (8) omics analyses suggest that lower glucose availability may compromise contraction-induced effects on the myotubes and result in smaller metabolic perturbations. Notably, based on the analyzed markers, no unique responses or pathways were observed in low glucose condition in response to myotube contractions. Moreover, similar to metabolomics (8), the observed contraction-induced changes at the level of transcription remained either unaltered or less affected when less glucose was available. More research is warranted to study the effects of nutritional availability on myotube metabolism in response to different types of EL-EPS, e.g., stimulation with higher frequency and/or voltage and with shorter durations. It would be important to better understand whether the glucose availability per se influences the contraction-induced responses in the myotubes or can the results be explained by some other mechanisms that occur due to culturing in high or low glucose-containing media. Finally, as higher media glucose content augmented omics responses of the C2C12 myotubes after EL-EPS based on our present and previous (8) experiments, future studies are recommended to consider and report media composition carefully.
Limitations of the Study
Although the use of EL-EPS and myotubes as an in vitro exercise model is well established and we report many similar responses in the myotube gene expression and EV miRNA content as has been reported after in vivo exercise, this approach does not fully represent in vivo exercising human muscle due to the murine origin of the C2C12 cells and the lack of other cell types, such as vascular cells. Moreover, myotube cultures always contain myoblasts, but EL-EPS has been mainly suggested to target myotubes. As an example, interleukin 6, a well-known exerkine, is released mainly from the differentiated and contracting myotubes (83). Thus, caution is needed when interpreting the results in relation to in vivo findings, especially in human studies. In the future, more time course studies are needed to better examine rapid and transient contraction-induced changes, such as cytokine bursts (84) and EV/miRNA responses (85), or delayed metabolic effects, such as myotube hypertrophy (86).
From the methodological point of view, EVs are complicated transport vehicles to work with due to their low abundance in the cell culture media. For example, of the small RNAs analyzed using sRNA-seq, less than 1% were miRNAs. The majority of the RNAs found in EVs were transfer RNAs and ribosomal RNAs. Thus, future studies are recommended to analyze not only these less well-known RNAs using PANDORA-seq (87), but also to pool media from multiple wells for one EV extraction to obtain an adequate amount of starting material for the downstream analyses. Overall, despite the small sample amount, the EV miRNA results presented in this study, especially related to sRNA-seq and nanoparticle tracking analyses, are paving the way for more in-depth analysis in the future.
Conclusions
In conclusion, we show that the transcriptional responses of the C2C12 myotubes to EL-EPS were augmented by higher media glucose availability. Based on the pathway analyses, cellular processes including especially contractility and cytokine/inflammatory response were upregulated in response to myotube contractions independent of the media glucose content. However, only modest changes in these pathways were seen at the level of translation/protein phosphorylation. In accordance with the previous literature, we also show that EL-EPS increased myotube release and packing of miR-1-3p into the EVs, showing that as in vivo studies have suggested, this indeed is a potential exerkine. Yet, further studies are warranted to better understand how muscle contractions and different nutritional states regulate miRNA and EV responses. Together our results hopefully enable the development of more realistic in vitro exercise models.
DATA AVAILABILITY
The source data from mRNA (Supplemental Table S4) and sRNA (Supplemental Table S5) sequencing analyses (read counts) are available at https://doi.org/10.6084/m9.figshare.24893274 and https://doi.org/10.6084/m9.figshare.24893277, respectively.
SUPPLEMENTAL MATERIAL
Figure S1: https://doi.org/10.6084/m9.figshare.24893205.
Figure S2: https://doi.org/10.6084/m9.figshare.24893262.
Table S1: https://doi.org/10.6084/m9.figshare.24893265.
Table S2: https://doi.org/10.6084/m9.figshare.24893268.
Table S3: https://doi.org/10.6084/m9.figshare.24893271.
Table S4: https://doi.org/10.6084/m9.figshare.24893274.
Table S5: https://doi.org/10.6084/m9.figshare.24893277.
GRANTS
The study is supported by the Academy of Finland (now Research Council of Finland) Grant Nos. 332946 (to S.K.), 323063 (to M.T.), 275922 (to J.J.H.), and 308042 (to S.P.), Emil Aaltonen Foundation (to J.H.L-K), and the Finnish Cultural Foundation (to J.H.L-K.). T. M. O. was supported by grants from the National Institutes of Health, National Institute of Arthritis and Musculoskeletal and Skin Diseases (P01AG039355 and P30AR072581) and the Additional Ventures, Single Ventricle Research Fund. The Research Council of Finland funded profiling of the University of Jyväskylä (Profi5 301824 funding: Physical ACTivity and health during the human life-Span 2, PACTS2) and the University of Oulu (Profi6 336449 funding: Fibrobesity – Preventing fibrosis related to obesity) also supported the study.
DISCLOSURES
No conflicts of interest, financial or otherwise, are declared by the authors.
AUTHOR CONTRIBUTIONS
J.H.L-K., J.J.H., and S.P. conceived and designed research; J.H.L-K., performed experiments; J.H.L-K., S.K., T-M.K., T.M.O., and M.T. analyzed data; J.H.L-K., S.K. T.M.O., J.J.H., and S.P. interpreted results of experiments; J.H.L-K. and T.M.O. prepared figures; J.H.L-K. drafted manuscript; S.K., T-M.K, T.M.O., M.T., J.J.H., and S.P. edited and revised manuscript; J.H.L-K., S.K., T.-M.K., T.M.O., M.T., J.J.H., and S.P. approved final version of manuscript.
ACKNOWLEDGMENTS
We acknowledge the services of the University of Helsinki: EV core in FIMM Technology Centre supported by HiLIFE and Biocenter Finland for performing nanoparticle tracking analysis and electron microscopy work and Electron Microscopy Unit of the Institute of Biotechnology for providing the facilities. We appreciate the help received from Emeritus Professor Urho Kujala and Associate Professor Eija Laakkonen for the experimental procedures and reagents. We thank Elina Virtanen for the help in sequencing. Medical images in Figure 1 and graphical abstract were obtained from https://smart.servier.com/.
REFERENCES
- 1. Pedersen BK, Saltin B. Exercise as medicine - evidence for prescribing exercise as therapy in 26 different chronic diseases. Scand J Med Sci Sports 25, Suppl 3: 1–72, 2015. doi: 10.1111/sms.12581. [DOI] [PubMed] [Google Scholar]
- 2. Severinsen MCK, Pedersen BK. Muscle–organ crosstalk: the emerging roles of myokines. Endocr Rev 41: 594–609, 2020. [Erratum in Endocr Rev 42: 97–99, 2021]. doi: 10.1210/endrev/bnaa016. [DOI] [PMC free article] [PubMed] [Google Scholar]
- 3. Chow LS, Gerszten RE, Taylor JM, Pedersen BK, van Praag H, Trappe S, Febbraio MA, Galis ZS, Gao Y, Haus JM, Lanza IR, Lavie CJ, Lee C-H, Lucia A, Moro C, Pandey A, Robbins JM, Stanford KI, Thackray AE, Villeda S, Watt MJ, Xia A, Zierath JR, Goodpaster BH, Snyder MP. Exerkines in health, resilience and disease. Nat Rev Endocrinol 18: 273–289, 2022. doi: 10.1038/s41574-022-00641-2. [DOI] [PMC free article] [PubMed] [Google Scholar]
- 4. Safdar A, Saleem A, Tarnopolsky MA. The potential of endurance exercise-derived exosomes to treat metabolic diseases. Nat Rev Endocrinol 12: 504–517, 2016. doi: 10.1038/nrendo.2016.76. [DOI] [PubMed] [Google Scholar]
- 5. Carter S, Solomon TPJ. In vitro experimental models for examining the skeletal muscle cell biology of exercise: the possibilities, challenges and future developments. Pflugers Arch 471: 413–429, 2019. doi: 10.1007/s00424-018-2210-4. [DOI] [PubMed] [Google Scholar]
- 6. Nikolić N, Görgens SW, Thoresen GH, Aas V, Eckel J, Eckardt K. Electrical pulse stimulation of cultured skeletal muscle cells as a model for in vitro exercise - possibilities and limitations. Acta Physiol (Oxf) 220: 310–331, 2017. doi: 10.1111/apha.12830. [DOI] [PubMed] [Google Scholar]
- 7. Lautaoja JH, Turner DC, Sharples AP, Kivelä R, Pekkala S, Hulmi JJ, Ylä-Outinen L. Mimicking exercise in vitro: effects of myotube contractions and mechanical stretch on omics. Am J Physiol Cell Physiol 324: C886–C892, 2023. doi: 10.1152/ajpcell.00586.2022. [DOI] [PubMed] [Google Scholar]
- 8. Lautaoja JH, O'Connell MT, Mäntyselkä S, Peräkylä J, Kainulainen H, Pekkala S, Permi P, Hulmi JJ. Higher glucose availability augments the metabolic responses of the C2C12 myotubes to exercise-like electrical pulse stimulation. Am J Physiol Endocrinol Physiol 321: E229–E245, 2021. doi: 10.1152/ajpendo.00133.2021. [DOI] [PMC free article] [PubMed] [Google Scholar]
- 9. MacDonald TL, Pattamaprapanont P, Pathak P, Fernandez N, Freitas EC, Hafida S, Mitri J, Britton SL, Koch LG, Lessard SJ. Hyperglycaemia is associated with impaired muscle signalling and aerobic adaptation to exercise. Nat Metab 2: 902–917, 2020. doi: 10.1038/s42255-020-0240-7. [DOI] [PMC free article] [PubMed] [Google Scholar]
- 10. Fukushima T, Takata M, Kato A, Uchida T, Nikawa T, Sakakibara I. Transcriptome analyses of in vitro exercise models by clenbuterol supplementation or electrical pulse stimulation. Appl Sci 11: 10436, 2021. doi: 10.3390/app112110436. [DOI] [Google Scholar]
- 11. Hawley JA. Sending the signal: muscle glycogen availability as a regulator of training adaptation. In: Hormones, Metabolism and the Benefits of Exercise. Research and Perspectives in Endocrine Interactions, edited by Spiegelman B. Cham: Springer, 2017, p. 43–55. [Google Scholar]
- 12. Wang H, Wang B. Extracellular vesicle microRNAs mediate skeletal muscle myogenesis and disease. Biomed Rep 5: 296–300, 2016. doi: 10.3892/br.2016.725. [DOI] [PMC free article] [PubMed] [Google Scholar]
- 13. Vechetti IJ, Valentino T, Mobley CB, McCarthy JJ. The role of extracellular vesicles in skeletal muscle and systematic adaptation to exercise. J Physiol 599: 845–861, 2021. doi: 10.1113/JP278929. [DOI] [PMC free article] [PubMed] [Google Scholar]
- 14. Whitham M, Parker BL, Friedrichsen M, Hingst JR, Hjorth M, Hughes WE, Egan CL, Cron L, Watt KI, Kuchel RP, Jayasooriah N, Estevez E, Petzold T, Suter CM, Gregorevic P, Kiens B, Richter EA, James DE, Wojtaszewski JFP, Febbraio MA. Extracellular vesicles provide a means for tissue crosstalk during exercise. Cell Metab 27: 237–251.e4, 2018. doi: 10.1016/j.cmet.2017.12.001. [DOI] [PubMed] [Google Scholar]
- 15. Karvinen S, Korhonen T, Sievänen T, Karppinen JE, Juppi H, Jakoaho V, Kujala UM, Laukkanen JA, Lehti M, Laakkonen EK. Extracellular vesicles and high‐density lipoproteins: Exercise and oestrogen‐responsive small RNA carriers. J Extracell Vesicles 12: e12308, 2023. doi: 10.1002/jev2.12308. [DOI] [PMC free article] [PubMed] [Google Scholar]
- 16. Siqueira IR, Palazzo RP, Cechinel LR. Circulating extracellular vesicles delivering beneficial cargo as key players in exercise effects. Free Radic Biol Med 172: 273–285, 2021. doi: 10.1016/j.freeradbiomed.2021.06.007. [DOI] [PubMed] [Google Scholar]
- 17. Nederveen JP, Warnier G, Di Carlo A, Nilsson MI, Tarnopolsky MA. Extracellular vesicles and exosomes: insights from exercise science. Front Physiol 11: 604274, 2020. doi: 10.3389/fphys.2020.604274. [DOI] [PMC free article] [PubMed] [Google Scholar]
- 18. van Niel G, D'Angelo G, Raposo G. Shedding light on the cell biology of extracellular vesicles. Nat Rev Mol Cell Biol 19: 213–228, 2018. doi: 10.1038/nrm.2017.125. [DOI] [PubMed] [Google Scholar]
- 19. Lautaoja JH, Pekkala S, Pasternack A, Laitinen M, Ritvos O, Hulmi JJ. Differentiation of murine C2C12 myoblasts strongly reduces the effects of myostatin on intracellular signaling. Biomolecules 10: 695, 2020. doi: 10.3390/biom10050695. [DOI] [PMC free article] [PubMed] [Google Scholar]
- 20. Furuichi Y, Manabe Y, Takagi M, Aoki M, Fujii NL. Evidence for acute contraction-induced myokine secretion by C2C12 myotubes. PLoS One 13: e0206146, 2018. doi: 10.1371/journal.pone.0206146. [DOI] [PMC free article] [PubMed] [Google Scholar]
- 21. Simonsen JB. What are we looking at? extracellular vesicles, lipoproteins, or both? Circ Res 121: 920–922, 2017. doi: 10.1161/CIRCRESAHA.117.311767. [DOI] [PubMed] [Google Scholar]
- 22. Evtushenko EG, Bagrov D. V, Lazarev VN, Livshits MA, Khomyakova E. Adsorption of extracellular vesicles onto the tube walls during storage in solution. PLoS One 15: e0243738, 2020. doi: 10.1371/journal.pone.0243738. [DOI] [PMC free article] [PubMed] [Google Scholar]
- 23. Karvinen S, Sievänen T, Karppinen JE, Hautasaari P, Bart G, Samoylenko A, Vainio SJ, Ahtiainen JP, Laakkonen EK, Kujala UM. MicroRNAs in extracellular vesicles in sweat change in response to endurance exercise. Front Physiol 11: 676, 2020. doi: 10.3389/fphys.2020.00676. [DOI] [PMC free article] [PubMed] [Google Scholar]
- 24. Puhka M, Nordberg ME, Valkonen S, Rannikko A, Kallioniemi O, Siljander P, Af Hällström TM. KeepEX, a simple dilution protocol for improving extracellular vesicle yields from urine. Eur J Pharm Sci 98: 30–39, 2017. doi: 10.1016/j.ejps.2016.10.021. [DOI] [PubMed] [Google Scholar]
- 25. Driuchina A, Hintikka J, Lehtonen M, Keski-Rahkonen P, O’Connell T, Juvonen R, Kuula J, Hakkarainen A, Laukkanen JA, Mäkinen E, Lensu S, Pietiläinen KH, Pekkala S. Identification of gut microbial lysine and histidine degradation and CYP-dependent metabolites as biomarkers of fatty liver disease. mBio 14: e0266322, 2023., doi: 10.1128/mbio.02663-22. [DOI] [PMC free article] [PubMed] [Google Scholar]
- 26. Lautaoja JH, Lalowski M, Nissinen TA, Hentilä J, Shi Y, Ritvos O, Cheng S, Hulmi JJ. Muscle and serum metabolomes are dysregulated in colon-26 tumor-bearing mice despite amelioration of cachexia with activin receptor type 2B ligand blockade. Am J Physiol Endocrinol Physiol 316: E852–E865, 2019. doi: 10.1152/ajpendo.00526.2018. [DOI] [PubMed] [Google Scholar]
- 27. Kallio MA, Tuimala JT, Hupponen T, Klemelä P, Gentile M, Scheinin I, Koski M, Käki J, Korpelainen EI. Chipster: user-friendly analysis software for microarray and other high-throughput data. BMC Genomics 12: 507, 2011. doi: 10.1186/1471-2164-12-507. [DOI] [PMC free article] [PubMed] [Google Scholar]
- 28. Ge SX, Jung D, Yao R. ShinyGO: a graphical gene-set enrichment tool for animals and plants. Bioinformatics 36: 2628–2629, 2020. doi: 10.1093/bioinformatics/btz931. [DOI] [PMC free article] [PubMed] [Google Scholar]
- 29. Mootha VK, Lindgren CM, Eriksson K-F, Subramanian A, Sihag S, Lehar J, Puigserver P, Carlsson E, Ridderstråle M, Laurila E, Houstis N, Daly MJ, Patterson N, Mesirov JP, Golub TR, Tamayo P, Spiegelman B, Lander ES, Hirschhorn JN, Altshuler D, Groop LC. PGC-1α-responsive genes involved in oxidative phosphorylation are coordinately downregulated in human diabetes. Nat Genet 34: 267–273, 2003. doi: 10.1038/ng1180. [DOI] [PubMed] [Google Scholar]
- 30. Subramanian A, Tamayo P, Mootha VK, Mukherjee S, Ebert BL, Gillette MA, Paulovich A, Pomeroy SL, Golub TR, Lander ES, Mesirov JP. Gene set enrichment analysis: A knowledge-based approach for interpreting genome-wide expression profiles. Proc Natl Acad Sci USA 102: 15545–15550, 2005. doi: 10.1073/pnas.0506580102. [DOI] [PMC free article] [PubMed] [Google Scholar]
- 31. Kainulainen H, Papaioannou KG, Silvennoinen M, Autio R, Saarela J, Oliveira BM, Nyqvist M, Pasternack A, 't Hoen PAC, Kujala UM, Ritvos O, Hulmi JJ. Myostatin/activin blocking combined with exercise reconditions skeletal muscle expression profile of mdx mice. Mol Cell Endocrinol 399: 131–142, 2015. doi: 10.1016/j.mce.2014.10.001. [DOI] [PubMed] [Google Scholar]
- 32. Amar D, Lindholm ME, Norrbom J, Wheeler MT, Rivas MA, Ashley EA. Time trajectories in the transcriptomic response to exercise - a meta-analysis. Nat Commun 12: 3471, 2021. doi: 10.1038/s41467-021-23579-x. [DOI] [PMC free article] [PubMed] [Google Scholar]
- 33. Graber TG, Maroto R, Thompson J, Widen S, Man Z, Pajski ML, Rasmussen BB. Skeletal muscle transcriptome alterations related to physical function decline in older mice. J Ageing Longev 3: 159–178, 2023. doi: 10.3390/jal3020013. [DOI] [PMC free article] [PubMed] [Google Scholar]
- 34. Robinson MD, Oshlack A. A scaling normalization method for differential expression analysis of RNA-seq data. Genome Biol 11: R25, 2010. doi: 10.1186/gb-2010-11-3-r25. [DOI] [PMC free article] [PubMed] [Google Scholar]
- 35. Robinson MD, McCarthy DJ, Smyth GK. edgeR: a Bioconductor package for differential expression analysis of digital gene expression data. Bioinformatics 26: 139–140, 2010. doi: 10.1093/bioinformatics/btp616. [DOI] [PMC free article] [PubMed] [Google Scholar]
- 36. Oksanen J, Simpson GL, Blanchet FG, Kindt R, Legendre P, Minchin PR, O'Hara RB, Solymos P, Stevens MHH, Szoecs E, Wagner H, Barbour M, Bedward M, Bolker B, Borcard D, Carvalho G, Chirico M, De Caceres M, Durand S, Evangelista HBA, FitzJohn R, Friendly M, Furneaux B, Hannigan G, Hill MO, Lahti L, McGlinn D, Ouellette MH, Cunha ER, Smith T, Stier A, Ter Braak CJF, Weedon J. vegan: Community Ecology Package (Online). https://CRAN.R-project.org/package=vegan [2023 Jun 9].
- 37. Choudhury R, Beezley J, Davis B, Tomeck J, Gratzl S, Golzarri-Arroyo L, Wan J, Raftery D, Baumes J, O’Connell TM. Viime: visualization and integration of metabolomics experiments. J Open Source Softw 5: 2410, 2020. doi: 10.21105/joss.02410. [DOI] [PMC free article] [PubMed] [Google Scholar]
- 38. Wickham H. ggplot2: Elegant Graphics for Data Analysis (3rd ed.). New York: Springer-Verlag, 2016. [Google Scholar]
- 39. Scheler M, Irmler M, Lehr S, Hartwig S, Staiger H, Al-Hasani H, Beckers J, Hrabé de Angelis M, Häring H-U, Weigert C. Cytokine response of primary human myotubes in an in vitro exercise model. Am J Physiol Cell Physiol 305: C877–C886, 2013. doi: 10.1152/ajpcell.00043.2013. [DOI] [PubMed] [Google Scholar]
- 40. Pourteymour S, Eckardt K, Holen T, Langleite T, Lee S, Jensen J, Birkeland KI, Drevon CA, Hjorth M. Global mRNA sequencing of human skeletal muscle: search for novel exercise-regulated myokines. Mol Metab 6: 352–365, 2017. doi: 10.1016/j.molmet.2017.01.007. [DOI] [PMC free article] [PubMed] [Google Scholar]
- 41. Sidorenko S, Klimanova E, Milovanova K, Lopina OD, Kapilevich L. V, Chibalin A. V, Orlov SN. Transcriptomic changes in C2C12 myotubes triggered by electrical stimulation: Role of Ca2+i-mediated and Ca2+i-independent signaling and elevated [Na+]i/[K+]i ratio. Cell Calcium 76: 72–86, 2018. doi: 10.1016/j.ceca.2018.09.007. [DOI] [PubMed] [Google Scholar]
- 42. Hoshino D, Kawata K, Kunida K, Hatano A, Yugi K, Wada T, Fujii M, Sano T, Ito Y, Furuichi Y, Manabe Y, Suzuki Y, Fujii NL, Soga T, Kuroda S. Trans-omic analysis reveals ROS-dependent pentose phosphate pathway activation after high-frequency electrical stimulation in C2C12 myotubes. iScience 23: 101558, 2020. doi: 10.1016/j.isci.2020.101558. [DOI] [PMC free article] [PubMed] [Google Scholar]
- 43. Tamura Y, Kouzaki K, Kotani T, Nakazato K. Electrically stimulated contractile activity-induced transcriptomic responses and metabolic remodeling in C2C12 myotubes: twitch vs. tetanic contractions. Am J Physiol Cell Physiol 319: C1029–C1044, 2020. doi: 10.1152/ajpcell.00494.2019. [DOI] [PubMed] [Google Scholar]
- 44. Abdelmoez AM, Sardón Puig L, Smith JAB, Gabriel BM, Savikj M, Dollet L, Chibalin AV, Krook A, Zierath JR, Pillon NJ. Comparative profiling of skeletal muscle models reveals heterogeneity of transcriptome and metabolism. Am J Physiol Cell Physiol 318: C615–C626, 2020. doi: 10.1152/ajpcell.00540.2019. [DOI] [PMC free article] [PubMed] [Google Scholar]
- 45. Fujita H, Horie M, Shimizu K, Nagamori E. Microarray profiling of gene expression in C2C12 myotubes trained by electric pulse stimulation. J Biosci Bioeng 132: 417–422, 2021. doi: 10.1016/j.jbiosc.2021.06.016. [DOI] [PubMed] [Google Scholar]
- 46. Fujita H, Nedachi T, Kanzaki M. Accelerated de novo sarcomere assembly by electric pulse stimulation in C2C12 myotubes. Exp Cell Res 313: 1853–1865, 2007. doi: 10.1016/j.yexcr.2007.03.002. [DOI] [PubMed] [Google Scholar]
- 47. Lambernd S, Taube A, Schober A, Platzbecker B, Görgens SW, Schlich R, Jeruschke K, Weiss J, Eckardt K, Eckel J. Contractile activity of human skeletal muscle cells prevents insulin resistance by inhibiting pro-inflammatory signalling pathways. Diabetologia 55: 1128–1139, 2012. doi: 10.1007/s00125-012-2454-z. [DOI] [PubMed] [Google Scholar]
- 48. Greenbaum D, Colangelo C, Williams K, Gerstein M. Comparing protein abundance and mRNA expression levels on a genomic scale. Genome Biol 4: 117, 2003. doi: 10.1186/gb-2003-4-9-117. [DOI] [PMC free article] [PubMed] [Google Scholar]
- 49. Wright CR, Brown EL, Della-Gatta PA, Ward AC, Lynch GS, Russell AP. G-CSF does not influence C2C12 myogenesis despite receptor expression in healthy and dystrophic skeletal muscle. Front Physiol 8: 886, 2017. doi: 10.3389/fphys.2017.00886. [DOI] [PMC free article] [PubMed] [Google Scholar]
- 50. Hulmi JJ, Nissinen TA, Räsänen M, Degerman J, Lautaoja JH, Hemanthakumar KA, Backman JT, Ritvos O, Silvennoinen M, Kivelä R. Prevention of chemotherapy induced cachexia by ACVR2B ligand blocking has different effects on heart and skeletal muscle. J Cachexia Sarcopenia Muscle 9: 417–432, 2018. doi: 10.1002/jcsm.12265. [DOI] [PMC free article] [PubMed] [Google Scholar]
- 51. Kawahara Y, Yamaoka K, Iwata M, Fujimura M, Kajiume T, Magaki T, Takeda M, Ide T, Kataoka K, Asashima M, Yuge L. Novel electrical stimulation sets the cultured myoblast contractile function to ‘on’. Pathobiology 73: 288–294, 2006. doi: 10.1159/000099123. [DOI] [PubMed] [Google Scholar]
- 52. Faustino D, Brinkmeier H, Logotheti S, Jonitz-Heincke A, Yilmaz H, Takan I, Peters K, Bader R, Lang H, Pavlopoulou A, Pützer BM, Spitschak A. Novel integrated workflow allows production and in-depth quality assessment of multifactorial reprogrammed skeletal muscle cells from human stem cells. Cell Mol Life Sci 79: 229, 2022. doi: 10.1007/s00018-022-04264-8. [DOI] [PMC free article] [PubMed] [Google Scholar]
- 53. Kramer HF, Goodyear LJ. Exercise, MAPK, and NF-κB signaling in skeletal muscle. J Appl Physiol (1985) 103: 388–395, 2007. doi: 10.1152/japplphysiol.00085.2007. [DOI] [PubMed] [Google Scholar]
- 54. Nedachi T, Fujita H, Kanzaki M. Contractile C2C12 myotube model for studying exercise-inducible responses in skeletal muscle. Am J Physiol Endocrinol Physiol 295: E1191–E1204, 2008. doi: 10.1152/ajpendo.90280.2008. [DOI] [PubMed] [Google Scholar]
- 55. Raschke S, Eckardt K, Holven KB, Jensen J, Eckel J. Identification and validation of novel contraction-regulated myokines released from primary human skeletal muscle cells. PLoS One 8: e62008, 2013. doi: 10.1371/journal.pone.0062008. [DOI] [PMC free article] [PubMed] [Google Scholar]
- 56. Peake JM, della Gatta P, Suzuki K, Nieman DC. Cytokine expression and secretion by skeletal muscle cells: regulatory mechanisms and exercise effects. Exerc Immunol Rev 21: 8–25, 2015. [PubMed] [Google Scholar]
- 57. Catoire M, Kersten S. The search for exercise factors in humans. FASEB J 29: 1615–1628, 2015. doi: 10.1096/fj.14-263699. [DOI] [PubMed] [Google Scholar]
- 58. Miyatake S, Bilan PJ, Pillon NJ, Klip A. Contracting C2C12 myotubes release CCL2 in an NF-κB-dependent manner to induce monocyte chemoattraction. Am J Physiol Endocrinol Physiol 310: E160–E170, 2016. doi: 10.1152/ajpendo.00325.2015. [DOI] [PubMed] [Google Scholar]
- 59. Huh JY. The role of exercise-induced myokines in regulating metabolism. Arch Pharm Res 41: 14–29, 2018. doi: 10.1007/s12272-017-0994-y. [DOI] [PubMed] [Google Scholar]
- 60. Nedachi T, Hatakeyama H, Kono T, Sato M, Kanzaki M. Characterization of contraction-inducible CXC chemokines and their roles in C2C12 myocytes. Am J Physiol Endocrinol Physiol 297: E866–E878, 2009. doi: 10.1152/ajpendo.00104.2009. [DOI] [PubMed] [Google Scholar]
- 61. Peake JM, Neubauer O, della Gatta PA, Nosaka K. Muscle damage and inflammation during recovery from exercise. J Appl Physiol (1985) 122: 559–570, 2017. doi: 10.1152/japplphysiol.00971.2016. [DOI] [PubMed] [Google Scholar]
- 62. Koltai T, Reshkin SJ, Harguindey S. An Innovative Approach to Understanding and Treating Cancer: Targeting pH: From Etiopathogenesis To New Therapeutic Avenues. Cambridge, MA: Academic Press, 2020. [Google Scholar]
- 63. Jansen S, Pantaleon M, Kaye PL. Characterization and regulation of monocarboxylate cotransporters Slc16a7 and Slc16a3 in preimplantation mouse embryos. Biol Reprod 79: 84–92, 2008. doi: 10.1095/biolreprod.107.066811. [DOI] [PubMed] [Google Scholar]
- 64. Brooks GA. Lactate as a fulcrum of metabolism. Redox Biol 35: 101454, 2020. doi: 10.1016/j.redox.2020.101454. [DOI] [PMC free article] [PubMed] [Google Scholar]
- 65. Wackerhage H, Vechetti IJ, Baumert P, Gehlert S, Becker L, Jaspers RT, de Angelis MH. Does a hypertrophying muscle fibre reprogramme its metabolism similar to a cancer cell?. Sports Med 52: 2569–2578, 2022. doi: 10.1007/s40279-022-01676-1. [DOI] [PMC free article] [PubMed] [Google Scholar]
- 66. Lawler JM, Rodriguez DA, Hord JM. Mitochondria in the middle: exercise preconditioning protection of striated muscle. J Physiol 594: 5161–5183, 2016. doi: 10.1113/JP270656. [DOI] [PMC free article] [PubMed] [Google Scholar]
- 67. Scheele C, Nielsen S, Pedersen BK. ROS and myokines promote muscle adaptation to exercise. Trends Endocrinol Metab 20: 95–99, 2009. doi: 10.1016/j.tem.2008.12.002. [DOI] [PubMed] [Google Scholar]
- 68. Fujita H, Mae K, Nagatani H, Horie M, Nagamori E. Effect of hydrogen peroxide concentration on the maintenance and differentiation of cultured skeletal muscle cells. J Biosci Bioeng 131: 572–578, 2021. doi: 10.1016/j.jbiosc.2020.12.010. [DOI] [PubMed] [Google Scholar]
- 69. Liu L, Zhang Y, Liu T, Ke C, Huang J, Fu Y, Lin Z, Chen F, Wu X, Chen Q. Pyrroloquinoline quinone protects against exercise‐induced fatigue and oxidative damage via improving mitochondrial function in mice. FASEB J 35: e21394, 2021. doi: 10.1096/fj.202001977RR. [DOI] [PubMed] [Google Scholar]
- 70. Silva GJJ, Bye A, el Azzouzi H, Wisløff U. MicroRNAs as important regulators of exercise adaptation. Prog Cardiovasc Dis 60: 130–151, 2017. doi: 10.1016/j.pcad.2017.06.003. [DOI] [PubMed] [Google Scholar]
- 71. Soplinska A, Zareba L, Wicik Z, Eyileten C, Jakubik D, Siller-Matula JM, De Rosa S, Malek LA, Postula M. MicroRNAs as biomarkers of systemic changes in response to endurance exercise—a comprehensive review. Diagnostics 10: 813, 2020. doi: 10.3390/diagnostics10100813. [DOI] [PMC free article] [PubMed] [Google Scholar]
- 72. Vechetti IJ, Peck BD, Wen Y, Walton RG, Valentino TR, Alimov AP, Dungan CM, Van Pelt DW, von Walden F, Alkner B, Peterson CA, McCarthy JJ. Mechanical overload‐induced muscle‐derived extracellular vesicles promote adipose tissue lipolysis. FASEB J 35: e21644, 2021. doi: 10.1096/fj.202100242R. [DOI] [PMC free article] [PubMed] [Google Scholar]
- 73. Rome S, Forterre A, Bouzakri K, Mizgier ML. Skeletal muscle-released extracellular vesicles: state of the art. Front Physiol 10: 929, 2019. doi: 10.3389/fphys.2019.00929. [DOI] [PMC free article] [PubMed] [Google Scholar]
- 74. Chen J-F, Mandel EM, Thomson JM, Wu Q, Callis TE, Hammond SM, Conlon FL, Wang D-Z. The role of microRNA-1 and microRNA-133 in skeletal muscle proliferation and differentiation. Nat Genet 38: 228–233, 2006. doi: 10.1038/ng1725. [DOI] [PMC free article] [PubMed] [Google Scholar]
- 75. Kim HK, Lee YS, Sivaprasad U, Malhotra A, Dutta A. Muscle-specific microRNA miR-206 promotes muscle differentiation. J Cell Biol 174: 677–687, 2006. doi: 10.1083/jcb.200603008. [DOI] [PMC free article] [PubMed] [Google Scholar]
- 76. Silver J, Wadley G, Lamon S. Mitochondrial regulation in skeletal muscle: a role for non‐coding RNAs? Exp Physiol 103: 1132–1144, 2018. doi: 10.1113/EP086846. [DOI] [PubMed] [Google Scholar]
- 77. Rodrigues AC, Spagnol AR, Frias F de T, de Mendonça M, Araújo HN, Guimarães D, Silva WJ, Bolin AP, Murata GM, Silveira L. Intramuscular injection of miR-1 reduces insulin resistance in obese mice. Front Physiol 12: 676265, 2021. doi: 10.3389/fphys.2021.676265. [DOI] [PMC free article] [PubMed] [Google Scholar]
- 78. Nie Y, Sato Y, Wang C, Yue F, Kuang S, Gavin TP. Impaired exercise tolerance, mitochondrial biogenesis, and muscle fiber maintenance in miR‐133a–deficient mice. FASEB J 30: 3745–3758, 2016. doi: 10.1096/fj.201600529R. [DOI] [PMC free article] [PubMed] [Google Scholar]
- 79. Ma G, Wang Y, Li Y, Cui L, Zhao Y, Zhao B, Li K. MiR-206, a key modulator of skeletal muscle development and disease. Int J Biol Sci 11: 345–352, 2015. doi: 10.7150/ijbs.10921. [DOI] [PMC free article] [PubMed] [Google Scholar]
- 80. Bydak B, Pierdoná TM, Seif S, Sidhom K, Obi PO, Labouta HI, Gordon JW, Saleem A. Characterizing extracellular vesicles and particles derived from skeletal muscle myoblasts and myotubes and the effect of acute contractile activity. Membranes (Basel) 12: 464, 2022. doi: 10.3390/membranes12050464. [DOI] [PMC free article] [PubMed] [Google Scholar]
- 81. Everaert C, Luypaert M, Maag JV, Cheng QX, Dinger ME, Hellemans J, Mestdagh P. Benchmarking of RNA-sequencing analysis workflows using whole-transcriptome RT-qPCR expression data. Sci Rep 7: 1559, 2017. doi: 10.1038/s41598-017-01617-3. [DOI] [PMC free article] [PubMed] [Google Scholar]
- 82. Hawley JA, Lundby C, Cotter JD, Burke LM. Maximizing cellular adaptation to endurance exercise in skeletal muscle. Cell Metab 27: 962–976, 2018. doi: 10.1016/j.cmet.2018.04.014. [DOI] [PubMed] [Google Scholar]
- 83. Farmawati A, Kitajima Y, Nedachi T, Sato M, Kanzaki M, Nagatomi R. Characterization of contraction-induced IL-6 up-regulation using contractile C2C12 myotubes. Endocr J 60: 137–147, 2013. doi: 10.1507/endocrj.ej12-0316. [DOI] [PubMed] [Google Scholar]
- 84. Shirasaki Y, Yamagishi M, Suzuki N, Izawa K, Nakahara A, Mizuno J, Shoji S, Heike T, Harada Y, Nishikomori R, Ohara O. Real-time single-cell imaging of protein secretion. Sci Rep 4: 4736, 2014. doi: 10.1038/srep04736. [DOI] [PMC free article] [PubMed] [Google Scholar]
- 85. Russell AP, Lamon S, Boon H, Wada S, Güller I, Brown EL, Chibalin A. V, Zierath JR, Snow RJ, Stepto N, Wadley GD, Akimoto T. Regulation of miRNAs in human skeletal muscle following acute endurance exercise and short-term endurance training. J Physiol 591: 4637–4653, 2013. doi: 10.1113/jphysiol.2013.255695. [DOI] [PMC free article] [PubMed] [Google Scholar]
- 86. Tarum J, Folkesson M, Atherton PJ, Kadi F. Electrical pulse stimulation: an in vitro exercise model for the induction of human skeletal muscle cell hypertrophy. A proof‐of‐concept study. Exp Physiol 102: 1405–1413, 2017. doi: 10.1113/EP086581. [DOI] [PubMed] [Google Scholar]
- 87. Shi J, Zhang Y, Tan D, Zhang X, Yan M, Zhang Y, Franklin R, Shahbazi M, Mackinlay K, Liu S, Kuhle B, James ER, Zhang L, Qu Y, Zhai Q, Zhao W, Zhao L, Zhou C, Gu W, Murn J, Guo J, Carrell DT, Wang Y, Chen X, Cairns BR, Yang XL, Schimmel P, Zernicka-Goetz M, Cheloufi S, Zhang Y, Zhou T, Chen Q. PANDORA-seq expands the repertoire of regulatory small RNAs by overcoming RNA modifications. Nat Cell Biol 23: 424–436, 2021. [Erratum in Nat Cell Biol 23: 676, 2021]. doi: 10.1038/s41556-021-00652-7. [DOI] [PMC free article] [PubMed] [Google Scholar]
Associated Data
This section collects any data citations, data availability statements, or supplementary materials included in this article.
Supplementary Materials
Figure S1: https://doi.org/10.6084/m9.figshare.24893205.
Figure S2: https://doi.org/10.6084/m9.figshare.24893262.
Table S1: https://doi.org/10.6084/m9.figshare.24893265.
Table S2: https://doi.org/10.6084/m9.figshare.24893268.
Table S3: https://doi.org/10.6084/m9.figshare.24893271.
Table S4: https://doi.org/10.6084/m9.figshare.24893274.
Table S5: https://doi.org/10.6084/m9.figshare.24893277.
Data Availability Statement
The source data from mRNA (Supplemental Table S4) and sRNA (Supplemental Table S5) sequencing analyses (read counts) are available at https://doi.org/10.6084/m9.figshare.24893274 and https://doi.org/10.6084/m9.figshare.24893277, respectively.