Abstract
The double–Nakagami (DN) model provides a method for analyzing the amplitude envelope statistics of quantitative ultrasound (QUS). In this study, the relationship between the sound field characteristics and the robustness of QUS evaluation was evaluated using five HF linear array probes and tissue-mimicking phantoms. Compound plane-wave imaging (CPWI) was used to acquire echo data. Five phantoms containing two types of scatterers were used to mimic fatty liver tissue. After clarifying the relationship between the sound field characteristics of the probes and QUS parameters, DN QUS parameters in 10 rat livers with different lipidification were evaluated using one HF linear array probe. For both phantom and in situ liver analyses, correlations between fat content and multiple QUS parameters were confirmed, suggesting that the combination of CPWI using a HF linear array probe with the DN model is a robust method for quantifying fatty liver and has potential clinical diagnostic applications.
1. Introduction
Ultrasonography is widely used for imaging because of its noninvasiveness, simplicity, and real-time performance. However, ultrasound imaging is greatly influenced by the experience and image-reading skills of the clinician. Moreover, factors related to image quality, such as contrast and image creation methods, have a significant impact on diagnostic performance. Therefore, quantitative ultrasound (QUS) has been proposed as a quantitative evaluation method for ultrasound imaging. QUS includes methods to estimate the speed of sound,1–4) attenuation coefficient,5–7) backscatter coefficient,8–11) and shear wave velocity12–15) and methods to generate amplitude envelope statistics of the probability density function (PDF) of the echo signal. QUS methods have been applied to various biological tissues, such as the skin,16,17) breast,18,19) blood vessels,20–22) and lymph nodes.23–25)
The statistical properties of the echo envelope can be used to evaluate the number density and intensity of scatterers in tissues, and various generalized PDFs, such as Rayleigh,26–28) K,29,30) and Nakagami31–35) distributions, have been investigated. In addition, an analytical model combining multiple statistical models has been proposed for the evaluation of complex echo signals. The multi-Rayleigh model,36–39) which combines multiple Rayleigh models, has been proposed for the evaluation of liver fibrosis progression, and the double-Nakagami (DN) model, which combines two Nakagami models, has been proposed for the evaluation of fat content in fatty liver, which is considered particularly difficult to diagnose in clinical practice.40–42) In a previous study, the DN model was applied to data obtained from rat livers excised with a HF (15 MHz), single-element, focused transducer and was able to evaluate fat mass with high accuracy.42) In recent years, the application of HF ultrasound to body surface tissues such as the skin and lymph nodes has progressed, and the demand for this technology in the gastrointestinal field is also increasing in clinical practice. Therefore, we have applied QUS to phantoms and organs excised from rats using a single HF, concave transducer and have shown that high-resolution analysis of amplitude envelope characteristics and backscattering coefficient analysis are feasible for practical use.7,42,43) However, the use of array probes is essential for the evaluation of biological tissues in clinical practice. Although it is difficult to observe the liver in vivo using HF ultrasound at present, this study aimed to apply HF QUS to the liver in the abdominal region.
But the relationships between the physical characteristics of the tissue, the shape of the transducer, and the characteristics of the transmitting and receiving ultrasound fields all affect the evaluation of the amplitude envelope characteristics.44–46) In past studies, Ujihara et al. applied focused-beam imaging and compound plane-wave imaging (CPWI)47) to amplitude envelope characterization. CPWI has more uniform sound field characteristics than focused beam imaging (FBI) and can be applied to the multi-Rayleigh model to evaluate fat mass with high robustness, and it has been confirmed that the ultrasound transmission and reception field characteristics affect the accuracy of CPWI-based fat quantitation in a phantom simulating fatty liver.46)
In this study, phantoms and real biological tissue were evaluated to investigate the usefulness of amplitude envelope statistics for analyzing fatty liver using a HF linear array probe and CPWI. First, we applied five HF linear array probes and CPWI to phantoms mimicking normal liver and early-stage fatty liver to examine the influence of amplitude envelope characteristics on evaluation accuracy. Next, on the basis of the results of the phantom study, we verified the relationship between the histological characteristics of the biological tissues and the QUS parameters of the DN model using the livers of 10 rats, and the results were compared with those obtained using the normal and fatty liver-mimicking phantoms.
2. Experimental methods
2.1. Data acquisition using CPWI and basic characteristics of each probe
An ultrasound research platform with 256 channels (Vantage 256; Verasonics, WA, USA) and five HF linear array probes with different frequency bands were used for data acquisition. Table I shows the configuration and transmission/reception conditions for the L22–14v, L35–16vX, L38–22v (Verasonics), L39–21gD (Daxsonics Ultrasound, Halifax, Canada), and MS550D (FUJIFILM VisualSonics, Toronto, Canada) probes. Because the maximum sampling frequency of the system was 62.5 MHz, the sampling point was set to four times the center frequency by up-sampling the signal obtained at three-quarters the center frequency. For RF signal acquisition, plane waves were transmitted and received at 1°, ±3°, ±6°, ±9°, ±12°, and ±15°, and CPWI was performed to obtain signals for analysis. The signal-to-noise ratio of the 0° transmission/reception is low because all elements are simultaneously excited, so 1° transmission/reception was adopted instead.48) To ensure stable measurements at large depths, the input voltage was set to achieve the maximum sound pressure recommended by Verasonics for each probe.
Table I.
Configuration of each probe and transmission/reception conditions.
| L22-14vX | L35-16vX | L38-22v | L39-21gD | MS550D | |
|---|---|---|---|---|---|
| Designed center Freq [MHz] | 15.63 | 26.79 | 31.25 | 31.25 | 37.50 |
| Sampling Freq [MHz] | 62.5 | 107.1 | 125 | 125 | 150 |
| Tx/Rx elements | 128 | 128 | 128 | 128 | 256 |
| Element pitch [μm] | 100 | 70 | 69 | 55 | 55 |
| Elevation focus [mm] | 6 | 8 | 8 | 6.5 | 7 |
| Input voltage [V] | 25 | 40 | 25 | 30 | 25 |
| Actual center Freq [MHz] | 15 | 20 | 29 | 30 | 29 |
| Actual −6 dB bandwidth [MHz] | 14–17 | 15–30 | 26–32 | 27–33 | 27–37 |
To understand the basic acoustic characteristics of each probe, two-dimensional RF echo data were acquired by stretching a 25 μm nylon wire in a water tank filled with degassed water and manipulating the probes at 1 mm intervals. Although a wire of sufficiently small diameter relative to the wavelength should be used, the smallest-gauge wire available in the regular distribution network had a diameter of 25 μm. Similarly, 25 μm wires have been used as a scattering source in previous studies to measure the acoustic characteristics for HF ultrasound.49,50)
Figure 1 shows B-mode images obtained by integrating the results obtained using wires placed at depths ranging from 4 mm to 14 mm. Figure 2 shows the echo amplitude, and Fig. 3 shows the resolution in the axial and lateral directions at each depth. Although higher frequencies result in finer resolution, the L35–16vX probe generated more image artifacts than the other HF probes, as can be seen from the B-mode data in Fig. 1 and the resolution in Fig. 3. Comparing the resolution and amplitude gradients for L38–22v and L39–21gD probes, which have similar frequency bands, it was confirmed that the L39–21gD probe with the smaller element spacing produced a finer resolution and greater depth of field.
Fig. 1.
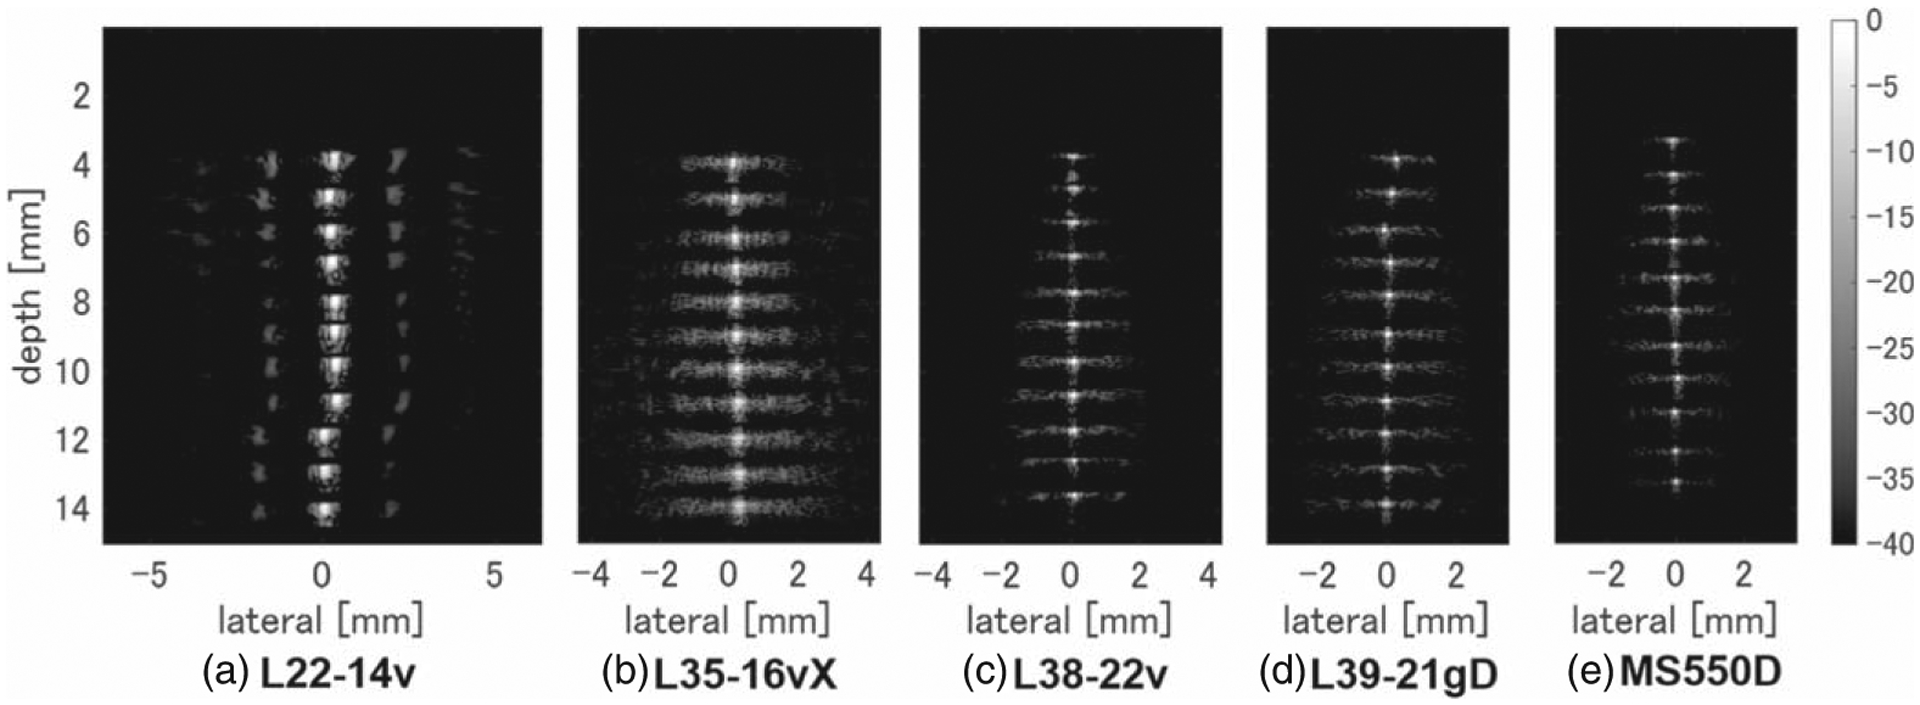
B-mode images with wires measured at 1 mm intervals using (a) L22–14v, (b) L35–16vX, (c) L38–22v, (d) L39–21gD, and (e) MS550D measurement probes, with only the wire portions joined together.
Fig. 2.

Depths of field for (a) L22–14v, (b) L35–16vX, (c) L38–22v, (d) L39–21gD, and (e) MS550D measurement probes.
Fig. 3.

Depth dependence of axial and lateral resolution for (a) L22–14v, (b) L35–16vX, (c) L38–22v, (d) L39–21gD, and (e) MS550D measurement probes.
2.2. Tissue-mimicking phantoms with multiple types of scatterers
Six tissue-mimicking phantoms were made by mixing one or two types of scatterers in a rectangular polystyrene container (4 cm width, 4 cm depth, 3 cm height). Containing a solution of 2.0 wt% agar (A1296; Sigma-Aldrich, MO, USA) in degassed purified water. In the homogeneous phantom mimicking normal liver, 0.25 vol% nylon spheroids (ORGASOL 2002 EXD NAT 1; Arkema, Colombes, France) with an average diameter of 5 μm (equivalent to the size of a hepatocyte cell nucleus) were used. In phantoms mimicking fatty liver, the above solution was further supplemented with various volume fractions of strongly scattering acrylic spheroids (MX-1000; Soken, Aichi, Japan) with an average diameter of 10 μm. The theoretical acoustic impedances of the nylon and acrylic scatterers are 2.22 and 3.25 Mrayl, respectively. Fat droplets in the human liver vary in size from a few μm to over 100 μm, so a 10 μm scatterer is comparable in size with a small fat droplet. However, the intensity of scattering from the acrylic spheroid is determined by the acoustic impedance ratio to the nylon scatterer and the surface area, based on the acoustic impedance of the nylon scatterer. In previous studies on the influence of sound field characteristics, the amplitude envelope and backscattering properties of phantoms containing 5–40 μm acrylic scatterers were evaluated.7,43,46) Using nylon spheroids to model normal liver, the scattering intensity from acrylic spheroids with diameters of 30 or 40 μm was too strong to mimic scattering from real fat droplets. Therefore, 10 μm acrylic spheroids were chosen to visualize the effect of small fat droplets on high-resolution measurements using HF ultrasound. The measured intensity ratio of scattering from 10 μm acrylic and a 5 μm nylon spheres corresponds to scattering from a 20 to 30 μm fat droplet in real liver tissue. For ultrasonic measurements, each phantom was removed from the polystyrene container and the probe was mechanically fixed to the top surface of the phantom via ultrasound gel.
It has been reported that when there are more than 10 scatterers in the point spread function (PSF), the scatterer distribution and ultrasound image become uncorrelated, causing a speckle pattern.51) Therefore, in this study, weak-scattering nylon spheroids were placed in the phantom to mimic normal liver tissue speckle patterns, and strong-scattering acrylic spheroids mimicking lipid droplets were mixed in the normal liver phantom. Table II shows the scatterer configurations for each phantom. Phantom A (0%) mimicked a normal liver structure with a homogeneous distribution of hepatocytes, where the percentage in parentheses represents the volume fraction of 10 μm acrylic scatterers supplementing the 5 μm nylon scatterers. Phantoms B (0.01%), C (0.05%), D (0.25%), E (0.59%), and F (1.25%) mimicked fatty livers, which contain lipid droplets in different volume fractions within the normal liver structure. Table III quantifies the resolution in Fig. 3 and the number of scatterers in the PSF in phantom D for each probe. For the phantoms used in this study, the volume fractions of the two different scatterers were so low that spheroids were rarely in proximity; therefore, the boundary between the acoustic impedances of the two scatterers was negligible. In a preliminary experiment, several phantoms with different volume fractions of only a 10 μm scatterer to mimic a fat droplet were observed using the L39–21gD probe, and image evaluation using the procedures described in Sect. 2.5 confirmed that the Nakagami μ parameter was less than 1 regardless of the volume fraction. This means that the echo signal from the fat droplet-mimicking 10 μm scatterers alone does not produce speckle (i.e. the PDF does not follow a Rayleigh distribution).
Table II.
Scatterer size and composition of each tissue-mimicking phantom.
| Phantom | A | B | C | D | E | F |
|---|---|---|---|---|---|---|
| Volume fraction of scatterer 1 [vol%] [5 μm nylon sphere] | 0.25 | 0.25 | 0.25 | 0.25 | 0.25 | 0.25 |
| Volume fraction of scatterer 2 [vol%] [10 μm acryl sphere] | — | 0.01 | 0.05 | 0.25 | 0.59 | 1.25 |
Table III.
Point spread function (PSF) size and envelope statistics for each probe.
| PSF [μm] | Number of scatterers | ||||
|---|---|---|---|---|---|
| Axial | Lateral | 5 μm, 0.25% | 10 μm, 0.1% | 10 μm, 0.25% | |
| L22-14v | 259 | 220 | 470 | 24 | 60 |
| L35-16vX | 200 | 152 | 177 | 9 | 22 |
| L38-22v | 112 | 110 | 52 | 3 | 7 |
| L39-21gD | 78 | 107 | 34 | 2 | 4 |
| MS550D | 66 | 94 | 22 | 1 | 3 |
2.3. Rat livers with different degrees of fat deposition
Excised livers from 10 male rats (Slc:SD) were used for ex vivo biological tissue evaluation. For the normal liver condition, two 7 week old rats were raised on a normal-colored diet (Lab MR Stock, Nosan, Kanagawa, Japan). For the fatty liver condition, pairs of 6-week-old rats were fed a high-calorie diet (HFC, Funabashi Farm, Chiba, Japan) for a period of either 1, 2, 3, or 4 weeks. A pathologist confirmed the amount of fatty deposits after hematoxylin and eosin staining of tissue sections and classified the progression of hepatic lipidification into four rates of fat deposition: healthy (<5%), mild (5%–33%), moderate (34%–66%), and severe (⩾67%). The numbers of animals with healthy, mild, moderate, and severe lipidification were 2, 4, 3, and 1, respectively, and Fig. 4 shows the corresponding pathology images. In fatty liver in rats, the diameter of fat droplets was approximately 30 μm, even in severe cases.
Fig. 4.
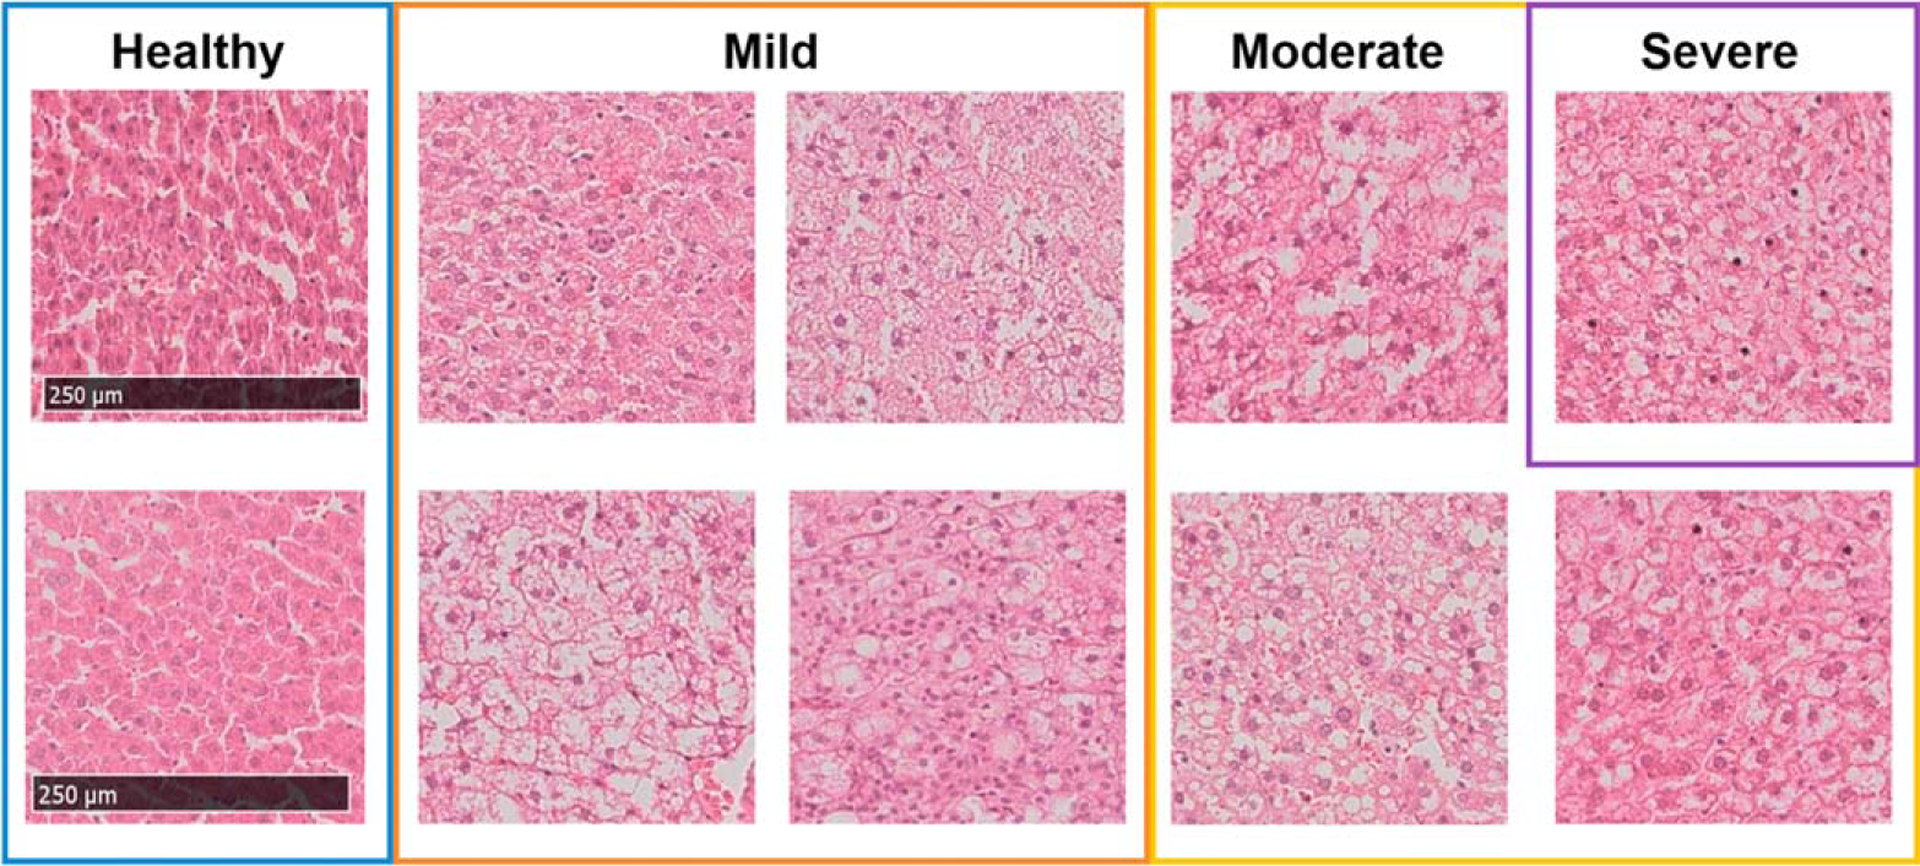
Images of hematoxylin- and eosin-stained liver sections from rats fed either a normal or high-calorie diet described in Sect. 2.3, and classification of the degree of lipidification by a pathologist.
2.4. Compound plane-wave imaging
For a plane wave transmitted at an angle α from the surface normal, the propagation time τTx(a, x, z) required to reach the imaging point (x, z) in the lateral position x and depth is z given by
| (1) |
where c is the speed of sound. The time required to return to the ith transducer position in the lateral direction (xi) is given by
| (2) |
The total travel time τ from the image point to the transducer is given by
| (3) |
At each steering angle, the delay and sum (DAS) algorithm is performed using the delay time calculated for all pixels. The signal SDAS after DAS processing at image position (x, z) given as
| (4) |
where s is the signal acquired during transmission at the steering angle αk and is determined from the delay time τ and the coordinates of the transducer being referenced. In Eq. (4), N is the number of transducers, while w is the weight coefficient applied to each element and is set such that the f-number is constant regardless of depth. After DAS processing at M angles, the final signal SComp (x, z) after compounding is given by
| (5) |
2.5. Amplitude envelope statistics
Amplitude envelope statistics evaluate the distribution of scatterers in a medium from the statistical properties of the echo signal. For example, the probability distribution of the amplitude of an echo signal from a homogeneous medium with a dense distribution of scatterers can be approximated by a Rayleigh distribution, which is represented by the following PDF:
| (6) |
The Nakagami model, which is a generalized version of the Rayleigh distribution, can describe the echo amplitude envelope characteristics for a sparse or heterogeneous medium. The Nakagami PDF is given by
| (7) |
where x is the amplitude envelope, Γ is the gamma function, U is the step function, ω is a scale parameter related to the power of the echo signal, and μ is the Nakagami parameter, which corresponds to the number of scatterers in the resolution cell. The distribution is classified as pre-Rayleigh when μ < 1, Rayleigh when μ = 1, and post-Rayleigh when μ > 1.
The DN Model combines two Nakagami functions and assumes that the echo signal from fatty liver contains components corresponding to both normal liver tissue and fat droplets. It is expressed as
| (8) |
where pL is the PDF of the echo signal scattered from normal liver tissue including luminal structures; pF is the PDF of echo signals scattered from lipid droplets; μL and μF correspond to the number densities of normal liver tissue and lipid droplets, respectively; and (1−α)ωL and αωF quantify the intensity of echo signals from normal liver tissue and lipid droplets, respectively. Each parameter of the DN model was determined using optimization based on the Kullback–Leibler (KL) information content
| (9) |
where q and p are the probability density distributions of the echo amplitude envelope and the DN model, respectively. The DN parameters α, μL, μF, and ωF were optimized using the “fminsearch” function in MATLAB (The MathWorks Inc.) with the cost function DKL. The value of wL, related to the power of the echo signal from normal liver structures, was calculated from optimized parameters under the constraint wL = (1 − αwF)/(1 – α). Taking into consideration the ratio of echo signal intensities from fat droplets and normal liver components, ωL < ωF was adopted as a constraint condition for the analysis. A threshold was set within a region of interest (ROI), and if μF was greater than 1.5, then the echo amplitude in that ROI was deemed to consist of a single dispersion component (pL).
The analysis region was 3–15 mm in depth, and 90% of the entire image area in the lateral direction was analyzed for each tissue-mimicking phantom to exclude the effects of sound field disturbance directly under the probe and CPWI effects on the phantom sides and bottom. The ROI for each probe was set at ten times the size of the minimum PSF shown in Table III to obtain sufficient data points for analysis. The ROI was scanned two-dimensionally with 80% overlap in each direction.
3. Results and discussion
3.1. Influence of sound field characteristics on evaluation accuracy
3.1.1. Normal liver phantom composed of one type of scatterer.
Phantom A, which mimicked a normal liver, was measured using five different HF linear array probes, and the analysis of the echo signals is shown in Fig. 5. Figure 5(a) shows the B-mode image; Fig. 5(b) shows the PDF of the echo amplitude envelope and the results of fitting with Rayleigh and Nakagami distributions in the ROI marked in yellow in panel a; and Fig. 5(c) shows the results of fitting with the DN model and its separation into pL and pF components in the same ROI. In this ROI, the Nakagami μ parameter was close to 1 for all probes (Table IV). As shown in Fig. 5(c), the PDF of the DN mode (red line) was dominated by pL (green line), and μL parameters were comparable with those of the corresponding Nakagami μ parameters for all probes.
Fig. 5.
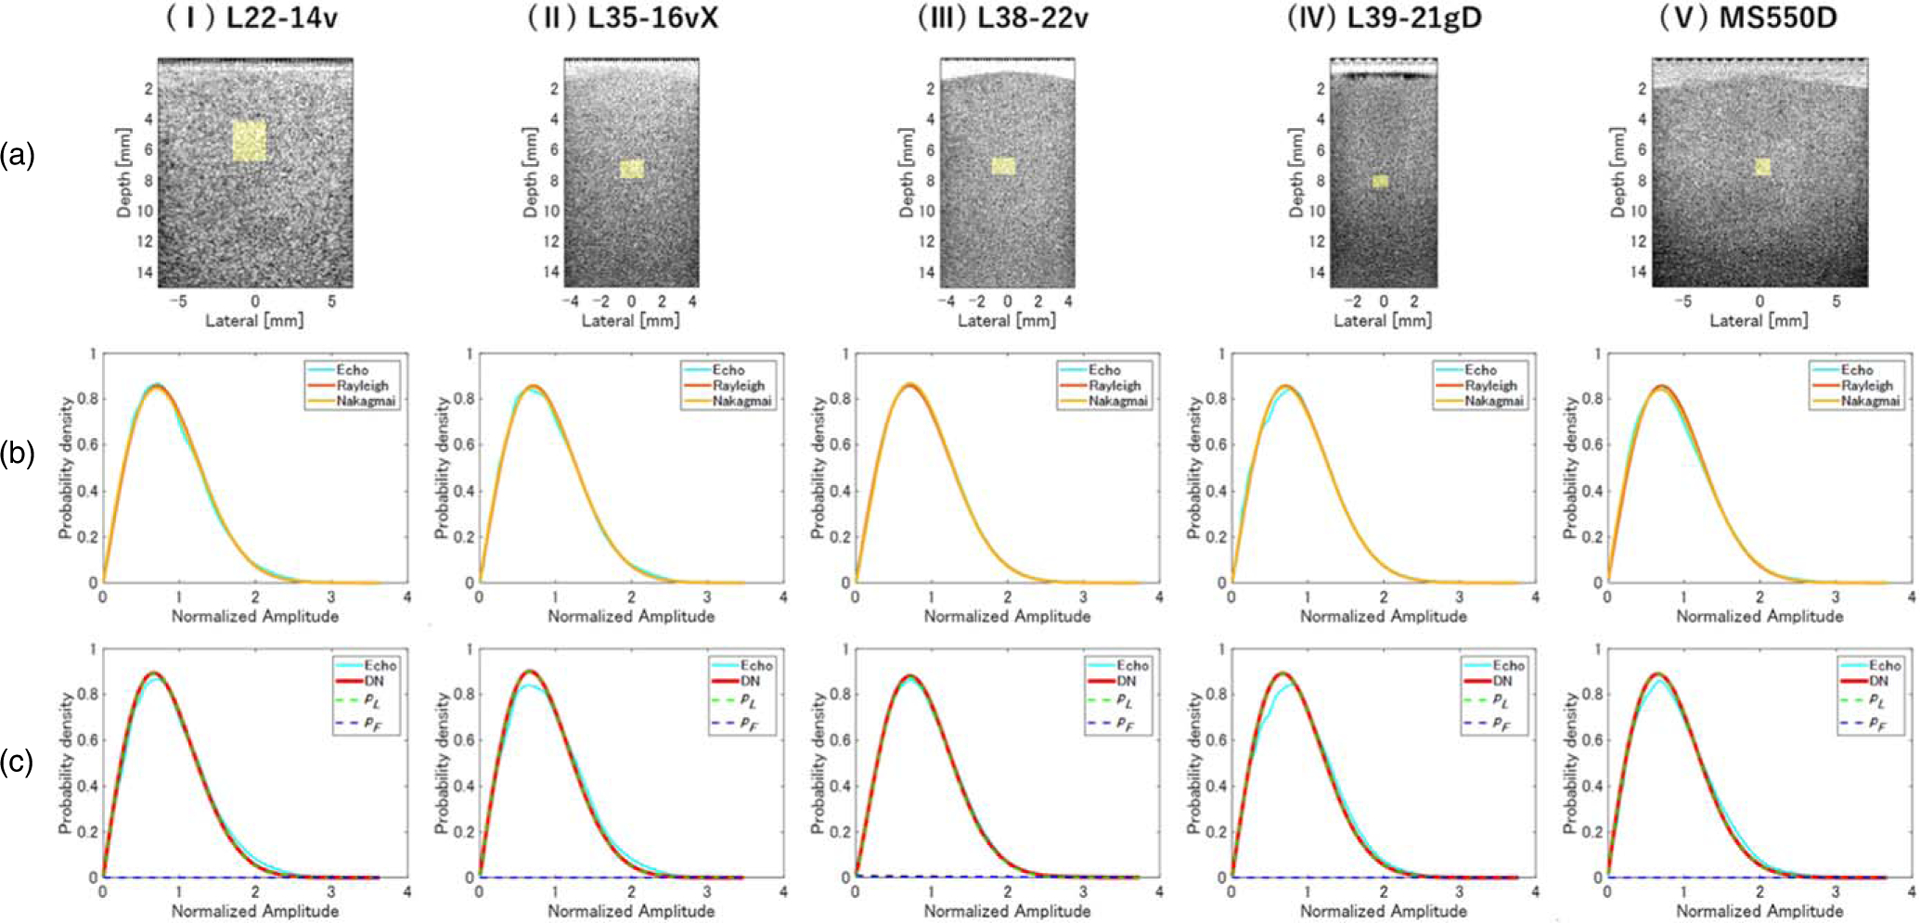
Evaluation of normal liver phantom A. (a) B-mode images and probability density functions (PDFs) of (b) Rayleigh, Nakagami, and (c) double-Nakagami (DN) models, obtained using (I) L22–14v, (II) L35–16vX, (III) L38–22v, (IV) L39–21gD, and (V) MS550D measurement probes.
Table IV.
Quantitative ultrasound (QUS) parameters for phantom A. DKL, Kullback–Leibler cost function; μ, shape parameter of Nakagami distribution; pL probability density function of the signals scattered from normal liver; pF, probability density function of signals scattered from lipid droplets; μL, density of normal liver; μF, density of lipid droplets; (1 − α)ωL, intensity of echo signals from normal liver; αωF, intensity of echo signals from lipid droplets.
| L22-14vX | L35-16vX | L38-22v | L39-21gD | MS550D | |
|---|---|---|---|---|---|
| DKL-Rayleigh | 0.20 ± 0.16 | 0.15 ± 0.15 | 0.17 ± 0.15 | 0.25 ± 0.20 | 0.20 ± 0.19 |
| DKL-Nakagami | 0.13 ± 0.11 | 0.11 ± 0.10 | 0.11 ± 0.09 | 0.19 ± 0.17 | 0.14 ± 0.15 |
| DKL-DN | 0.23 ± 0.19 | 0.22 ± 0.17 | 0.19 ± 0.15 | 0.25 ± 0.19 | 0.20 ± 0.17 |
| Nakagami—μ | 0.96 ± 0.05 | 0.98 ± 0.05 | 0.98 ± 0.05 | 0.97 ± 0.07 | 0.96 ± 0.05 |
| DN-μl | 0.99 ± 0.07 | 1.00 ± 0.06 | 1.00 ± 0.08 | 1.00 ± 0.08 | 1.00 ± 0.08 |
| (1–α)ωL | 0.80 ± 0.22 | 0.80 ± 0.23 | 0.79 ± 0.24 | 0.80 ± 0.21 | 0.80 ± 0.23 |
| αω F | 0.43 ± 0.31 | 0.45 ± 0.32 | 0.41 ± 0.31 | 0.43 ± 0.28 | 0.41 ± 0.30 |
Since it is known that the amplitude envelope statistics are strongly affected by the characteristics of the sound field, the ROI was scanned over the entire region that ROI was scanned and the dependence of the evaluation accuracy on the analysis position was examined. Table IV shows the QUS parameters evaluated using the Rayleigh distribution, Nakagami model, and DN model. For each probe, the Rayleigh and Nakagami distributions had DKL < 0.2 over the entire region. The values of μ and μL parameters were both close to 1, indicating that both the Nakagami and DN models matched the Rayleigh distribution characteristics and confirming that the DN model had the same evaluation accuracy as the Nakagami distribution for a homogeneous medium with a single type of scatterer. The value of (1−α)ωL was found to be approximately 0.80, implying that the low-dispersion component pL was dominant over the entire region. In phantom A, the scatterers had sufficient density and homogeneity to simulate healthy liver tissue. These results confirm that the structure of the phantom was accurately evaluated. However, the DN model always assumes the presence of two different scattering sources even if the phantom has only one scattering component. Therefore, if the data are composed of perfect speckle, the fitting accuracy of the DN model is inferior to that of both the Rayleigh distribution and the Nakagami model.
3.1.2. Fatty liver phantoms composed of two types of scatterers.
Figure 6 shows the B-mode image and the PDF of the echo amplitude envelope for phantom D, which contained 0.25 vol% scatterer, measured with each probe. For each probe, the PDF of the echo amplitude envelope deviated from the Rayleigh distribution, and the low fitting accuracy of both the Rayleigh distribution and the Nakagami model under the assumption that only a single size of scatterer was present can be seen in Fig. 6(b). The PDF of the DN model (solid red line) shown in Fig. 6(c) is represented by the summation of pL (dotted green line) and pF (dotted blue line), showing that the fitting accuracy of the DN model was much higher than that of the Rayleigh distribution and of the Nakagami model. The values of μL for the five probes are shown in Table V. For all probes, the echo amplitude envelope characteristics of phantom D were found to consist of a small dispersion component (pL), which was close to the Rayleigh distribution, and a large dispersion component (pF) with a low density and sparse distribution.
Fig. 6.
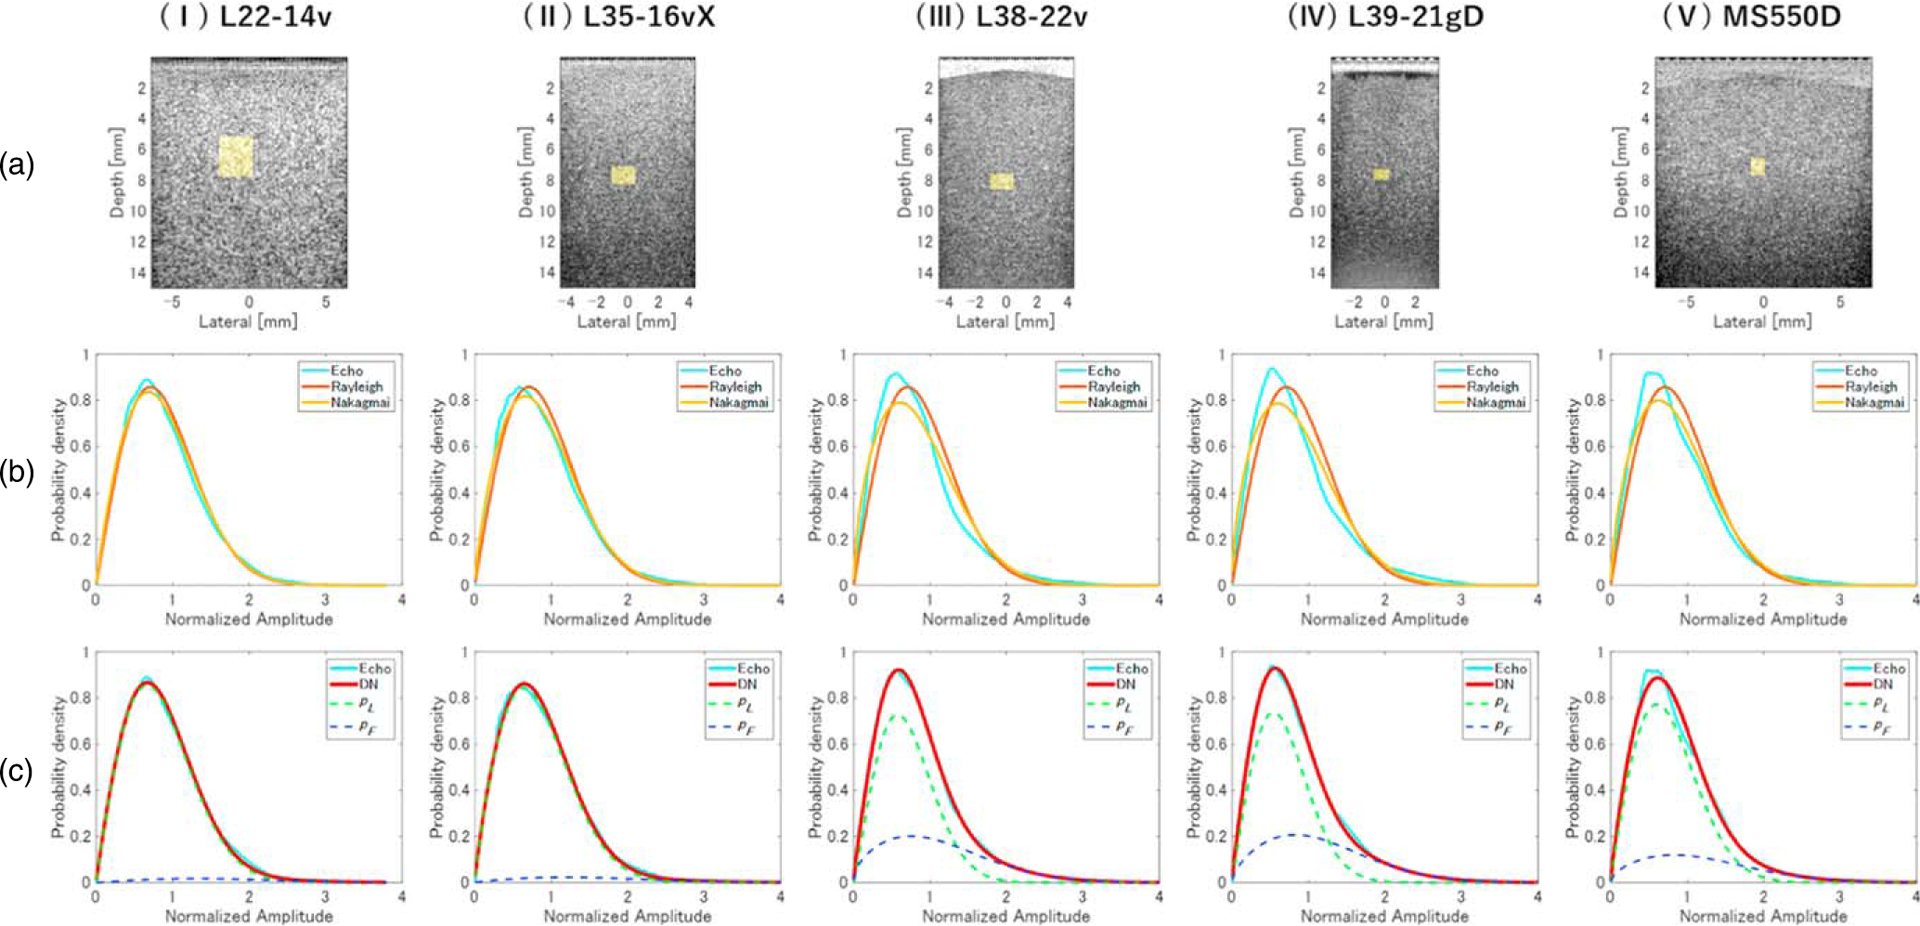
Evaluation of fatty liver phantom D. (a) B-mode images and PDFs of (b) Rayleigh, Nakagami, and (c) DN models, obtained using (I) L22–14v, (II) L35–16vX, (III) L38–22v, (IV) L39–21gD, and (V) MS550D measurement probes.
Table V.
QUS parameters for phantom D.
| L22-14vX | L35-16vX | L38-22v | L39-21gD | MS550D | |
|---|---|---|---|---|---|
| DKL-Rayleigh | 0.47 ± 0.26 | 0.36 ± 0.25 | 0.46 ± 0.25 | 0.49 ± 0.27 | 0.46 ± 0.27 |
| DKL-Nakagami | 0.31 ± 0.21 | 0.26 ± 0.21 | 0.40 ± 0.25 | 0.44 ± 0.26 | 0.40 ± 0.26 |
| DKL-DN | 0.17 ± 0.18 | 0.17 ± 0.19 | 0.12 ± 0.15 | 0.15 ± 0.16 | 0.15 ± 0.18 |
| DN-μl | 1.02 ± 0.12 | 1.00 ± 0.09 | 1.00 ± 0.08 | 1.00 ± 0.10 | 1.02 ± 0.10 |
| DN-μF | 0.84 ± 0.13 | 0.83 ± 0.13 | 0.78 ± 0.13 | 0.79 ± 0.14 | 0.82 ± 0.11 |
| (1–α)ωL | 0.65 ± 0.28 | 0.71 ± 0.25 | 0.66 ± 0.22 | 0.63 ± 0.44 | 0.59 ± 0.24 |
| αω F | 0.47 ± 0.27 | 0.42 ± 0.25 | 0.39 ± 0.21 | 0.44 ± 0.20 | 0.48 ± 0.21 |
Table V summarizes the QUS parameters obtained by analyzing the entire region of phantom D (fatty liver model) using the same process applied to phantom A (normal liver model). DKL values of the Rayleigh distribution and Nakagami model were higher for phantom D than those for phantom A, but the DN model yielded values of less than 0.2. Values of μL were close to 1, and values of μF were close to 0.8. The value of αωF for phantom D (Table V) was also higher than for phantom A (Table IV).
Figures 7(a) and 7(b) show parameterized images of the probability of including the component assigned to pF in the DN model for phantoms A and D, respectively. In phantom D, regions of high probability for existence of strong scatterers are identified throughout the phantom. The relationship between this probability density and the number density of scatterers per PSF shown in Table II was generally consistent for each probe.
Fig. 7.
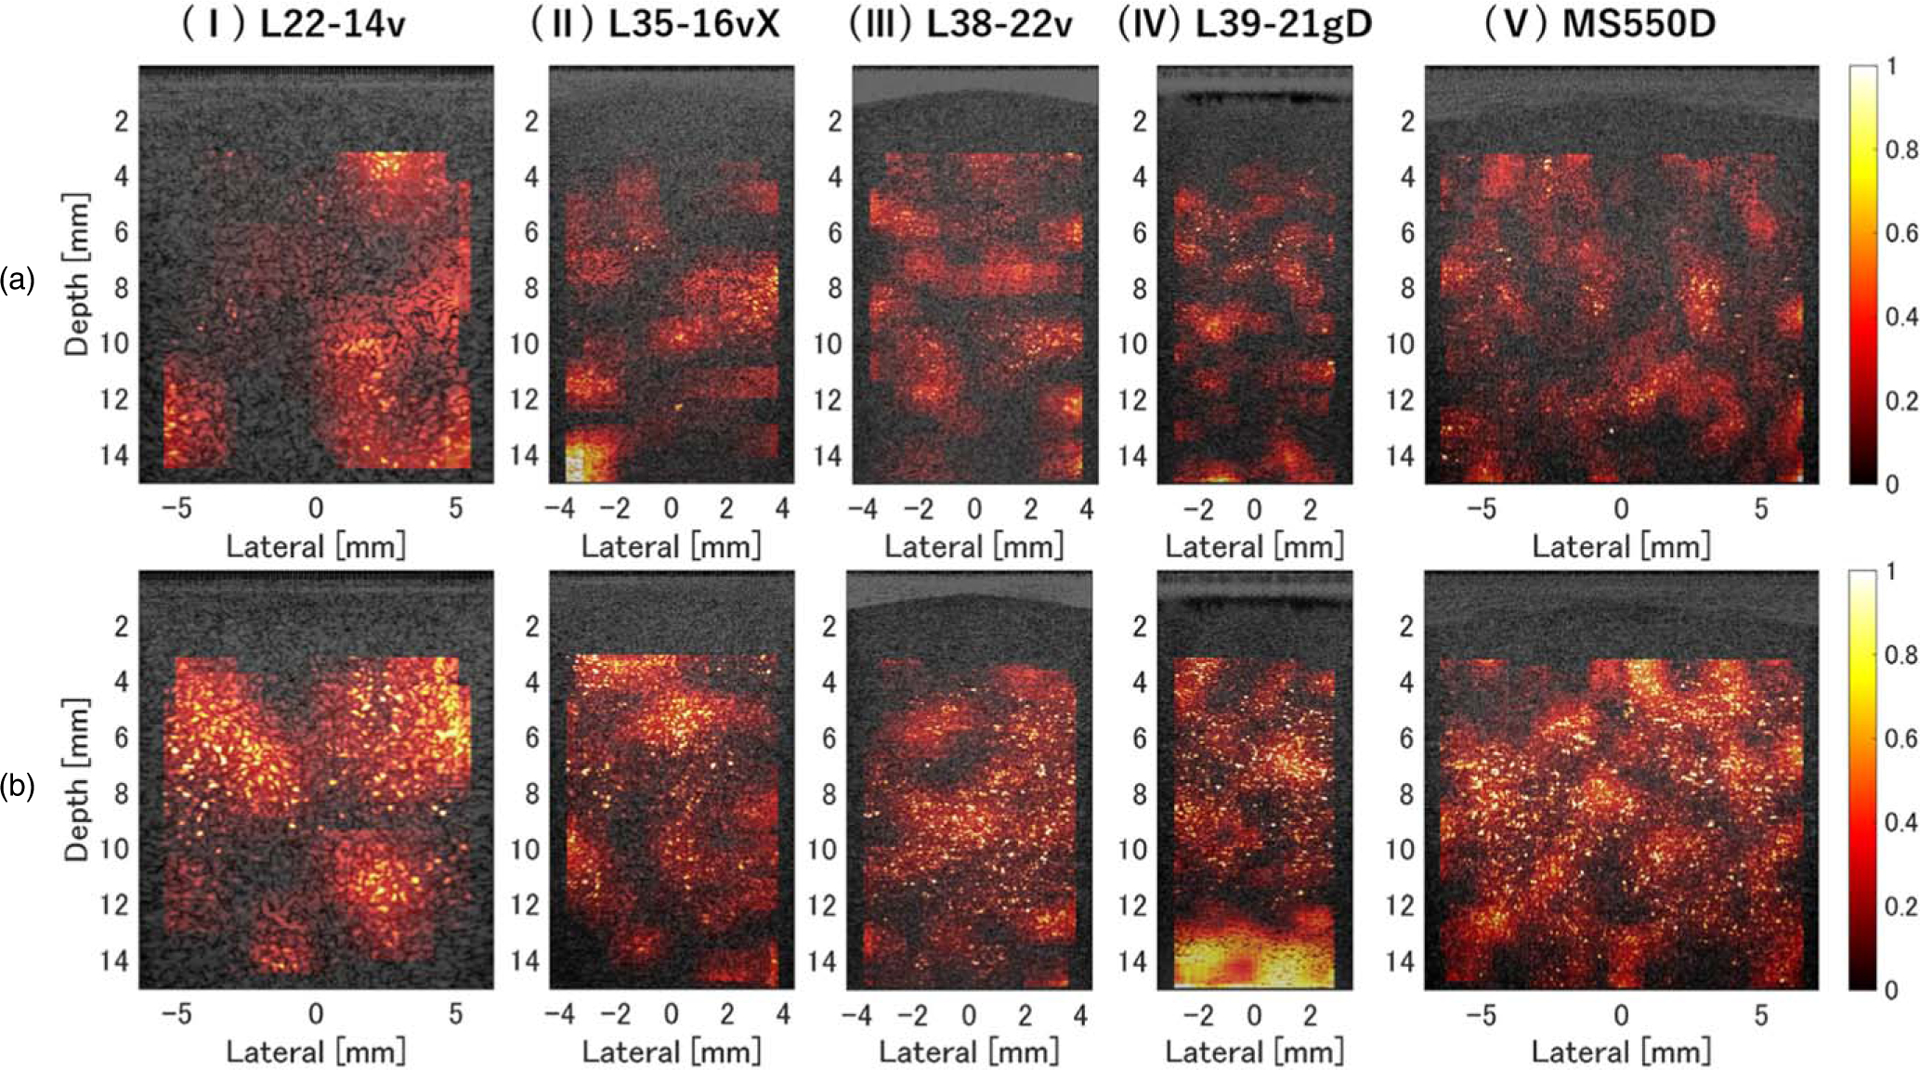
Parameterized images of the probability of including the component assigned to pF in the DN model, obtained using echo data for (a) normal liver and (b) fatty-liver phantoms. The measurement probes were (I) L22–14v, (II) L35–16vX, (III) L38–22v, (IV) L39–21gD, and (V) MS550D.
3.1.3. Relationship between sound field characteristics and envelope parameters.
Figure 8 shows color plots of each QUS parameter overlaid on the ultrasound image of the normal-liver phantom A. The value of μL was close to 1 at all depths [Fig. 8(i)]. Areas in which values of μF [Fig. 8(ii)] and αωF [Fig. 8(iii)] were low were found to be composed of only one dispersion component (pL), which confirmed that they contained a single scatterer type distributed homogeneously throughout the entire region.
Fig. 8.
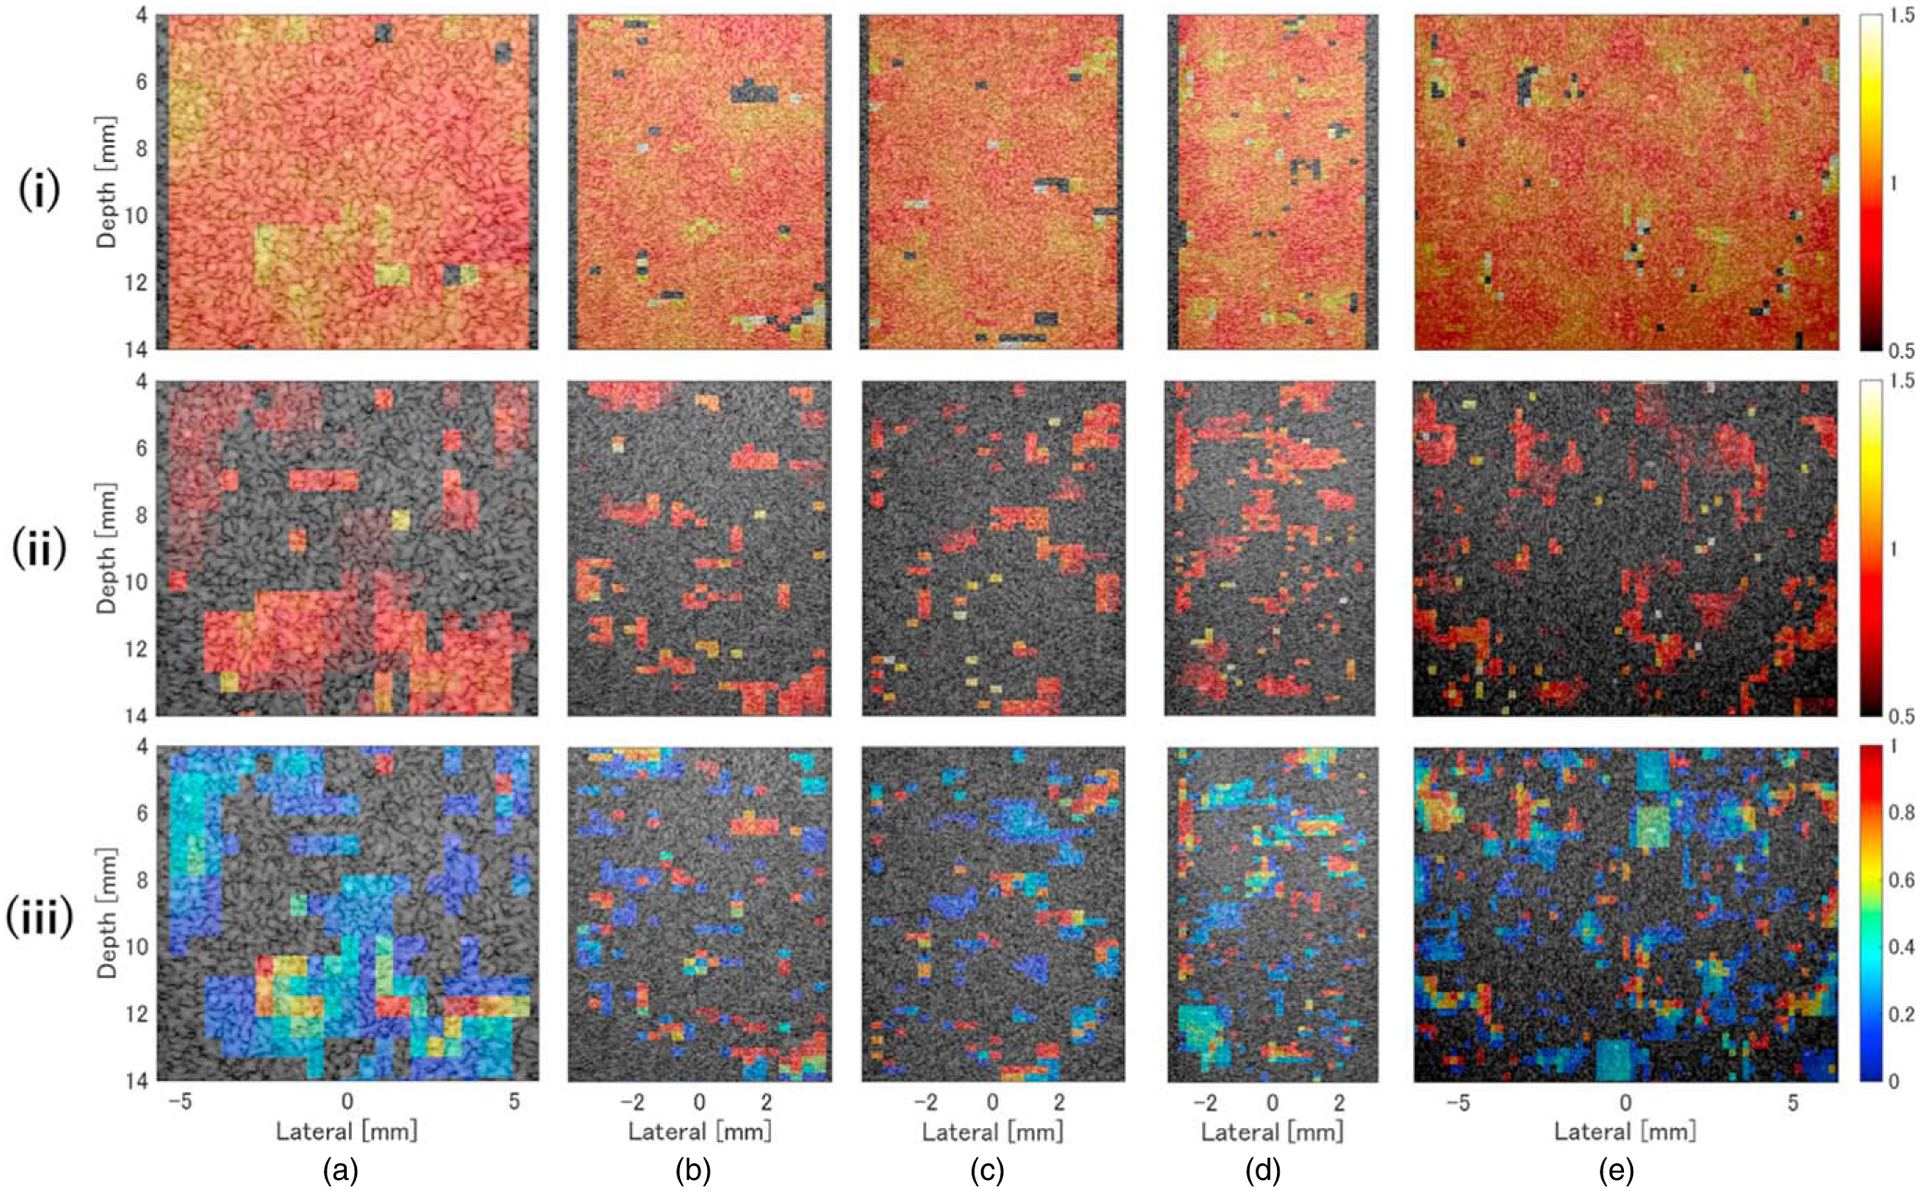
Color density plots of (i) density of normal liver (μL), (ii) density of lipid droplets (μL), and (iii) intensity of echo signals from lipid droplets (αωF) for the normal liver phantom A, overlaid on the ultrasound image. The measurement probes were (a) L22–14v, (b) L35–16vX, (c) L38–22v, (d) L39–21gD, and (e) MS550D.
Figure 9 shows the same analysis as above for the fatty-liver phantom D. Similar to phantom A, the value of μL was close to 1 in the entire area [Fig. 9(i)], and no depth dependence was observed. In addition, no depth dependence or effect on acoustic characteristics of μF [Fig. 9(ii)] or αωF [Fig. 9(iii)] was observed except for the L35–16vX and L39–21gD probes, which could not be evaluated because depth-dependent ultrasound attenuation was too high. These results show that neither the QUS parameters nor acoustic characteristics depended on depth for any of the probes. Moreover, the accuracy of the amplitude envelope evaluation was confirmed using HF CPWI in areas where echo signals were acquired with sufficient signal-to-noise for analysis, as in previous studies.52)
Fig. 9.
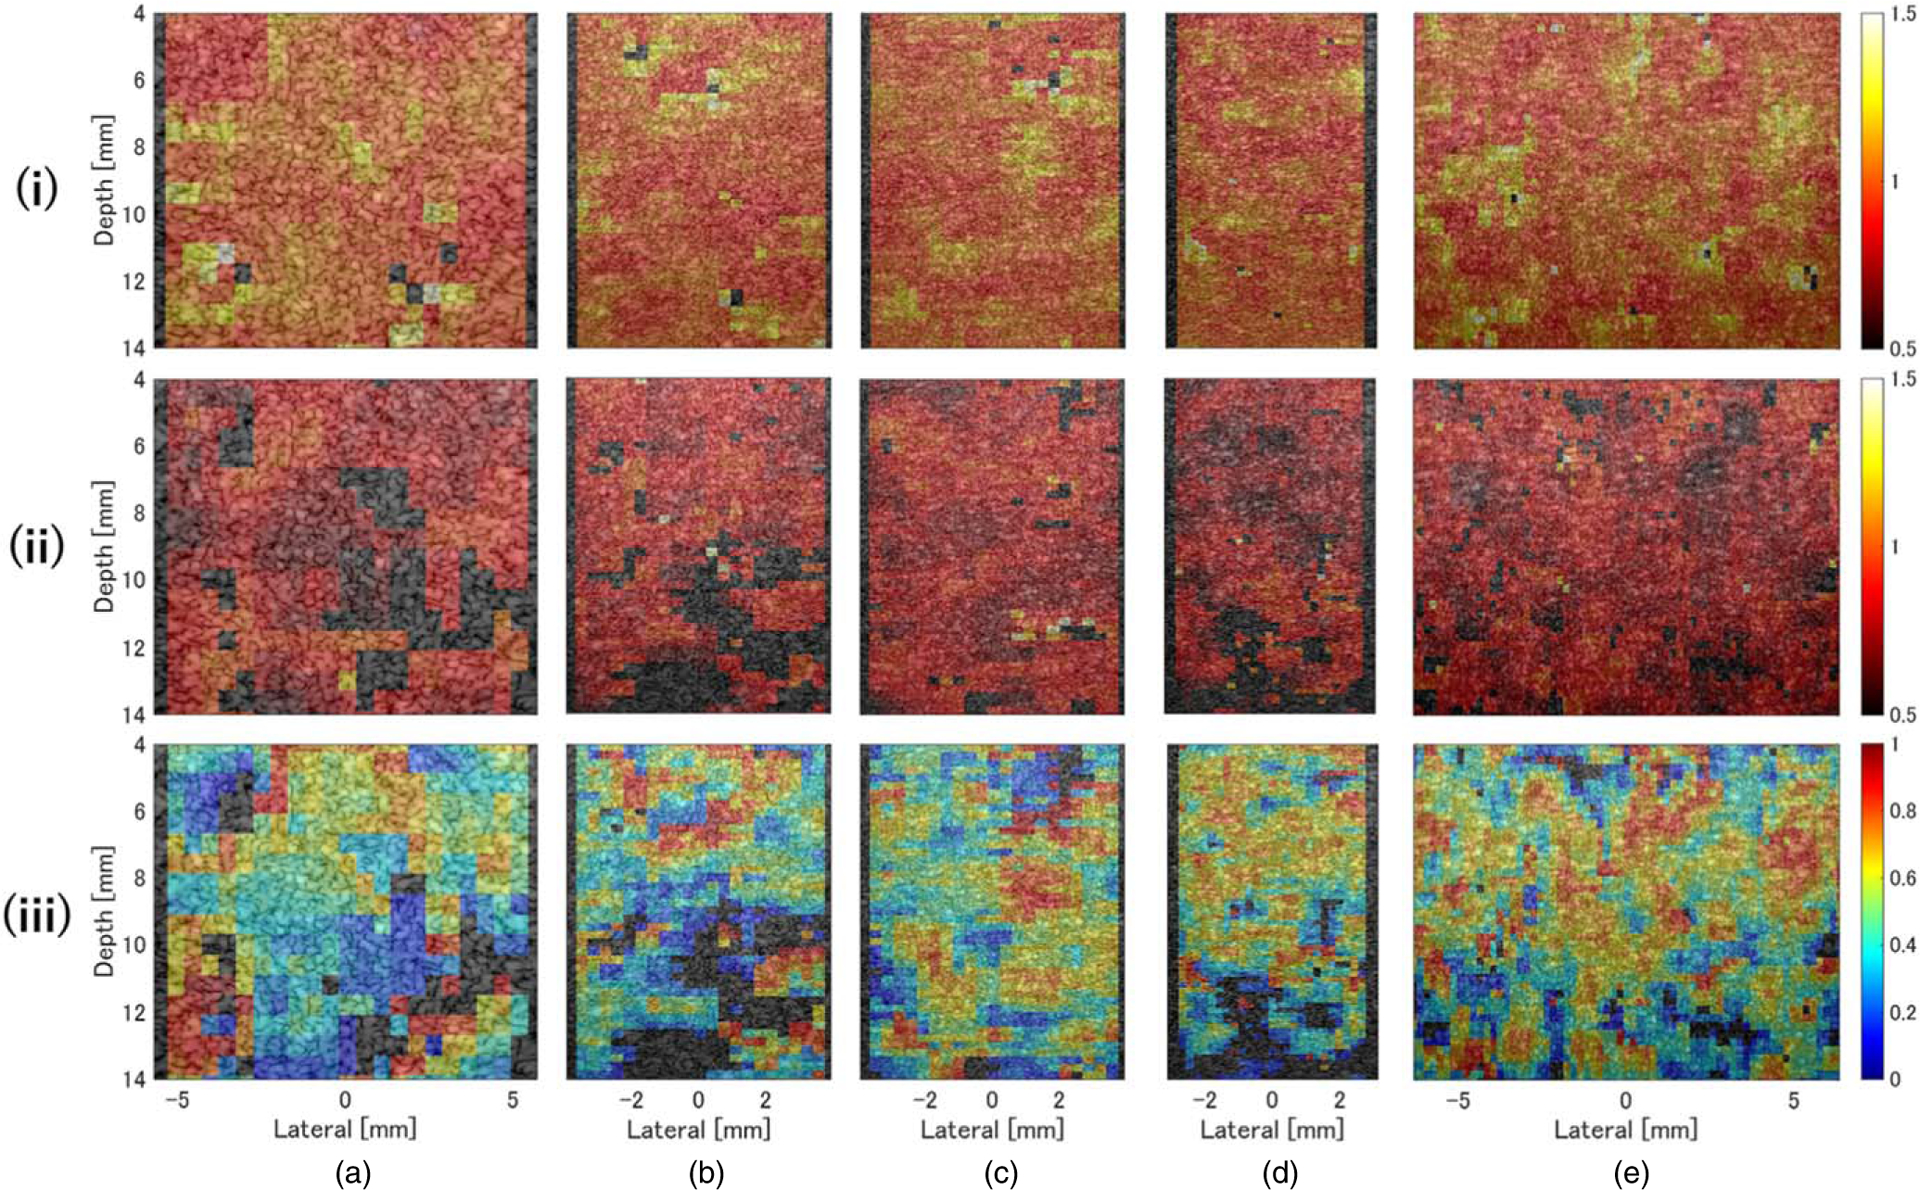
Color density plots of (i) μL, (ii) μF, (iii) and αωF for the fatty liver phantom D, overlaid on the ultrasound image. The measurement probes were (a) L22–14v, (b) L35–16vX, (c) L38–22v, (d) L39–21gD, and (e) MS550D.
The differences in evaluation accuracy between probes were examined using the QUS parameters shown in Table V. The value of μL was close to 1 for all probes, indicating that the evaluation of the underlying speckle characteristics was independent of sound field characteristics (e.g. spatial resolution) and accurately evaluated for each probe. The accuracy of αωF measurement, which is strongly related to the percentage of high-intensity echo components, tended to improve with increasing probe frequency. These results imply that the finer the resolution, the smaller the influence of sound field characteristics on amplitude envelope statistics and the more robust the evaluation. The values of μF and αωF were particularly affected by the sound field characteristics of each probe (Figs. 2 and 3); thus, it was expected that there would be some dependence of _these parameters on the depth of the ROI. However, such dependence was not observed, suggesting that the DN model can be applied to data acquired and generated using a HF (⩾15 MHz) linear-array probe and CPWI to enable highly accurate quantitative evaluation of fat characteristics. In the theory of amplitude envelope analysis, measurement accuracy depends on the sound pressure distribution in the ROI. However, using CPWI makes the sound pressure distribution uniform over a wide depth range, reducing the influence of statistical fluctuations due to steep changes in the sound pressure distribution derived from the transmission/reception characteristics, independent of the ROI location, and enabling highly robust evaluation. Of course, when the sound pressure fluctuation in the ROI is extremely large, the intensities of signals scattered from the same type of source differ from those compatible with general amplitude envelope analysis, resulting in evaluation errors.52)
3.2. Relationship between histological properties and QUS parameters
3.2.1. Fatty liver phantoms with different fat content.
To investigate the relationship between the scatterer structure and the evaluation results with the DN model, the L39–21gD probe was used to measure phantoms A–F, which had different volume fractions of strong scatterers (Table II). Amplitude envelope statistics of the acquired echo signals were analyzed as described in Sects. 3.1.1 and 3.1.2, and the results are summarized in Fig. 10. The number of strong scatterers per PSF (78 μm [axial] × 107 μm [lateral] × 107 μm [elevational]) was calculated from the volume fractions given in Table II and found to be 0, 0.1, 1, 4, 10, and 20 for phantoms A–F, respectively. For all phantoms, μL was close to 1, as reported in Sect. 3.1. The number of strong scatterers per PSF correlated negatively with μF (r = −0.76) and positively with αωF (r = 0.72).
Fig. 10.

Values of (i) μL, (ii) μF, (iii) αωF for tissue-mimicking phantoms A–F with compositions defined in Table II.
General theory states that when there are 10–20 scatterers in a PSF, the Nakagami distribution will follow a Rayleigh distribution with μ = 1 or a post-Rayleigh distribution with μ > 1, but the results of this study show the opposite trend. To determine whether this discrepancy is DN model-specific or an inherent property of the strong scatterer, the echo signals of each phantom were evaluated using the Nakagami distribution. Figure 11 shows that none of the phantoms followed a Rayleigh distribution, with μ being negatively correlated with the number of scatterers in the PSF. It is assumed that the origin of the above phenomenon differs from that of speckle generation in the low-frequency band and is instead connected with the relationship between wavelength, PSF, and scatterer size under HF conditions, in addition to the large acoustic impedance of the 10 μm scatterer. Specifically, when the volume fraction of the 10 μm spheroids is low, the scattering from one does not interfere that of its neighbors, resulting in a pre-Rayleigh distribution (μ < 1.0); when the volume fraction is high, the echo signal is scattered in phase by neighboring spheroids. In other words, the statistical analysis showed that all fatty liver phantoms contained a large amount of echo information that was not affected by signal interference from neighboring scatterers. Hence, we may conclude that μF reflects the characteristics of this scatterer structure, thus explaining its negative correlation with the number of scatterers.
Fig. 11.
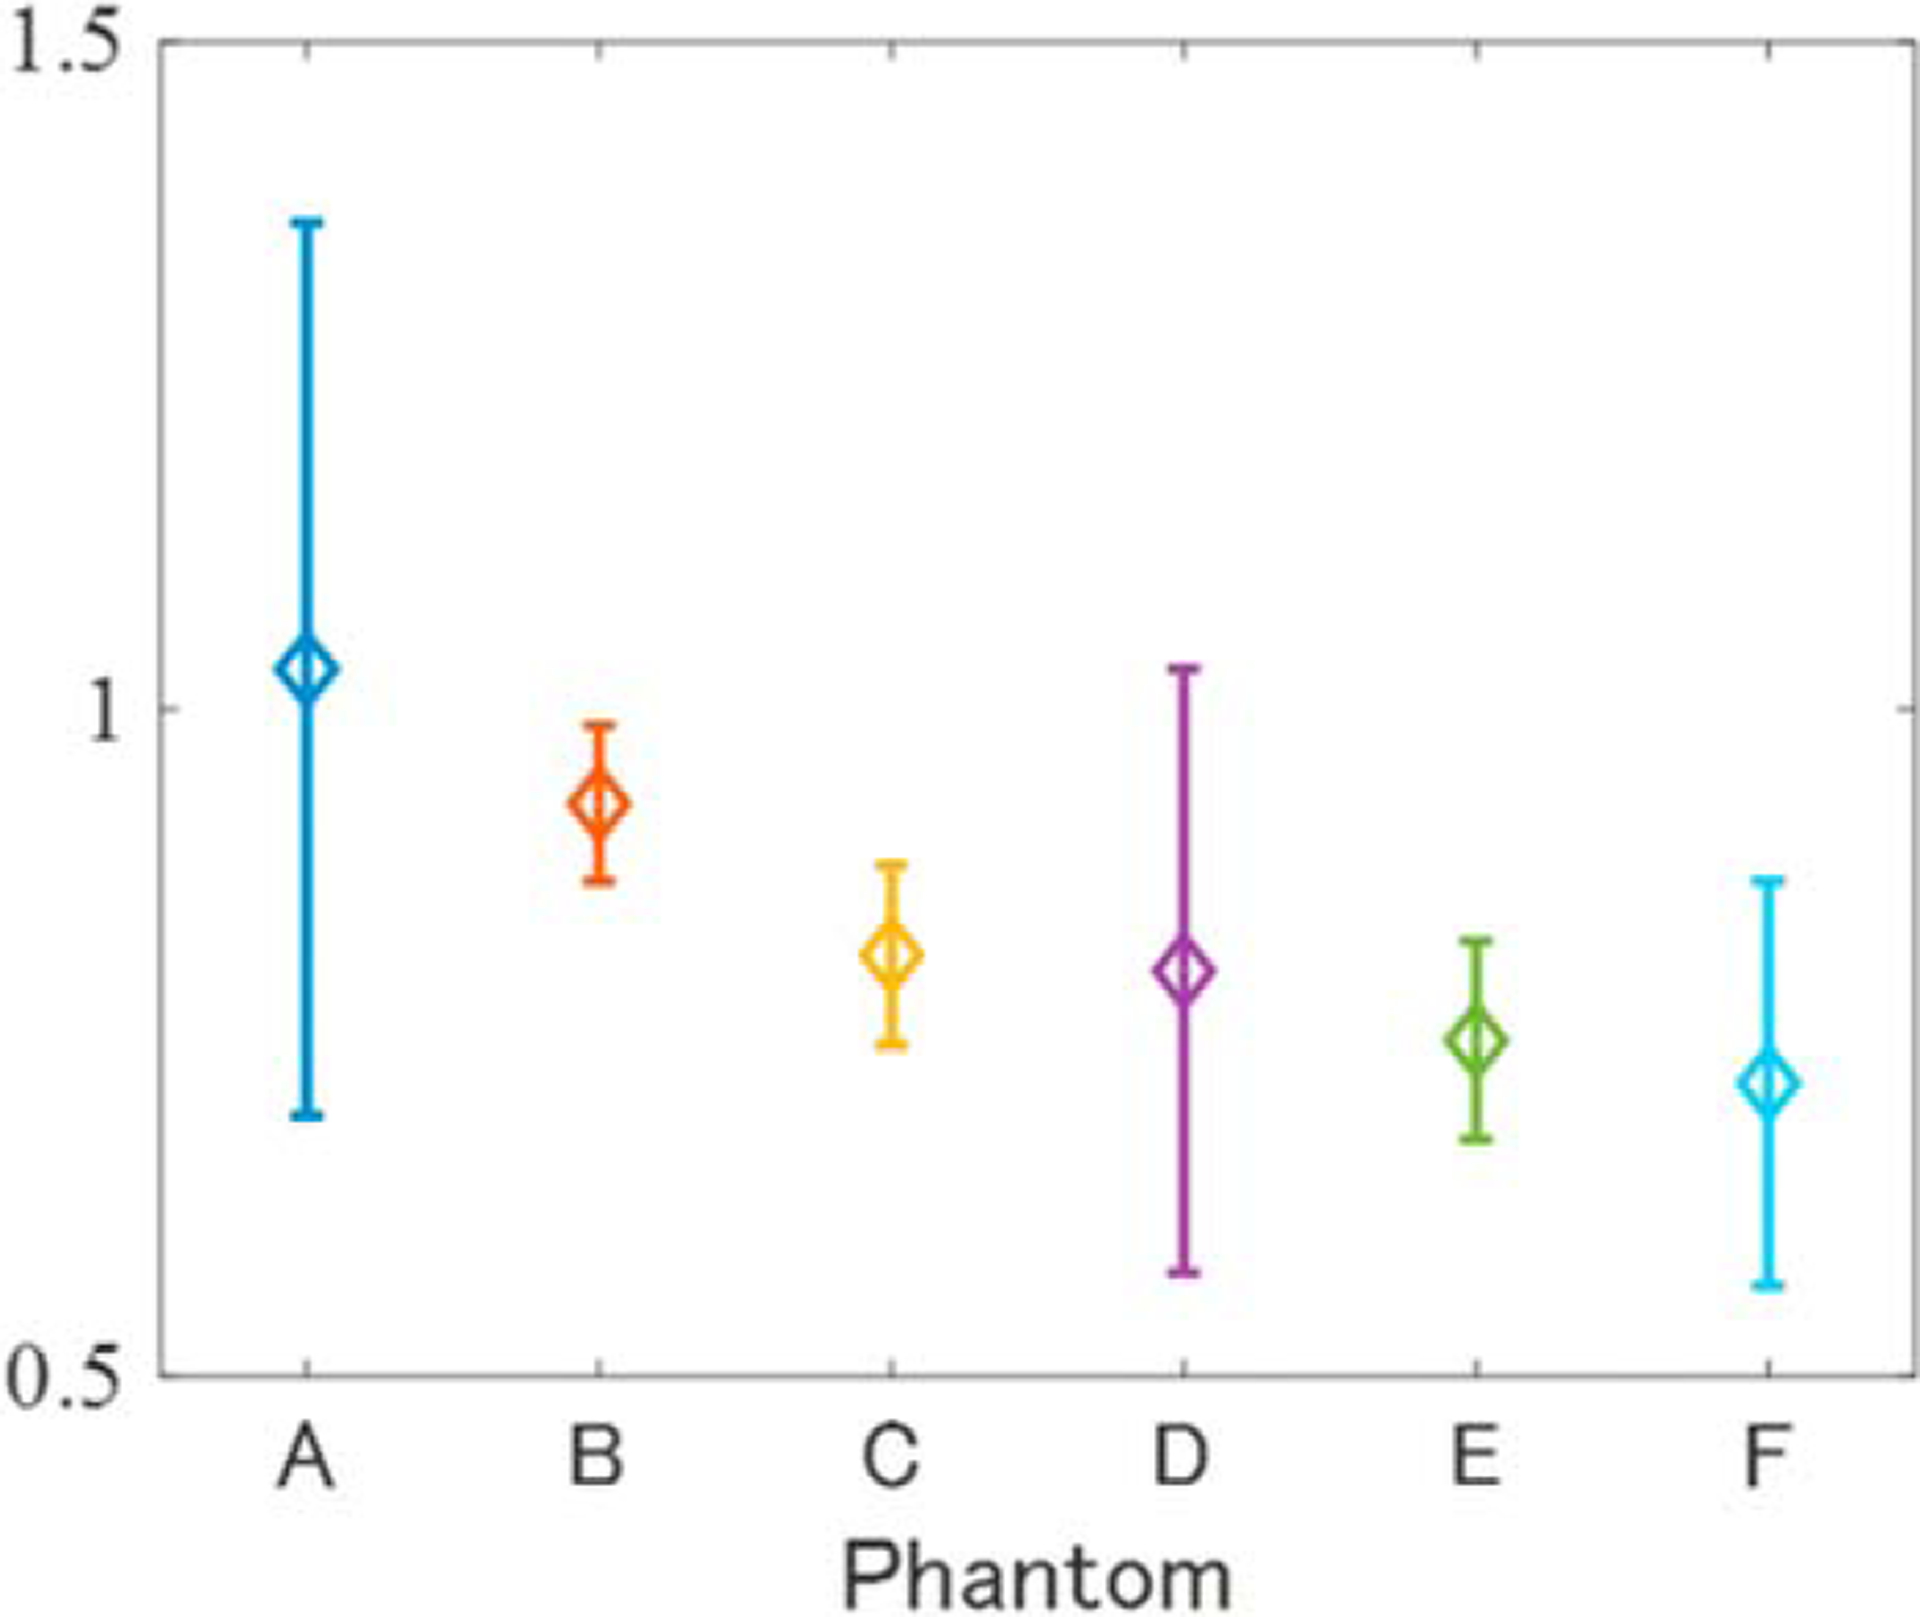
Shape of Nakagami distribution (μ) for tissue-mimicking phantoms A–F.
Figure 12 shows the two-dimensional probability distribution in polar coordinates of the estimated DN model parameters (deflection direction, μF; diameter direction, αωF). It shows that the distribution of αωF was positively skewed as the number of strong scatterers increased. Figure 13 shows the PDF of the DN model and the probability images of pL and pF within the red boxes in Figs. 12(c) and 12(f) where the distributions were concentrated. Figure 13(a-ii) shows a larger dispersion ratio of pL to pF than Fig. 13(a-i). This indicates that the number of high-echo signals increased in proportion to the number of strong scatterers, and these characteristics are also visible in Figs. 13(c-i) and Figs. 13(c-ii). These results indicate that the fraction of the echo signal attributable to the large dispersion component pF increased commensurately with the number of strong scatterers. Therefore, the DN model combined with HF ultrasound can be used to quantitatively evaluate the microstructure of a target object comprising a mixture of two types of scatterers with different acoustic properties.
Fig. 12.

Two-dimensional probability distributions in polar coordinates of the estimated pF parameters for (a) phantom A, (b) phantom B, (c) phantom C, (d) phantom D, (e) phantom E, and (f) phantom F.
Fig. 13.
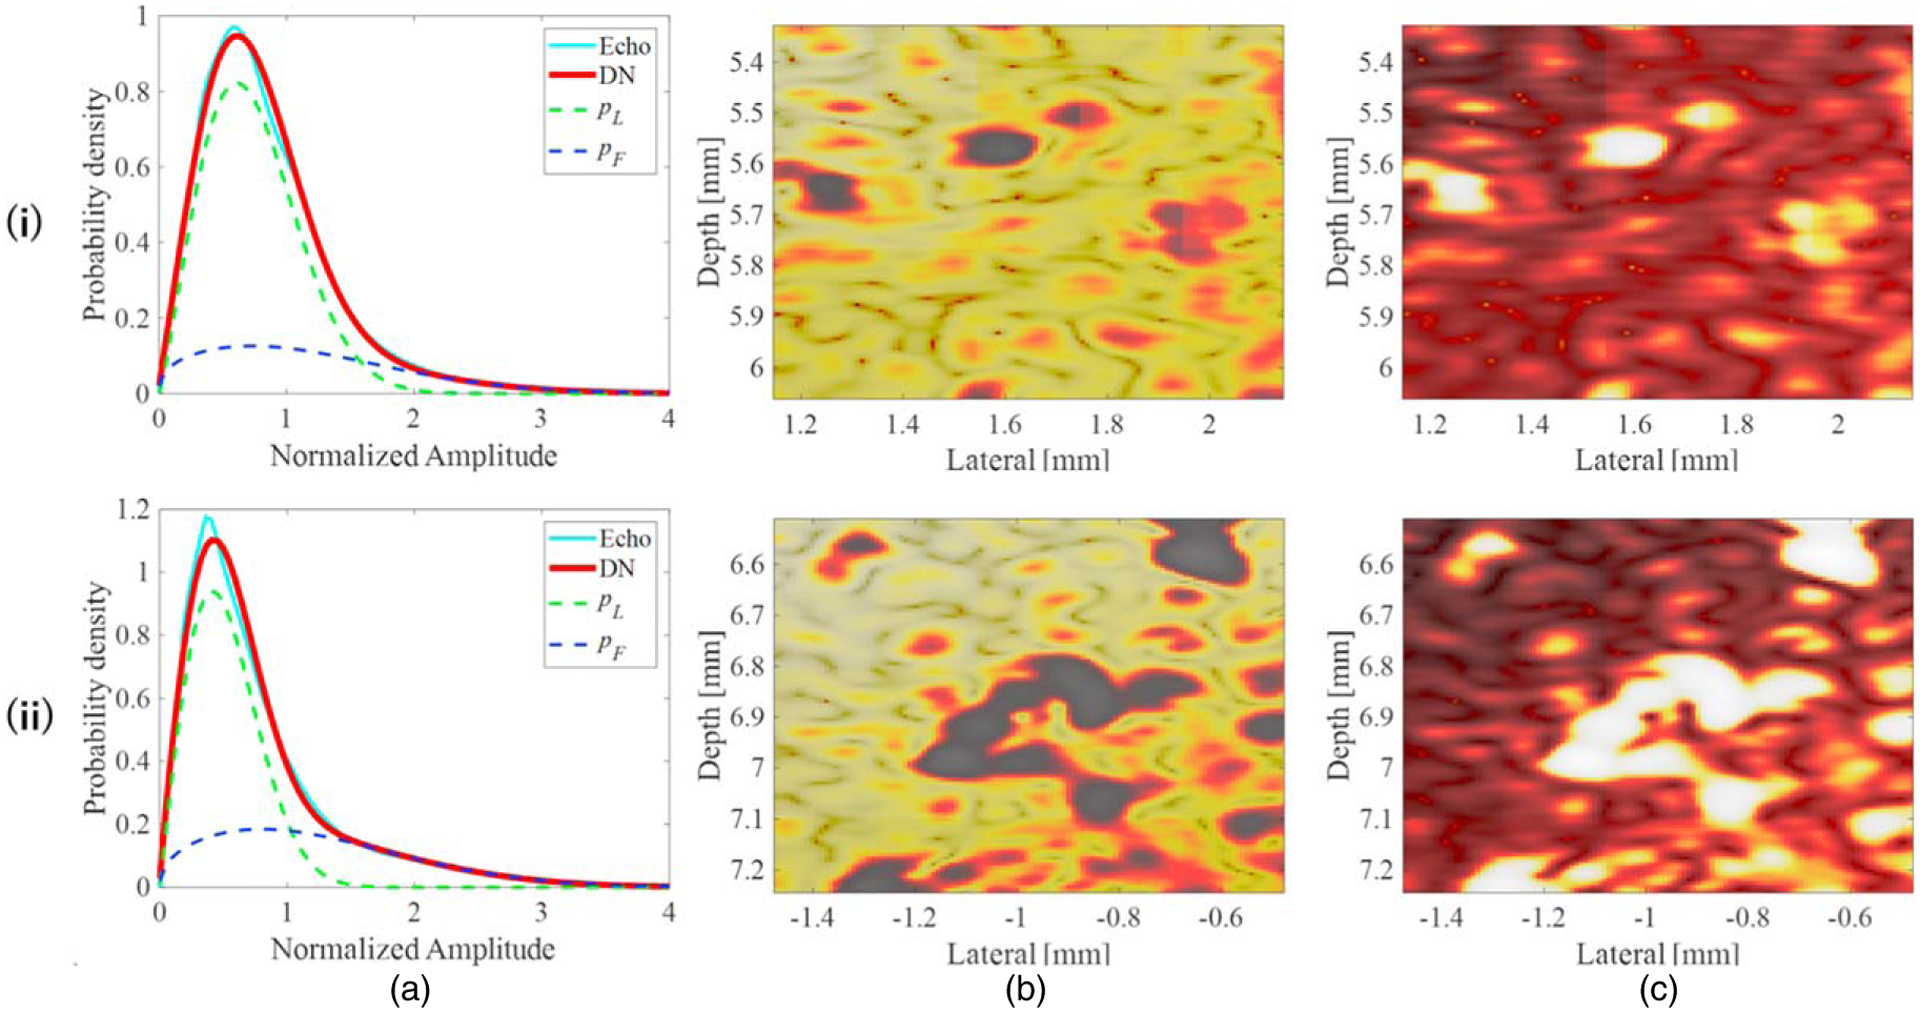
(a) PDF of the DN model, and probability images of (b) pL and (c) pF within the areas outlined by the red boxes in (i) Fig. 12(c) and (ii) Fig. 12(f).
3.2.2. Characterization of rat livers with different degrees of lipidification.
Based on the relationship between the QUS parameters and the content of strong scatterers in fatty liver phantoms, ex vivo studies were performed on authentic fatty livers in rats. Echo data were acquired by opening the abdomen of the rats to expose the liver and fixing the probe to the upper surface of the liver via a scatter-free coupling gelatin plate. The ultrasound transmission and reception conditions were the same as those described in Sect. 3.2.1. Because the rat livers were very small compared with the phantoms, the areas in which ROIs could be set was limited. Therefore, for each liver, ROIs were manually set in areas that did not contain artifacts from non-hepatic tissues.
Figure 14 shows the QUS parameters estimated using the DN model for rat livers in each pathological state. For all such states, μL was close to 1 [Fig. 14(i)], μF was smaller than 1 [Fig. 14(ii)], and αωF tended to correlate with the degree of lipidification [Fig. 14(iii)], consistent with the trend seen in Fig. 10 and described in Sect. 3.2.1. These results indicate that the degree of deposition of fat droplets, which are a strong scattering source in the liver, can be evaluated using the method proposed in this study.
Fig. 14.

Values of (i) μL, (ii) μF, (iii) αωF for rat livers in each pathological state.
The following points should be addressed to develop the method for clinical application. In the present study, the progression of lipidification in rats was classified based only on the amount of fat identified in the pathological images. Therefore, liver cells with the same degree of lipidification may contain both large and small fat droplets. In addition, the degree of fat droplet aggregation differs among individuals and among different measurement positions. As described in 3.2.1, differences in the microstructure of the object due to bias or aggregation of strong scatterers is strongly reflected in the echo signals obtained using HF ultrasound and the DN-model. In addition, it is assumed that such structures cannot be determined using general theoretical models such as the Nakagami distribution but can be quantified from power information via αωF using the DN-model (Fig. 7). Therefore, variation in αωF values for rat liver [Fig. 14(iii)], and the fact that μF does not depend on the total fat droplet volume, may be used to evaluate the micro-scatterer structure involving a mixture of fat droplet sizes.
Because the size of lipid droplets and the width of their distribution in the fatty liver of humans are larger than those in rats, it is necessary to study phantoms that more closely resemble human liver tissue prior to clinical application of the method described herein.
4. Conclusions
Echo data for fatty liver phantoms acquired with five different HF linear array probes and CPWI were analyzed using the DN model, and the results showed that it was possible to infer the presence of stable fat droplets with a small spatial dependence using any probe, except when images were strongly affected by artifacts. The relationship between QUS parameters and fat mass was also assessed by comparing 10 rat livers having different degrees of fat deposition with normal livers. Compared with previous studies using a single focused transducer, the linear array probe can observe biological tissues under a wider variety of conditions and is expected to be used in future clinical applications. However, the rat liver is too small to be used for robustness validation, so additional validation must be performed using echo data for phantoms that more closely resemble the structure of human liver tissue.
Acknowledgments
This work was partly supported by JSPS KAKENHI (Grant Nos. 22KK0179 and 23H03758) and Chiba University Institute for Advanced Academic Research and National Institutes of Health (Grant Nos. EB032082 and HL159869). This research was approved by the Chiba University Institutional Animal Care and Use Committee. We thank Edanz (https://jp.edanz.com/ac) for editing a draft of this manuscript.
References
- 1).Abe K, Arakawa M, and Kanai H, J. Med. Ultrason 46, 27 (2019). [DOI] [PubMed] [Google Scholar]
- 2).Imbault M, Faccinetto A, Osmanski BF, Tissier A, Deffieux T, Gennisson JL, Vilgrain V, and Tanter M, Phys. Med. Bio 62, 3528 (2017). [DOI] [PubMed] [Google Scholar]
- 3).Tsujimoto Y, Matsuda D, Minamiguchi K, Tanaka T, Hirai T, and Akiyama I, Jpn. J. Appl. Phys 58, SGGE01 (2019). [Google Scholar]
- 4).Hasegawa H and Nagaoka R, J. Med. Ultrason 46, 297 (2019). [DOI] [PubMed] [Google Scholar]
- 5).Fujiwara Y, Kuroda H, Abe T, Ishida K, Oguri T, Noguchi S, Sugai T, Kamiyama N, and Takikawa Y, Ultrasound Med. Biol 44, 2223 (2018). [DOI] [PubMed] [Google Scholar]
- 6).Kanayama Y, Kamiyama N, Maruyama K, and Sumino Y, Ultrasound Med. Biol 39, 692 (2013). [DOI] [PubMed] [Google Scholar]
- 7).Ino M, Yoshida K, Hirata S, and Yamaguchi T, J. Med. Ultrason 49, 569 (2022). [DOI] [PubMed] [Google Scholar]
- 8).Franceschini E, Guillermin R, and Tourniaire F, J. Acoust. Soc. Am 135, 3620 (2014). [DOI] [PubMed] [Google Scholar]
- 9).Oguri T, Omura M, Saito W, Yoshida K, and Yamaguchi T, Jpn. J. Appl. Phys 60, SDDE24 (2021). [Google Scholar]
- 10).Omura M, Nagaoka R, Yagi K, Yoshida K, Yamaguchi T, and Hasegawa H, Jpn. J. Appl. Phys 61, SG1067 (2022). [Google Scholar]
- 11).saito W, Omura M, Ketterling JA, Hirata S, Yoshida K, and Yamaguchi T, Jpn. J. Appl. Phys 61, SG1049 (2022). [Google Scholar]
- 12).Ito D, Oguri T, Kamiyama N, Hirata S, Yoshida K, and Yamaguchi T, Jpn. J. Appl. Phys 60, SDDE11 (2021). [Google Scholar]
- 13).Osato K, Oguri T, Kamiyama N, Hirata S, Yoshida K, and Yamaguchi T, Jpn. J. Appl. Phys 62, SJ1054 (2023). [Google Scholar]
- 14).Minagawa M, Hasegawa H, Yamaguchi T, and Yagi S, Jpn. J. Appl. Phys 57, 07LF07 (2018). [Google Scholar]
- 15).Kawamura H, Mori S, Arakawa M, and Kanai H, Jpn. J. Appl. Phys 59, SKKE24 (2020). [Google Scholar]
- 16).Raju BI, Swindells KJ, Gonzalez S, and Srinivasan MA, Ultrasound Med. Biol 29, 825 (2003). [DOI] [PubMed] [Google Scholar]
- 17).Omura M, Yoshida K, Akita S, and Yamaguchi T, Jpn. J. Appl. Phys 57, 07LF15 (2018). [Google Scholar]
- 18).Nam K, Zagzebski JA, and Hall TJ, Ultrason. Imaging 35, 146 (2013). [DOI] [PMC free article] [PubMed] [Google Scholar]
- 19).Osapoetra LO, Sannachi L, DiCenzo D, Quiaoit K, Fatima K, and Czarnota GJ, Transl. Oncol 13, 100827 (2020). [DOI] [PMC free article] [PubMed] [Google Scholar]
- 20).Yamane R, Mori S, Arakawa M, Wilhjelm JE, and Kanai H, Jpn. J. Appl. Phys 62, SJ1042 (2023). [Google Scholar]
- 21).Mori S, Arakawa M, and Kanai H, Ultrasound Med. Biol 49, 875 (2022). [DOI] [PubMed] [Google Scholar]
- 22).Omura M, Yagi K, Nagaoka R, and Hasegawa H, J. Med. Ultrason 50, 131 (2023). [DOI] [PMC free article] [PubMed] [Google Scholar]
- 23).Mamou J, Coron A, Hata M, Machi J, Yanagihara E, Laugier P, and Feleppa EJ, Ultrasound Med. Biol 36, 361 (2010). [DOI] [PMC free article] [PubMed] [Google Scholar]
- 24).Bui TM, Coron A, Mamou J, Saegusa-Beecroft E, Yamaguchi T, Yanagihara E, Machi J, Bridal SL, and Feleppa EJ, Jpn. J. Appl. Phys 53, 07KF22 (2014). [DOI] [PMC free article] [PubMed] [Google Scholar]
- 25).Omura M, Saito W, Akita S, Yoshida K, and Yamaguchi T, Ultrasound Med. Biol 48, 646 (2022). [DOI] [PubMed] [Google Scholar]
- 26).Burckhardt CB, IEEE Trans. Sonics Ultrason 25, 1 (1978). [Google Scholar]
- 27).Yamaguchi T and Hachiya H, Jpn. J. Appl. Phys 37, 3093 (1998). [Google Scholar]
- 28).Yamaguchi T, Hachiya H, Kamiyama N, Ikeda K, and Moriyasu N, Jpn. J. Appl. Phys 40, 3900 (2001). [Google Scholar]
- 29).Weng L, Reid JM, Shankar PM, and Soetanto K, J. Acoust. Soc. Am 89, 2992 (1991). [DOI] [PubMed] [Google Scholar]
- 30).Shankar PM, Reid JM, Ortega H, Piccoli CW, and Goldberg BB, IEEE Trans. Med. Imaging 12, 687 (1993). [DOI] [PubMed] [Google Scholar]
- 31).Shankar PM, Dumane VA, George T, Piccoli CW, Reid JM, Forsberg F, and Goldberg BB, Phys. Med. Biol 48, 2229 (2003). [DOI] [PubMed] [Google Scholar]
- 32).Tsui PH and Chang CC, Ultrasound Med. Biol 33, 608 (2007). [DOI] [PubMed] [Google Scholar]
- 33).Tsui PH and wan YL, J. Med. Ultrason 24, 47 (2016). [Google Scholar]
- 34).Zhou Z, Tai D, Wan YL, Tseng JH, Lin YR, Wu S, Yang KC, Liao YY, Yeh CK, and Tsui PH, Ultrason. Med. Biol 44, 1327 (2018). [DOI] [PubMed] [Google Scholar]
- 35).Takeuchi M et al. , Ultrasound Med. Biol 47, 3301 (2021). [DOI] [PubMed] [Google Scholar]
- 36).Igarashi Y, Ezuka H, Yamaguchi T, and Hachiya H, Jpn. J. Appl. Phys 49, 07HF06 (2010). [Google Scholar]
- 37).Higuchi T, Hirata S, Yamaguchi T, and Hachiya H, Jpn. J. Appl. Phys 53, 07KF27 (2014). [Google Scholar]
- 38).Mori S, Hirata S, Yamaguchi T, and Hachiya H, Jpn. J. Appl. Phys 54, 07LF20 (2015). [Google Scholar]
- 39).Zhang C, Hirata S, and Hachiya H, Jpn. J. Appl. Phys 59, SKKE27 (2020). [Google Scholar]
- 40).Fang F, Fang J, Li Q, Tai DI, Wan YL, Tamura K, Yamaguchi T, and Tsui PH, Diagnostics 10, 1 (2020). [DOI] [PMC free article] [PubMed] [Google Scholar]
- 41).Sato Y, Tamura K, Mori S, Tai DI, Tsui PH, Yoshida K, Hirata S, Maruyama H, and Yamaguchi T, Jpn. J. Appl. Phys 60, SDDE06 (2021). [Google Scholar]
- 42).Tamura K, Mamou J, Yoshida K, Hachiya H, and Yamaguchi T, Jpn. J. Appl. Phys 59, SKKE23 (2020). [Google Scholar]
- 43).Mizoguchi T, Yoshida K, Mamou J, Ketterling JA, and Yamaguchi T, Jpn. J. Appl. Phys 59, SKKE17 (2020). [DOI] [PMC free article] [PubMed] [Google Scholar]
- 44).Mori S, Hirata S, and Hachiya H, Jpn. J. Appl. Phys 53, 07KF23 (2014). [Google Scholar]
- 45).Mizoguchi T, Tamura K, Mamou J, Ketterling JA, Yoshida K, and Yamaguchi T, Jpn. J. Appl. Phys 58, SGGE08 (2019). [DOI] [PMC free article] [PubMed] [Google Scholar]
- 46).Ujihara Y, Tamura K, Mori S, Hirata S, Yoshida K, Maruyama H, and Yamaguchi T, Jpn. J. Appl. Phys 62, SJ1043 (2023). [Google Scholar]
- 47).Montaldo G, Tanter M, Bercoff J, Benech N, and Fink M, IEEE Trans. Ultrason. Ferroelectr. Freq. Control 56, 489 (2009). [DOI] [PubMed] [Google Scholar]
- 48).Ketterling JA and Silverman RH, IEEE Trans. Ultrason. Ferroelectr. Freq. Control 67, 934 (2020). [DOI] [PMC free article] [PubMed] [Google Scholar]
- 49).Ketterling JA, Aristizabal O, and Turnbull DH, IEEE Trans. Ultrason. Ferroelectr. Freq. Control 52, 627 (2006). [DOI] [PMC free article] [PubMed] [Google Scholar]
- 50).Ketterling JA, Ramachanfran S, and Aristizabal O, IEEE Trans. Ultrason. Ferroelectr. Freq. Control 53, 623 (2006). [DOI] [PMC free article] [PubMed] [Google Scholar]
- 51).Oya A, Yuta S, and Nakajima M, J. Med. Ultrason 16, 303 (1989). [Google Scholar]
- 52).Higa T, Ketterling JA, Mamou J, Hoering C, Gross DH, Zhang T, Shirai M, Hirata S, Yoshida K, and Yamaguchi T, 2P5–11. Proc. Symp. Ultrason. Electron 2023. [Google Scholar]


