

Abstract
The pulmonary circulation is a low-pressure, low-resistance circuit whose primary function is to deliver deoxygenated blood to, and oxygenated blood from, the pulmonary capillary bed enabling gas exchange. The distribution of pulmonary blood flow is regulated by several factors including effects of vascular branching structure, large-scale forces related to gravity, and finer scale factors related to local control. Hypoxic pulmonary vasoconstriction is one such important regulatory mechanism. In the face of local hypoxia, vascular smooth muscle constriction of precapillary arterioles increases local resistance by up to 250%. This has the effect of diverting blood toward better oxygenated regions of the lung and optimizing ventilation–perfusion matching. However, in the face of global hypoxia, the net effect is an increase in pulmonary arterial pressure and vascular resistance. Pulmonary vascular resistance describes the flow-resistive properties of the pulmonary circulation and arises from both precapillary and postcapillary resistances. The pulmonary circulation is also distensible in response to an increase in transmural pressure and this distention, in addition to recruitment, moderates pulmonary arterial pressure and vascular resistance. This article reviews the physiology of the pulmonary vasculature and briefly discusses how this physiology is altered by common circumstances.
Keywords: gravity, Zone model, fractal, hypoxic pulmonary vasoconstriction, pulmonary vascular resistance
The Distribution of Pulmonary Blood Flow
Introduction
The primary function of the pulmonary circulation is to deliver blood to the alveolar capillaries for gas exchange.1 The alveolar-capillary membrane is extremely thin to facilitate gas exchange, and as a result, pulmonary vascular pressures must remain low both to protect the thin blood–gas barrier and to allow for efficient diffusion of respiratory gases.1 Many of the mechanisms determining regional pulmonary blood flow are thought to be passive, particularly in the healthy lung, with active mechanisms initiated in circumstances such as hypoxia to facilitate local control of pulmonary blood flow distribution.
Before reviewing the factors affecting the distribution of pulmonary blood flow, clarification of terminology may be helpful. This is particularly important in the lung because of the strong effects that gravity and posture have on the distribution of perfusion (Fig. 1). The term “gravitationally nondependent” refers to the highest plane under consideration that is perpendicular to the direction of the gravitational vector, and in the upright lung this region is located in the apex. Conversely “gravitationally dependent” refers to a region perpendicular to the direction of the gravitational vector that is in the lowest plane of consideration, i.e., the lung base in the upright lung. Isogravitational refers to lung regions that are in the same plane with respect to the gravitational vector.
Fig. 1.

Schematic diagram of gravitational relationships. The large red arrow indicates the direction of the gravitational vector, the black arrow perpendicular to the gravitational vector indicates the isogravitational direction, i.e., lung regions that are isogravitational are all in the same plane with respect to gravity. Gravitationally nondependent lung is the highest isogravitational plane under consideration whereas gravitationally dependent is lowest plane of consideration.
West and Dollery performed the first measurements of the distribution of pulmonary blood flow in the upright human lung using inhaled radiolabeled CO2.2 The CO2, a soluble gas, was cleared from the alveolar space proportional to blood flow, leading to the discovery that pulmonary blood flow was not uniform across the lung, but rather, was greater in the lung bases than in the lung apices. West later wrote “I still remember our astonishment when measurements made in seated normal volunteers showed a striking increase in the clearance rate from the top to the bottom of the lung, because at that time there was little to suggest that it was not uniform.”3
Since then, a great many studies have evaluated the distribution of pulmonary blood flow, but despite this, there are numerous unanswered questions and many conflicting studies. There are several factors that contribute to this uncertainty that should be kept in mind when reviewing the available literature. Many of these issues relate to the frame of reference of measurement. For example, heterogeneity is a function of spatial scale and increases as resolution increases, so studies conducted at different resolutions may return apparently conflicting results. In addition, the lung is a deformable structure and deforms under its own weight, resulting in a gravitational gradient in regional lung tissue density4 and alveolar size,5 such that alveoli in the gravitationally nondependent lung are larger than in dependent lung. In a hypothetical lung with uniform perfusion per alveolus, any gradient in alveolar size results in an apparent reversed gradient in perfusion when imaged externally because the perfusion occurs within the walls of the alveoli.4 In other words, the deformation of the lung tissue means that the gravitationally dependent lung will have apparently greater perfusion in a given volume, because vessel density is greater; by correcting perfusion measurements for local tissue density, this apparent gradient is greatly reduced.4 These gradients also affect local transpulmonary and transmural pressures, and therefore large blood vessel, and capillary diameters5,6 and resistance to flow. Thus, lung volume of measurement affects not only interpretation of measures of heterogeneity, but also perfusion itself. Posture (discussed below) also has an effect on perfusion because the physical shape of the human lung is not symmetrical between postures, affecting transpulmonary pressure and lung stretch.7
In considering the distribution of blood flow in the lung, it would be a mistake to consider the pulmonary circulation in isolation. For example, local alveolar pressures influence the spatial distribution of pulmonary perfusion because the microcirculation of the lung is surrounded by alveoli, and the pressure within the alveoli exerts an external compressive force on the capillaries1 (discussed below). Since pulmonary blood vessels and capillaries are distensible,8,9 they respond in different ways to altered transpulmonary pressure. Lung expansion (i.e., increased transpulmonary pressure) stretches the capillaries, reducing their luminal diameter and increasing resistance. Two opposing effects act on the precapillary blood vessels as transpulmonary pressure increases: increased transmural pressure tends to increase the vessel diameter, whereas axial stretch of the vessel tends to decrease its diameter. The balance of radial and axial stretch determines the final vessel luminal size, and its resistance. The lung also undergoes large cyclical changes in volume with breathing. Regional changes in lung volume alter vascular diameters and hence regional resistances change throughout the breathing cycle. Importantly, the pulmonary circulation is a dynamic and integrated circuit where changes in flow within one region must influence flow elsewhere in the system.1
Structural Determinants of Pulmonary Blood Flow
The pulmonary vessels repeatedly branch, with a complete vascular tree created by repeatedly adding bifurcations at each terminal branch for up to 28 generations. A fractal structure is one that is composed of pieces that are similar to the structure as a whole, and the pulmonary vessels are considered a fractal tree/fractal network10 due to the repetitive branching that is consistent in form from the initial branch, until the final terminal branches11 (Fig. 2).
Fig. 2.

A dichotomous branching model. The basic transformation is the dichotomous branching of each terminal element. The asymmetric branching of the terminal branch divides initial flow (F0) into two fractions γ and 1 – γ that are distributed to the daughter branches, where γ = 0.5 would be equal distribution between daughter branches. Following a second iteration in which all terminal nodes branch again, blood flow is now distributed to four terminal branches. Numbers in blue show calculated flow to each branch based on F0 of 6 L/min and a γ of 0.6 and show how even relatively minor asymmetry in flow in the initial branches can give rise to large differences after a relatively small number of iterations. (Modified from Glenny and Robertson11.)
Fractal structures are advantageous in that they appear to create the largest possible surface area within a given volume, while simultaneously minimizing the materials needed to construct the vascular tree, the volume of blood needed to fill the vascular tree, and the work needed to perfuse the tree.11–14 The primary disadvantage of a fractal vascular tree is that it produces heterogeneous distributions of perfusion,1 since slight asymmetries of branching angle and radii in these fractal trees result in significant heterogeneity of blood flow distribution at the level of gas exchange1 (i.e., the acinus) (Fig. 2). For efficient exchange gas, it is critical that regional ventilation be matched with regional perfusion. Structurally, the matching of ventilation to perfusion within the lung is supported by having a fractal airway tree similar to the vascular tree. Indeed, airways and pulmonary arteries branch in union with each other,12,15 and while regional ventilation and perfusion are heterogeneous, they are closely correlated with each other (Fig. 3), ensuring efficient gas exchange.16,17
Fig. 3.
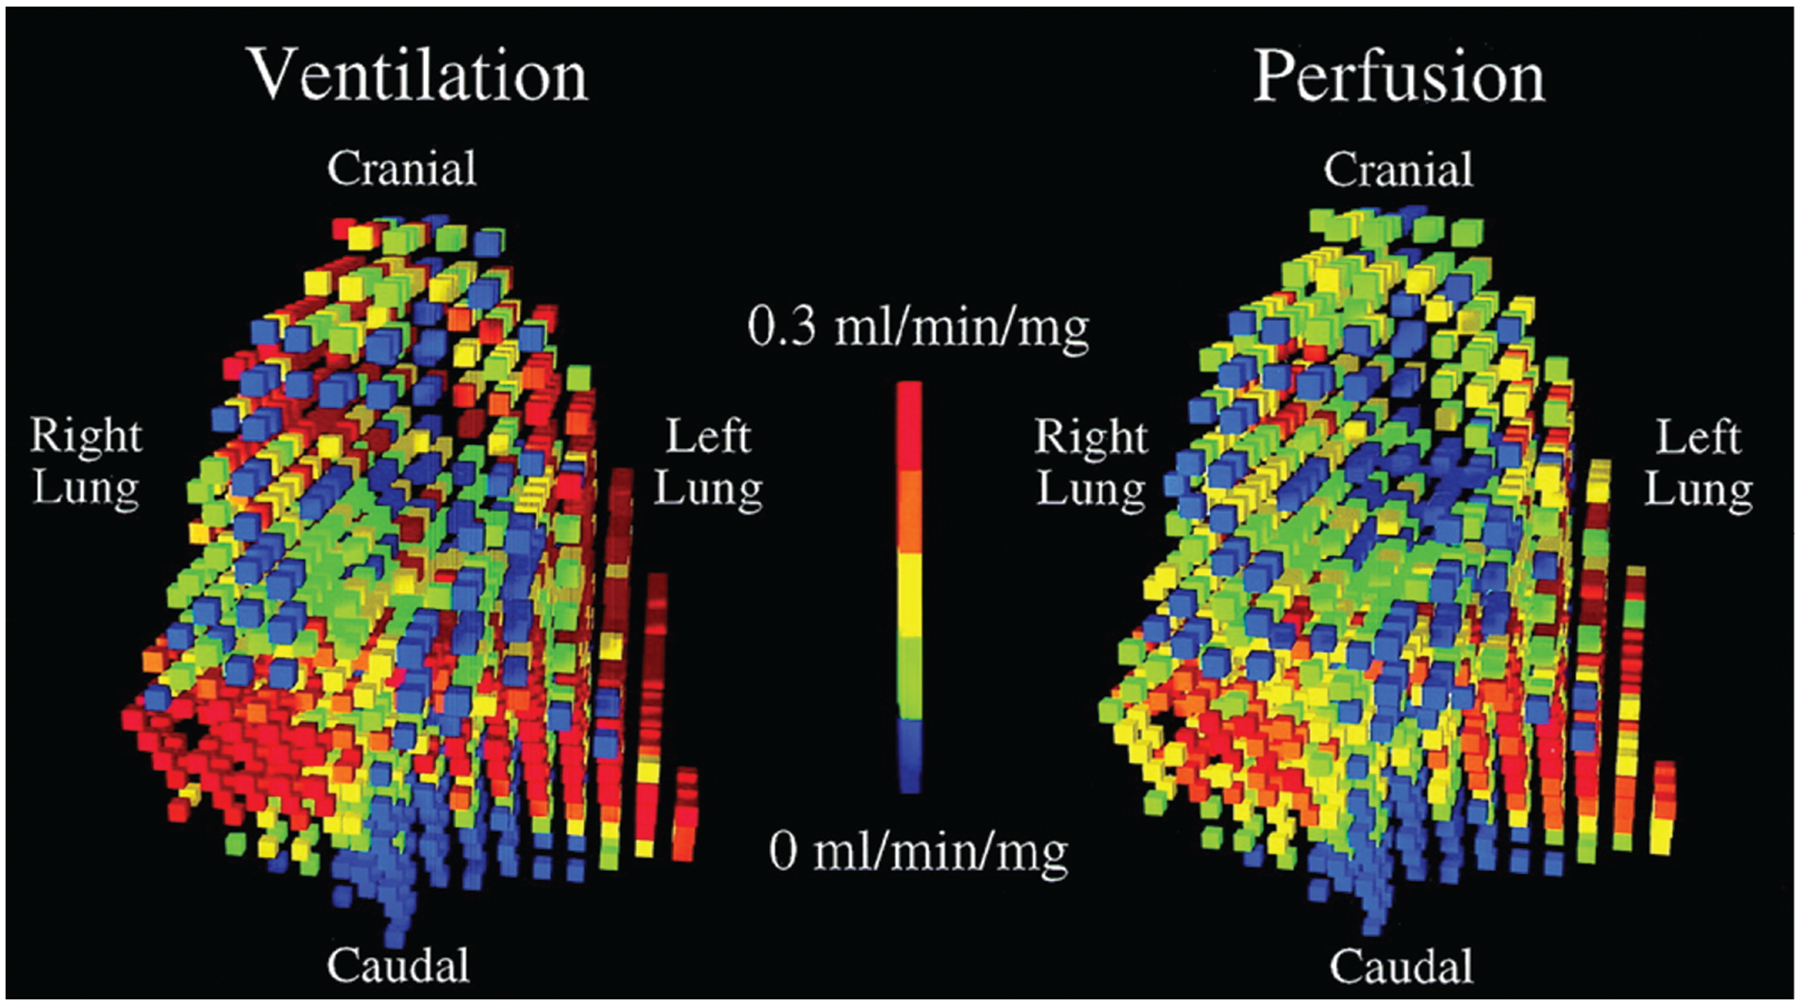
Regional ventilation and perfusion scaled to the measured minute ventilation and cardiac output in prone posture. Data are from a microsphere study in mechanically ventilated pigs. Ventilation was measured by inhaled aerosolized fluorescent microspheres, and perfusion from injected fluorescent microspheres. These microspheres lodge in the small airways and capillaries proportional to ventilation and perfusion respectively and are quantified in approximately 1 cm cubes postmortem. Both ventilation and perfusion display regional clustering in which adjacent regions have similar flows. Note the strong spatial correlation in which regions that receive high ventilation receive high perfusion and regions that receive less ventilation receive less perfusion. (Reproduced with permission from Altemeier et al17.)
Pulmonary Blood Flow Heterogeneity
Measurement of Pulmonary Blood Flow and Its Heterogeneity
A variety of techniques have been used to measure the distribution of pulmonary blood flow, including positron emission tomography (PET), single-photon emission computerized tomography (SPECT), computed tomography (CT), magnetic resonance imaging (MRI), and labeled microspheres (see Hopkins18 and Hsia et al,19 for review). Gravitational gradients as measures of heterogeneity are usually calculated as the slope of the relationship between perfusion and distance up the lung from the most gravitationally dependent surface.4,20 Higher resolution studies of the distribution of pulmonary blood flow utilize two major indices of heterogeneity-relative dispersion (also known as the coefficient of variation) and fractal dimension. The relative dispersion is calculated as the ratio of the mean to standard deviation of signal intensity or blood flow. It is a global index of spatial heterogeneity without considering the specific anatomic location.21 The advantage of the relative dispersion metric is that it is rather simple to calculate and does not require absolute quantification. Relative dispersion can be further broken down into an isogravitational component, which only considers variation across an isogravitational plane, and the variation in the direction of the gravitational vector.22 Importantly, relative dispersion is scale-dependent, meaning that the value increases as the resolution increases, much in the way that when viewed from an aircraft, an expanse of beach may appear a uniform color, but when viewed through a microscope there is a multitude of colors of the grains of sand.
This change in heterogeneity with resolution is the basis of calculation of another metric, the fractal dimension. As described above, a fractal structure is composed of pieces that are similar to the structure as a whole. Fractal dimension is a scale-independent measure of perfusion heterogeneity21 indicative of pulmonary vascular branching structure.23 The fractal dimension can be calculated by calculating the relative dispersion at the highest resolution of measurement21 and repeating this calculation in progressively larger blocks.21,24 A plot of log-relative dispersion versus log piece size is constructed21,24 with fractal dimension calculated as 1-slope of the relationship (Fig. 4). In rats,25 pulmonary perfusion heterogeneity has been shown to follow a fractal distribution to the level of the acinus. A fractal dimension of 1 represents a uniform distribution, whereas a fractal dimension of 1.5 represents a random distribution. The fractal dimension of pulmonary blood flow has been reported for several mammals—dogs, sheep, and horses,24,26,27 ranging from 1.09 to 1.17. Fractal dimension measured in normal humans is similar (approximately 1.1828).
Fig. 4.

Calculation of fractal dimension from imaging data. The relative dispersion (standard deviation/mean) is calculated at the highest resolution of measurement. This calculation is repeated by dividing the lung into progressively larger blocks, i.e., lower resolution. The fractal dimension is 1-slope of the relationship of the plot of log relative dispersion versus log piece size.
Large-Scale Effects on Regional Pulmonary Blood Flow: Gravitational Gradients and the Zone Model
Blood flow to a vascular bed is determined by the driving pressures and longitudinal resistances across the length of the circuit supplying and draining the region.11 The resistance to flow for any region is a summation of the longitudinal resistances through the arteries, capillaries, and veins serving that region.11 Most investigators identify the arterioles and venules as the highest resistance segments within the pulmonary circulation11; however, it is not well known which segments of the pulmonary vascular tree are the most important in determining regional flow. It is considered that all compartments (arterial, capillary, and venous) play a role in blood flow distribution.11 It is important to recognize that the driving pressures—the difference between upstream pulmonary arterial pressure (Pa) and downstream venous pressure (Pv)—are not uniform in the lung. Pulmonary vascular resistance (PVR) is discussed in detail below.
The low pressure of the pulmonary circulation ensures that there is just enough hydrostatic pressure to reach the apex of the upright lung, where the pressure is lower than at the lung base. In the lung, there is an additional complication compared with other vascular beds—the influences of alveolar pressure. Banister and Torrance29 were the first to show that the alveolar pressure could influence pulmonary blood flow and likened this effect to a “Starling resistor.”1 With a Starling resistor, flow is dependent on the relative relationships between the upstream and downstream pressures and a surrounding pressure.1 West et al subsequently advanced a simplified “Zone” model,30 which described pulmonary blood flow as occurring in three distinct zones whereby blood flow is dictated by the relationship between pulmonary arterial (upstream), pulmonary venous (downstream), and alveolar (surrounding) pressures. This model has become the default approach that is taught in all medical schools/pulmonary physiology courses (Fig. 5). In Zone III lung, the difference between upstream pulmonary arterial pressure (Pa) and downstream venous pressure (Pv) dictates flow just as it does in other organ circulations, because the alveolar (surrounding) pressure (PA) is low and thus Pa > Pv > PA. Regional flow is greatest in Zone III. Conversely when PA is greater than both Pa and Pv (i.e., Zone I), there is no flow as the capillary is collapsed due to the greater surrounding PA pressure. Zone II is an intermediate zone where Pa > PA > Pv, the driving pressure is the difference between Pa – PA, and flow is reduced relative to Zone III conditions. With the Zone model, the vertical height of the lung and the hydrostatic pressures due to gravity dictate that Zone I conditions are primarily in the gravitationally nondependent apex of the upright lung, with Zone II being around heart level, and Zone III conditions located at the gravitationally dependent base. Later, this model was modified to include a fourth zone, a region in the most dependent lung where pulmonary perfusion decreased as a function of height,31 which was originally ascribed to greater resistance in extra-alveolar vessels,31 although this is unconfirmed.32
Fig. 5.

The Zone model of pulmonary perfusion. (A) Schematic diagram of the original experiment. Detectors (gray circles) are placed on the chest wall. Radiolabeled CO2, used as a tracer gas, is inhaled and time–activity curves constructed during a breath hold. The CO2, a soluble and perfusion-limited gas, is cleared proportional to regional blood flow. In nondependent lung, clearance of the isotope is delayed compared with dependent lung. These observations led to the development of the Zone model of pulmonary perfusion2 (B, C) that relates perfusion to the relationships between alveolar PA, pulmonary arterial Pa, and pulmonary venous, Pv, pressure. In Zone I, when PA is greater than both Pa and Pv, the capillary is collapsed and flow is zero. In Zone II the difference between PA and Pa dictates flow, whereas in Zone III lung, the difference between Pa and Pv dictates flow since both are greater than alveolar pressure. Later, this model was modified to include a fourth Zone where perfusion was reduced with decreasing height. Zone IV was originally attributed to increased interstitial pressure increasing resistance in dependent lung vessels.31
From the initial studies of West and Dollery mentioned above, work incorporating a large number of different experimental models confirms that there is a vertical gradient in perfusion from gravitationally nondependent to dependent lung that is present across multiple postures (e.g., prone/supine, right/left lateral decubitus4,32–37), imaging modalities (MRI, PET, SPECT, etc.) and species (reviewed in Glenny and Robertson1). Thus, there has been acceptance for more than 40 years that mean pulmonary blood flow with respect to the gravitational vector is influenced by the relations between Pa, PA, and Pv as predicted by the Zone model, provided the lung is well expanded and PVR is normal.30 While the effects of gravity on pulmonary blood flow distribution was initially suggested to be largest at total lung capacity (TLC) and absent at residual volume,31 this effect largely disappears when lung tissue deformation is taken into account.32 Instead, gravity affects the distribution of perfusion similarly irrespective of lung volume, except in the most nondependent portion of the lung, where it is reduced at TLC compared with other lung volumes.32 In addition, the mechanism of Zone IV effects has been questioned32 but local hypoxic pulmonary vasoconstriction (HPV) in regions of low alveolar PO238 or local vascular branching structure patterns39,40 may also play a role.
Smaller Scale Effects on the Distribution of Pulmonary Blood Flow and Measures of Spatial Heterogeneity
Despite the strengths of the simple Zone model to explain local pulmonary blood flow, marked heterogeneity of perfusion within isogravitational planes has been demonstrated by advanced measurement techniques, indicating that factors other than vertical height affecting hydrostatic gradients must also influence regional pulmonary perfusion.1 While the zones of the lung must exist due to physical laws, as detailed by Glenny and Robertson,1 it is suggested that the zones may not be vertically stacked in the lung. Rather, asymmetries in branching patterns and resistances within the vascular tree create differences in perfusion pressures, and ultimately capillary pressure. Because these heterogeneities in perfusion pressures may exist within horizontal planes, all three zones are proposed to exist within the same isogravitational plane,1 with a greater probability of one zone favored over others dependent on vertical height. Indeed Glenny and colleagues have observed substantial blood flow heterogeneity within an isogravitational plane,41,42 with greater variability often observed within a given isogravitational plane as compared with across different vertical heights of the lung.43 Thus, the assumption that variability in capillary perfusion is solely due to gravity is an over-simplification and there is now general agreement that the spatial distribution of pulmonary blood flow is determined primarily by two factors; gravity and the geometry (i.e., fractal tree) of the vascular tree.1
Perfusion of the Pulmonary Microcirculation
Because of their intimate relationship with the local alveolar pressures, blood flow at the capillary level is influenced by the local zonal conditions, and small differences in regional driving pressures can open and close pathways at the capillary level.1 Red blood cells (RBCs) pass through extensive networks of capillaries within the lung, switching between capillary branches as they reach junctions in the capillary network. The pathway of the RBCs, and the associated switching between capillaries appears somewhat random, and the perfusion of a single alveolar unit can fluctuate from no flow to partial and full recruitment within seconds.44,45 This has the effect that in addition to spatial perfusion heterogeneity, there is also temporal heterogeneity, discussed further below.
The mechanisms responsible for this pattern of recruitment and de-recruitment of capillary perfusion are not well understood, and it is possible that there are active contractile fibers within the capillary walls that change local resistances.11 However, Wagner et al recently demonstrated that RBC capillary flow switching patterns, number of perfused segments, and the fractal dimensions were not different in fresh lungs versus fixed lungs devoid of any contractile responses, and from these findings concluded that the flow switching patterns can be explained entirely by passive processes.44 This passive switching may have many physiological advantages, in that it maintains all capillaries continuously ready for emergency recruitment without the need of a feedback loop. Further, with many redundant, autonomous, and independent passive components, the passive switching system is a simple and robust design that can function reliably for prolonged periods with little need for regulation.44
Morphological studies show that pulmonary capillaries are ≤13 microns in diameter, even under conditions of high perfusion pressure.6 However, studies with agitated saline contrast echocardiography46,47 and microspheres48,49 suggests that increased cardiac output and/or pulmonary vascular pressures may recruit arteriovenous anatomic pathways in the mammalian lung. Notably, flow through these arteriovenous connections appears relatively small (i.e., <0.5% of cardiac output), with minimal impact on gas exchange.50
Temporal Heterogeneity
The pulmonary circulation is a dynamically regulated system with changes in vascular smooth muscle activity potentially affecting local perfusion.51 Not only is there spatial heterogeneity, but heterogeneity can also vary spatially over time, so-called spatial-temporal heterogeneity. Data derived from microsphere studies in animals20,52 and imaging studies in humans53–55 have been helpful, and have largely confirmed the dynamic nature of the pulmonary circulation. In mechanically ventilated dogs, perfusion has been shown to vary over a time scale of several minutes,52 but the extent is small (approximately 1/3) compared with the overall spatial heterogeneity. When measured over longer time scales, spatial-temporal heterogeneity is less.20 Imaging studies in humans measured at short time scales (seconds)53–55 confirm that the spatial-temporal heterogeneity is approximately one-third that of the overall spatial heterogeneity. In addition, in healthy subjects, spatial-temporal heterogeneity is affected by factors known to affect the pulmonary vasculature: it is increased by altered inspired oxygen, with hypoxia having a greater effect than hyperoxia,54 and increased by inhaled nitric oxide.53 Notably, spatial-temporal heterogeneity may be increased even when spatial measures of heterogeneity are unchanged54; however, this significance of this is unknown.
Active Regulation of the Distribution of Perfusion: Hypoxic Pulmonary Vasoconstriction
All circulations in the human body, including the brain, vasodilate in response to hypoxia except the pulmonary circulation, which vasoconstricts. It has been known since the middle of the 19th century in an animal model that if ventilation was interrupted, pulmonary arterial pressure increased.56 Further work established that the rise in pulmonary artery pressure occurred, whether mechanical ventilation was suspended, the trachea obstructed, or anoxic gas administered.57 However, it was not until the work of von Euler and Liljestrand58 that this phenomenon was firmly linked to the direct effect of hypoxia on the pulmonary circulation. This phenomenon is termed hypoxic pulmonary vasoconstriction (HPV). HPV has been the subject of several reviews59–64 including the exceptionally comprehensive one by Sylvester et al.59 The focus of this section is on the effect of HPV in humans and intact animal models. The reader is directed elsewhere for a discussion of the cellular and molecular mechanisms of HPV.59,63,65 von Euler and Liljestrand suggested that HPV was a mechanism to link local perfusion to the adequacy of local ventilation. Indeed, HPV is thought to be the most important active mechanism of ventilation–perfusion matching.59 HPV is initiated by reduced partial pressure of oxygen (PO2) near vascular smooth muscle, predominantly reduced alveolar PO2. Since alveolar PO2 is determined by the inspired PO2 and the local ventilation–perfusion ratio (Fig. 6), there are several ways local alveolar hypoxia may arise and stimulate HPV including local airway obstruction, alveolar filling, or ventilation–perfusion mismatch. Activation of HPV in a hypoxic region of the lung reduces local perfusion, which in turn raises the local ventilation–perfusion ratio and increases local alveolar PO2 (Fig. 6). At the same time, HPV redirects blood flow to nonhypoxic regions of the lung. Thus, the extent of regional HPV activity represents a dynamic equilibrium between PO2 stimulus and response that minimizes the impact on pulmonary gas exchange. In the case of reduced inspired PO2 causing global hypoxia, HPV activity also depends on the extent of the decrease in inspired PO2 but may affect the distribution of local flow differently depending on regional differences in alveolar PO2 or perhaps differences in local pulmonary arteriole smooth muscle response (discussed below). The site of HPV occurs primarily in the small precapillary pulmonary arterioles (30–50 μm); studies in animals largely in isolated lung models suggest that capillaries and pulmonary veins may also constrict,66–70 but the role of this in the intact lung is unclear. The precise mechanism of how low oxygen is sensed and the signal for constriction of pulmonary vascular smooth muscle is transduced has not been elucidated (see Strielkov et al71 for review).
Fig. 6.

Left: the relationship between alveolar PO2 and the local ventilation–perfusion ratio in normoxia. Right: schematic representation of restoration of oxygenation by HPV in a lung unit. (1) When ventilation and perfusion are well matched, PO2 is high (pink dot). (2) After ventilation is reduced to a lung region, in this case by partial airway obstruction, the ventilation–perfusion ratio decreases and PO2 is reduced (dark blue dot). (3) Activation of HPV reduces local perfusion, matching ventilation and acting to restore the local ventilation–perfusion ratio towards baseline. This increases the alveolar PO2 in the lung unit back to baseline (purple dot). HPV, hypoxic pulmonary vasoconstriction.
Assessing Hypoxic Pulmonary Vasoconstriction
It is difficult to fully evaluate HPV, though inferences can be made by evaluating changes in pulmonary arterial pressure and vascular resistance with hypoxia in humans72,73 or animals.74–76 However, this may be problematic particularly in patient populations. The interested reader is directed elsewhere where this is nicely discussed.77 Briefly, pulmonary blood flow is affected by airway pressure in addition to the differences between arterial and venous pressures,78,79 which may affect measurement, particularly in mechanically ventilated patients. Second, as mentioned previously, operating lung volumes affect the distribution of pulmonary blood flow and thus PVR.32,80,81 Finally, pulmonary arterial pressure/vascular resistance is also affected by cardiac function, i.e., factors extrinsic to the lung. During exposure to high altitude or hypoxia, the extent of HPV has been also assessed by acute restoration of normoxia and evaluation of the decrease in pulmonary arterial pressure and PVR. However, after several days to weeks of hypoxia, administration of oxygen has little effect,73,82,83 suggesting other mechanisms84 maintain PVR and that vascular remodeling occurs.85,86 All of these factors lend complexity to the task of evaluating HPV in humans. Alternate methods include imaging or microsphere studies during the administration of hypoxic or hyperoxic gas87–90 or by gas exchange studies evaluating the effects of altered inspired O2 on ventilation–perfusion relationships.74,91 Postmortem studies,92 studies in isolated lungs cells,93 and using pulmonary arterial strips66,67 have also provided important information.
Hypoxic Pulmonary Vasoconstriction Activation and Time Course
The reported time course of HPV is complex. Studies diverge depending on the extent of hypoxic stimulus, the experimental model, and the nature of the hypoxic exposure (i.e., regional or global hypoxia), see Sylvester et al59 for details. HPV onset is rapid, beginning within seconds of a hypoxic stimulus with the rapidity of response related to the rate of decline in PO2.94 There is evidence for a multiphasic HPV response both in vitro94 and in vivo72,95,96 characterized by an initial rapid onset of increased PVR followed by a more gradual rise. Generally, in both humans and dogs, the increase in PVR in response to inspired hypoxic gas reaches a maximum by 15 to 20 minutes.94,97,98 However, in the presence of atelectasis, the time course of redistribution of flow takes longer and reaches a maximum at approximately 60 minutes.87 HPV is sustained for hours.94,97,98 While alveolar hypoxia is the main stimulus for HPV, there is evidence that low mixed venous PO2 as well as low bronchial arterial PO299–101 can add to the vasoconstrictor response, as well as inducing vasoconstriction in and of themselves (see Sylvester et al59 and Swenson62 for review). Maximum HPV expressed as percentage change in local resistance from baseline is over 250 percent.93 HPV begins to activate at an alveolar PO2 of approximately 95 mm Hg and the response is 50% of the maximal response at a PO2 of approximately 73 mm Hg and maximal at 37 mm Hg.53,102
Hypoxic Pulmonary Vasoconstriction Response
Even in young individuals with healthy lungs, there is a small amount of ventilation–perfusion mismatch and thus some HPVactivity is expected. As assessed by the global increase in pulmonary arterial pressure and vascular resistance in response to acute hypoxia, the magnitude of the HPV response varies greatly between healthy individuals103: approximately one-quarter of healthy subjects have a minimal response to hypobaric hypoxia, whereas a minority may increase mean pulmonary arterial pressure to over 40 mm Hg.61 HPV plays a critical role in the transition from life in utero to postnatal life. Before birth, the unventilated alveoli of the fetal lung have minimal perfusion, and HPV is fully activated. After the first breath, PVR rapidly falls (reviewed in Gaoand Raj104) and pulmonary perfusion increases. It has been shown that the muscle mass of contracting elements of the pulmonary arteries decreases shortly after birth92 suggesting that HPV may be reduced as part of normal growth and development in most lowland populations. The contractile elements of the pulmonary circulation are maintained in chronic exposure to hypoxia92 and individuals born and raised at high altitude show medial hypertrophy and luminal narrowing of pulmonary arterioles.105,106
In the presence of lung disease such as chronic obstructive pulmonary disease, more regions of lung may have an alveolar PO2 that is expected to activate HPV, while in patients with regions of atelectasis or alveolar flooding, HPV is expected to be maximal. In healthy individuals,102 there is evidence that HPV corrects up to 40% of the decrease in alveolar PO2 (PAO2) that would otherwise occur in a theoretical passive system without HPV. Work in an animal model (dogs)107 suggests that activation of HPV improves arterial PO2 by approximately 15 to 20 mm Hg.
Effect of Hypoxic Pulmonary Vasoconstriction on Local Blood Flow
The absolute amount of flow to a particular region depends on both local resistance and total cardiac output. However, because the entire cardiac output passes through the lungs, blood flow in the lung is a zero-sum game: when flow is reduced in one region by HPV, then the flow is redistributed to regions of lower resistance, which will increase the fraction of the total cardiac output these areas receive. Thus, it is unsurprising that the redistribution of blood flow away from a local region of hypoxia is affected by the size of the region,76,101 and smaller hypoxic regions experience a greater reduction in flow than larger ones. For example, when the hypoxic segment is 10% of the lung volume, there is approximately 80% reduction in flow to the area. This has a negligible effect on pulmonary artery pressure.108 In contrast, in normal humans undergoing one lung ventilation, HPV has been shown to reduce the cardiac output to the hypoxic lung by up to 50%.109 In global hypoxia, such as at high altitude, the main effect of HPV is to increase pulmonary arterial pressure, without a gross redistribution of flow since the entire lung is subject to HPV. This is not strictly accurate as there are minor increases in perfusion of the apical lung regions88,110 consistent with Zone model effects associated with increased pulmonary arterial pressure.
There is evidence that HPV activity is not uniform in the mammalian lung. In pigs, for example, work using fluorescent microspheres has shown that there are anatomic clusters of the blood flow response to hypoxia111: regions of relatively high flow during hypoxia are adjacent to other high flow areas and, similarly, low flow areas are clustered near other low flow areas. In addition, MRI studies in individuals who have previously experienced high-altitude pulmonary edema, a noncardiogenic high permeability edema, that develops in otherwise healthy individuals following 24 to 72 hours exposure to altitudes above 2,400 m have shown evidence for spatially uneven HPV,112,113 that is linked to the pathophysiology of the disease.112,113 Exactly why HPV is uneven in these individuals is not established, but it does not appear to be due to a more uneven ventilation stimulus to HPV.114
Pulmonary Vascular Resistance and Distensibility
The pulmonary circulation is a high-flow and low-pressure circuit. Importantly, the low vascular pressures throughout the pulmonary circulation prevent fluid from moving into the interstitial space and allow the right ventricle to operate at minimal energy cost.115 As a result of the low-pressure system, the right ventricle is thin-walled, and has difficulty with large increases in afterload.116
Measurement of Pulmonary Vascular Resistance
The pulmonary circulation is characterized by an inflow pressure (pulmonary artery pressure, Pa), an outflow pressure (left atrial pressure, Pla), and a flow rate (, approximately equal to systemic cardiac output).116 Measurements of Pa are typically obtained at end-expiration from a pulmonary artery catheter (Fig. 7). Pulmonary artery wedge/occlusion pressure (PaOP) is used an acceptable estimate of Pla, with an average gradient of approximately 3 mm Hg between the PaOP and left-ventricular end-diastolic pressure.117 Cardiac output is typically measured via thermodilution or the direct Fick equation. A systematic review by Kovacs et al summarizing invasive pulmonary artery catheter data conducted in healthy participants across 47 studies found that mean Pa was 14.0 ± 3.3 mm Hg, while mean PaOP was 8.0 ± 2.9.118
Fig. 7.

Measurement of pulmonary vascular resistance (PVR). PVR is calculated from the inflow pressure, pulmonary artery pressure, Pa, the outflow pressure, left atrial pressure, Pla, and cardiac output, which is the flow rate. Pla is often estimated from pulmonary arterial occlusion pressure, PaOP. This is measured via a catheter that is introduced into the pulmonary artery and manipulated distally in the pulmonary circulation where a balloon is inflated to occlude the vessel and prevent filling. PaOP is measured distal to the balloon and reflects back pressure from the left atrium.
PVR serves to describe the flow-resistive properties of the pulmonary circulation115 and is calculated by the difference between mean Pa and PaOP divided by 115:
| Eq. 1 |
Kovacs et al found that mean resting PVR in healthy supine adults is approximately 0.76 ± 0.29 Wood Units (WU) in adults <24 years, 0.86 ± 0.35 WU in adults 24 to 50, 1.08 ± 0.19 WU in adults 51 to 69, and 1.13 ± 0.49 WU in those over 70 years.118
Sometimes Paw cannot be obtained, and a total PVR (TPVR) is calculated as115:
| Eq. 2 |
Importantly, as PaOP may be elevated in many conditions, TPVR is larger than PVR and this difference can be flow-dependent.115 Therefore, it is not advisable to use TPVR to characterize the flow-resistive properties of the pulmonary circulation.115 When right heart catheterization is not available, pulmonary artery systolic pressure can be estimated with reasonable accuracy using Doppler echocardiography of the maximum velocity of the tricuspid regurgitant jet and echo-derived estimates of right atrial pressure.119 Ultra-sound can also been used to estimate resting left atrial pressure,120 which combined with Doppler estimates of pulmonary artery systolic pressure allows for evaluation of PVR.
The longitudinal distribution of resistances in the pulmonary circulation has been estimated to be 60% precapillary and 40% postcapillary,121 and micropuncture studies have shown that pulmonary capillary pressure is approximately halfway between arterial and venous pressures.122 As outlined by Naeije,116 according to the Hagen–Poiseuille law, resistance (R) is equal to:
| Eq. 3 |
where l = length, η = viscosity, π = pi, r = radius. That radius is to the fourth power highlights that PVR is very sensitive to changes in vessel caliber.116 Reeves and Taylor123 illustrated that approximately 80% of the variance in Pa is explained by PaOP, indicating that an increase in Pla/PaOP is transmitted upstream to Pa. Chronic elevations in Pla/PaOP can lead to vascular remodeling and an increase in PVR and Pa.124 Clinicians often prefer to examine the transpulmonary pressure gradient (Pa – PaOP) to help distinguish between a passive increase in Pa brought on by an increase in PaOP versus an increase in Pa from pulmonary vascular disease.
Pulmonary Vascular Distensibility
While the pulmonary circulation has limited vasodilatory response, there is evidence of vascular distensibility across the pulmonary vasculature in response to an increase in transmural pressure. Vascular distention, in addition to recruitment, moderates pressure increases and thus helps to minimize right ventricular afterload. The distensibility of the pulmonary vessels can be defined by a coefficient α calculated as percentage change in diameter per mm Hg of pressure using a mathematical model of the pulmonary circulation.125–127 Practically, for an individual, the coefficient can be determined using Pa, PaOP, PVR, and data to solve for α (see Reeves et al126 and Lalande et al127 for further detail). The distensibility of pulmonary resistive vessels is approximately 2% of diameter change per millimeter of mercury of distending pressure over a wide range of vascular segments and species.128 Similarly, Reeves et al calculated the distensibility coefficient in healthy participants at rest and during exercise in normoxia to be 2 ± 0.2%/mm Hg.126 The distensibility coefficient appears to be greater in women,129 although PVR does not appear to be different between men and women.118 It is unclear whether distensibility is altered with pregnancy; however, PVR may decrease in pregnancy, likely because of reduced blood viscosity and increased cardiac output resulting in capillary recruitment.130,131 Pulmonary vascular distensibility decreases with aging126,129 and decreases with chronic, but not acute hypoxia.116
Functional Measurements of Recruitment/Distention
Studies examining the intact pulmonary microcirculation have typically used fixed-diameter (approximately 15 μm) microspheres to examine perfusion25,42,132–134; however, this does not allow for the study of capillary recruitment/distention in the human. Radiolabeled macroaggregated albumin has been used in humans135–138; however, the size of these particles can be inconsistent, making accurate evaluation of perfusion difficult. Diffusing capacity for carbon monoxide (DLCO) can be partitioned into its components; capillary blood volume (Vc) and membrane diffusing capacity (Dm),139 and DLCO, Vc, and Dm can be used as a functional evaluation of capillary recruitment/distention. Diffusing capacity of nitric oxide (DLNO) can also be used in combination with DLCO to determine Vc and Dm.140 Membrane diffusing capacity reflects the available alveolar capillary surface area for gas exchange, and is increased by unfolding and distention of alveolar septae during lung inflation, and recruitment of capillaries associated with previously un-perfused alveoli.140 Vc increases as the number of perfused alveolar capillaries increases,140 and capillaries become further distended with increased perfusion pressure. As gas exchange can only occur within a perfused alveolar/capillary unit, Dm is thought to describe capillary recruitment, while Vc reflects both recruitment and distention. First-pass pulmonary circulatory metabolism of [3H] benzoyl-Phe-Ala-Pro can also be used to calculate functional capillary surface area.141,142 Pulmonary capillary recruitment and distention can be estimated from the surface area data in combination with pulmonary blood flow data (i.e., cardiac output).141,142 Similar to DLCO, this technique provides a functional evaluation of pulmonary capillary recruitment/distention, and both of these techniques have been used recently to better understand recruitment/distention in various conditions.
Physiological Factors Affecting the Pulmonary Circulation
The previous sections have discussed the structure of the pulmonary circulation, determinants of the distribution of pulmonary blood flow and heterogeneity, PVR, and factors affecting recruitment and distension of the pulmonary vasculature. How these are affected under a variety of physiological circumstances is briefly discussed. In addition to the issues discussed below, diving and high-altitude exposure also result in changes in pulmonary circulation structure and function. These effects are discussed in more detail in other sections of this journal compilation.
Healthy Aging
Normal aging has several effects on the lung and pulmonary circulation. For example, it is well known that even in healthy individuals, pulmonary gas exchange efficiency worsens with age as a result of increasing ventilation–perfusion mismatch,143 presumably because of an overall decline in lung function (see Janssens144 for review) and increased ventilation heterogeneity.145–147 In the pulmonary circulation, aging is associated with a reduction in pulmonary vascular distensibility.126,129 Correspondingly, PVR, pulmonary arterial pressure, and the Pa/cardiac output index are elevated at rest and during exercise with age.116,118,148 Elevated echo-derived pulmonary arterial systolic pressure is associated with mortality, and while Pa pressure may be influenced by left ventricular function and downstream pressure (i.e., PaOP, discussed previously), these findings suggest that the age-associated changes in pulmonary resistance may have clinical significance.148 Functionally, despite an increase in pulmonary arterial pressure with aging, DLCO, VC, and Dm at rest are reduced with age.149–152 Similarly, CT data demonstrate that pulmonary blood volume is also reduced with age, with an approximate linear decrement of 50 mL per 10 years of age.153 The magnitude of the increase in DLCO when moving to the supine position is also blunted in elderly participants,154,155 suggesting that aging-induced impairments in the pulmonary vasculature cannot be normalized with increasing perfusion pressure, consistent with decreased distensibility. DLCO, DLNO, VC, and Dm are also reduced during exercise at a given cardiac output in older participants.149,156 However, elderly participants demonstrate a similar expansion of the pulmonary capillary network with exercise (i.e., similar increase in DLCO, Dm, and Vc), suggesting that the changes in the pulmonary circulation that occur with healthy aging are insufficient to affect pulmonary vascular expansion and the recruitment of effective alveolar–capillary surface area during exercise.149 The underlying mechanism(s) for the age-associated changes in pulmonary vascular function are unclear, but similar to the systemic circulation, may be related to arteriole remodeling or an increase in smooth muscle cell tone.115,148
There is some evidence of changes in the large-scale gravitational effects on perfusion with aging.157 In male subjects aged 65 to 75 years, there was a relative increase in blood flow to lung apices in the upright posture compared with younger men (i.e., a smaller gravitational gradient). This may be explained in part by increased pulmonary vascular pressures,158 leading to greater capillary recruitment (i.e., Zone model effects),159,160 but this is not established. Also, since several subjects in this study had significant smoking histories, the significance of these findings is uncertain. Fractal dimension has not been shown to change with age in healthy nonsmokers, suggesting that vascular branching structure is unchanged,161 but perfusion heterogeneity as measured by the relative dispersion increased significantly with increasing age.161 The magnitude of the change (approximately 5% per decade of age) is similar to changes in ventilation–perfusion heterogeneity with age.143 The reasons for increasing heterogeneity with age are unknown but may relate to nonuniform alveolar size changes162 leading to an apparent heterogeneity in perfusion and/or an intrinsic alteration in the pulmonary vasculature consistent with changes in DLCO and pulmonary capillary blood volume.149–152
Alternatively, increased sperfusion heterogeneity may represent increased HPV activity in response to regional alveolar hypoxia induced by the well-documented increase in heterogeneity of ventilation with aging.147,157 While there is a great deal of research on HPV (see Sylvester et al59 for review), it is important to recognize that it has largely been conducted in young subjects (both human and animal). The extent to which it changes with aging is unknown, largely because it has not been evaluated, in part due to concerns about making older individuals hypoxic, and the role of HPV optimizing ventilation–perfusion relationships in older subjects is presently unclear.
Exercise
Exercise represents a significant stress on the pulmonary circulation, as cardiac output can increase up to 5- to 7-fold with maximal exercise in trained individuals, and the pulmonary circulation must take the entire cardiac output while keeping the lungs dry and minimizing the increase in right ventricular stroke work.115 The exercise-induced increases in Pa pressure facilitate capillary recruitment and distention, and as a result PVR decreases with incremental exercise.46,123,163,164
With exercise, DLCO, Vc, and Dm responses to exercise demonstrate a continuous rise up to peak exercise, with no apparent plateau in any component regardless of age or sex.149,165–167 Thesefindings indicatethatcapillary recruitment and distention continue to increase up to maximal exercise. Interestingly, endurance-trained athletes, who have a greater peak oxygen consumption, and thus a greater O2 diffusion requirement demonstrate greater DLCO at peak exercise as compared with less-trained individuals secondary to greater Dm.165 The larger Dm at peak exercise in endurance-trained individuals would suggest that athletes have enhanced capillary recruitment; however, the underlying physiology remains to be elucidated.
Using [3H]benzoyl-Phe-Ala-Pro, Langleben et al provided evidence that reductions in PVR during supine exercise in healthy humans were explained by both capillary recruitment and distention, with recruitment being predominant at moderate increases in flow and distention more likely with larger increases in flow.141 In a follow-up study, Langleben et al examined potential species differences, and found that rabbits, dogs, and exercising humans all showed similar recruitment/distention patterns in response to increased blood flow, such that capillary recruitment is the dominant responses at low flow rates (up to approximately 2.5 to 3.7 times resting).168 Thereafter, further rises in pulmonary blood flow were determined to be accommodated primarily by capillary distention.135
The [3H]benzoyl-Phe-Ala-Pro findings that capillary distention is the primary response at higher flow rates141 is divergent from the DLCO data which indicate that both recruitment and distention occur up to peak exercise.165,166 Although both approaches are based on measurement of functional area for gas exchange, differences may be explained by variations in experimental approach. The work to date using [3H]benzoyl-Phe-Ala-Pro has all been done while supine, whereas the DLCO data are typically collected during upright exercise. Supine posture reduces the height of the vertical hydrostatic column while increasing perfusion pressure. This would have the likely effect of increasing baseline capillary recruitment and thus altering the recruitment/distention response to incremental exercise.
As described by La Gerche et al, high-intensity exercise can present a significant hemodynamic challenge in which the right-sided heart chambers are exposed to a disproportionate increase in cardiac afterload and wall stress.169 Mean left atrial pressure/PaOP increases with exercise,46,163,164 and as noted previously, approximately 80% of the variance in Pa is explained by PaOP.123 This increase in downstream PaOP with exercise is transmitted through the pulmonary circulation, resulting in further elevation in Pa. As a consequence, relative to the left ventricle, increases in load are greater for the right ventricle during exercise and the contractile force may be insufficient to generate the increases in cardiac output required during intense exercise.169 As highlighted by La Gerche et al, cardiac output is only as good as your worst ventricle, and therefore the coupling of the pulmonary circulation and the right ventricle may represent a limitation to maximal exercise. Consistent with this hypothesis, pulmonary arteriolar distensibility (α) is correlated with maximal oxygen uptake,127 while resting and exercise DLCO, DLNO, Vc, and Dm (which reflect capillary recruitment and distention) are associated with greater exercise tolerance in health and disease.127,165,166,170,171
It is worth mentioning that recruitment and distension cannot increase in an unlimited fashion and with maximal recruitment and distension in combination with the elevation in Pa and PaOP, pulmonary capillary pressure increases. Ultimately, high pulmonary capillary pressures may damage the thin blood–gas barrier that is a requirement to diffuse respiratory gases172,173 (Fig. 8). Stress failure of pulmonary capillaries is reported in horses which develop extremely high pulmonary vascular pressures during exercise.174 There is also evidence that in some circumstances, the human pulmonary circulation may also develop breaks in capillary endothelium/alveolar epithelium sufficient to result in RBCs entering the airways.172,173 This stress failure is more likely with maximal exercise173,175 because of increased capillary pressure and lung stretch, which amplifies the mechanical forces on the lung. Stress failure may also be important in lung injury with mechanical ventilation with high airway pressures (reviewed in West176) and in the development of high-altitude pulmonary edema.112
Fig. 8.

Three forces acting on blood–gas barrier. Circumferential tension (Ttmp) is given by capillary transmural pressure X radius of curvature (r). In this example, alveolar pressure (Palv) is atmospheric so that capillary transmural pressure is equal to capillary hydrostatic pressure (Pcap). Surface tension of alveolar lining layer (Tst) exerts an inward-acting force to support the capillary. Longitudinal tension in alveolar wall elements associated with inflation of lung (Tel) is presumably transmitted mainly by collagen fibers on the thick side of the capillary but may affect wall tension on the thin side, especially at high lung volumes. (Reproduced with permission from West et al172.)
The picture of pulmonary blood flow heterogeneity with exercise is complex and depends on exercise intensity, species, and posture among other possible factors. Generally, exercise causes redistribution of flow against the gravitational gradient: with upright exercise in humans blood flow increases in the apical (nondependent) regions of the lung,177–179 although the gravitational gradient in blood flow is not completely attenuated. These changes in the large-scale distribution of pulmonary blood flow may be due to local reactivity of the pulmonary vessels to exercise, local vascular structure creating nonuniform resistances in response to exercise, or Zone model-type hydrostatic behavior. In most quadruped animals, exercise redistributes blood flow to the most gravitationally nondependent lung, the dorsal caudal region.180–182
In humans undergoing mild supine exercise, pulmonary blood flow was redistributed to the nondependent lung,22 and perfusion heterogeneity was reduced22,183(Fig. 9). The reduction in the spatial heterogeneity of pulmonary perfusion as measured by the relative dispersion22 was present even after accounting for the effect of gravity. These findings are consistent with exercise DLCO and [3H]benzoyl-Phe-Ala-Pro work detailed above and suggest that lung perfusion follows a Zone-type model to some extent with greater recruitment of blood vessels during mild exercise.
Fig. 9.

The effect of mild exercise on the distribution of pulmonary blood flow. With exercise, blood flow is redistributed to the nondependent lung (left panel) and perfusion heterogeneity as measured by the relative dispersion is reduced (middle and right) even after accounting for the effect of gravity (right panel). (Modified with permission from Hall et al22.)
Because of the difficulty in obtaining good-quality data during heavy exercise, there are few studies evaluating perfusion heterogeneity during high-intensity exercise, and a consistent pattern is unclear. In some species such as dogs184 and sheep,181 perfusion heterogeneity does not decrease with exercise. Similarly, in horses perfusion heterogeneity is unchanged during exercise and redistribution of flow is small.182 This has led to the suggestion that the primary determinant of pulmonary blood flow distribution in these animals is structural, rather than Zone model-type effects, but this has not been established. In humans, pulmonary perfusion heterogeneity is increased following heavy exercise,185,186 and is positively correlated with the extent of ventilation–perfusion mismatch.185 In addition, ventilation–perfusion mismatch occurred in a portion of the lung which was gravitationally dependent during exercise,186 consistent with the development of local interstitial edema acting to disrupt local perfusion. Importantly, because of the rapid changes in pulmonary hemodynamics immediately following exercise, data obtained following exercise may not provide an accurate representation of perfusion heterogeneity during exercise.
Posture
In comparison to the upright position, the supine posture results in a translocation of blood centrally, while also lowering the vertical distance (hydrostatic column) of the lung. Previous work in healthy participants has demonstrated that the shift from upright to supine increases resting Pa and PaOP by approximately 3 to 4 mm Hg,46 which is expected to increase the amount of Zone III conditions within the lung. Consistent with greater capillary recruitment and distention, PVR is reduced by roughly 25% in young healthy when supine,46 while DLCO is increased by 12 to 26%.154,187
The effects of postural changes on gravitational gradients in pulmonary perfusion are not fully established; some work suggests that they are smaller in the prone than in the supine posture,161,188–190 but other studies do not find major differences.35,188 The reasons are not entirely clear but may relate to whether (or how) redistribution of lung tissue is accounted for in measurements. Also, cardiac output is increased in prone compared with supine posture which may affect distribution of pulmonary blood flow.191 As measured by the relative dispersion, the supine posture does not change heterogeneity relative to prone posture161,190 in normal humans.
Positive Pressure Ventilation/Positive End-Expiratory Pressure
Alveolar pressure typically fluctuates from +1 cm H2O during normal exhalation to −1 cm H2O during inhalation; however, with positive pressure ventilation (PPV), alveolar pressure remains positive throughout the breathing cycle. Positive end-expiratory pressure (PEEP) is used to maintain alveolar patency and prevent alveolar collapse and de-recruitment; both PPV and PEEP can result in important direct and indirect effects on the pulmonary circulation.
With PPV, the intrathoracic pressure increases during inspiration causing a decrease in venous return, right ventricular output, and thus pulmonary blood flow.192 Both PPV and PEEP increase alveolar pressure, compressing the capillaries, resulting in capillary de-recruitment (i.e., a shift from Zone II to Zone I, and Zone III to Zone II), and increased alveolar deadspace.192,193 Any capillary de-recruitment is also expected to raise PVR. With a shift from Zone III to Zone II conditions, perfusion/cardiac output may be further reduced with PPV and PEEP, because driving pressure in affected regions changes from Pa – PV determining flow to Pa – PA. Importantly, both PPV and PEEP typically increase lung volumes, which may further increase PVR194 as small blood vessels are axially elongated reducing their diameter and negatively impacting cardiac output.
In a supine animal model, PEEP increases the dorsal-to-ventral gradient in perfusion.195 This is consistent with data in heathy supine mechanically ventilated human subjects, where PEEP also causes large-scale redistribution of pulmonary blood flow to gravitationally dependent (dorsal) lung, accompanied by corresponding changes in ventilation. These responses are different in the prone posture, where there were large changes in perfusion to the dependent ventral lung with mechanical ventilation, which were not matched by ventilation changes.196
Conclusion
The distribution of pulmonary blood flow is determined by several factors, including structural effects of vascular branching, gravity, as well as finer scale factors related to local control. HPV is a major vascular regulatory mechanism that constricts the pulmonary arterioles to divert blood toward oxygenated regions to optimize ventilation–perfusion matching. Factors such as aging, exercise, posture, and PPV alter vascular recruitment, distension, and, as a consequence, the distribution of pulmonary blood flow.
Footnotes
Conflict of Interest
None declared.
References
- 1.Glenny RW, Robertson HT. Determinants of pulmonary blood flow distribution. Compr Physiol 2011;1(01):39–59 [DOI] [PubMed] [Google Scholar]
- 2.West JB, Dollery CT. Distribution of blood flow and ventilation-perfusion ratio in the lung, measured with radioactive carbon dioxide. J Appl Physiol 1960;15(03):405–410 [DOI] [PubMed] [Google Scholar]
- 3.West JB. Distribution of pulmonary blood flow. Am J Respir Crit Care Med 1999;160(06):1802–1803 [DOI] [PubMed] [Google Scholar]
- 4.Hopkins SR, Henderson AC, Levin DL, et al. Vertical gradients in regional lung density and perfusion in the supine human lung: the Slinky effect. J Appl Physiol 2007;103(01):240–248 [DOI] [PMC free article] [PubMed] [Google Scholar]
- 5.Glazier JB, Hughes JM, Maloney JE, West JB. Vertical gradient of alveolar size in lungs of dogs frozen intact. J Appl Physiol 1967;23(05):694–705 [DOI] [PubMed] [Google Scholar]
- 6.Glazier JB, Hughes JM, Maloney JE, West JB. Measurements of capillary dimensions and blood volume in rapidly frozen lungs. J Appl Physiol 1969;26(01):65–76 [DOI] [PubMed] [Google Scholar]
- 7.Tawhai MH, Nash MP, Lin CL, Hoffman EA. Supine and prone differences in regional lung density and pleural pressure gradients in the human lung with constant shape. J Appl Physiol 2009;107(03):912–920 [DOI] [PMC free article] [PubMed] [Google Scholar]
- 8.Fung YC, Sobin SS. Theory of sheet flow in lung alveoli. J Appl Physiol 1969;26(04):472–488 [DOI] [PubMed] [Google Scholar]
- 9.Fung YC, Sobin SS. Pulmonary alveolar blood flow. Circ Res 1972; 30(04):470–490 [DOI] [PubMed] [Google Scholar]
- 10.Mandelbrot BB. The Fractal Geometry of Nature. San Francisco, CA: W.H. Freeman; 1983 [Google Scholar]
- 11.Glenny R, Robertson HT. Distribution of perfusion. Compr Physiol 2011;1(01):245–262 [DOI] [PubMed] [Google Scholar]
- 12.Glenny RW, Robertson HT. Spatial distribution of ventilation and perfusion: mechanisms and regulation. Compr Physiol 2011;1(01):375–395 [DOI] [PubMed] [Google Scholar]
- 13.Lefèvre J Teleonomical optimization of a fractal model of the pulmonary arterial bed. J Theor Biol 1983;102(02):225–248 [DOI] [PubMed] [Google Scholar]
- 14.West GB, Brown JH, Enquist BJ. The fourth dimension of life: fractal geometry and allometric scaling of organisms. Science 1999;284(5420):1677–1679 [DOI] [PubMed] [Google Scholar]
- 15.Ochs M, Weibel ER. Functional design of the human lung for gas exchange. In: Grippi MA, Elias JA, Fishman JA, et al. , eds. Fishman’s Pulmonary Diseases and Disorders, 5th ed. New York, NY: McGraw-Hill Education; 2015 [Google Scholar]
- 16.Galvin I, Drummond GB, Nirmalan M. Distribution of blood flow and ventilation in the lung: gravity is not the only factor. Br J Anaesth 2007;98(04):420–428 [DOI] [PubMed] [Google Scholar]
- 17.Altemeier WA, McKinney S, Glenny RW. Fractal nature of regional ventilation distribution. J Appl Physiol 2000;88(05): 1551–1557 [DOI] [PubMed] [Google Scholar]
- 18.Hopkins SR. Ventilation/perfusion relationships and gas exchange: measurement approaches. Compr Physiol 2020;10(03):1155–1205 [DOI] [PMC free article] [PubMed] [Google Scholar]
- 19.Hsia CCW, Bates JHT, Driehuys B, et al. Quantitative imaging metrics for the assessment of pulmonary pathophysiology: an official American Thoracic Society and Fleischner Society joint workshop report. Ann Am Thorac Soc 2023;20(02):161–195 [DOI] [PMC free article] [PubMed] [Google Scholar]
- 20.Glenny RW, McKinney S, Robertson HT. Spatial pattern of pulmonary blood flow distribution is stable over days. J Appl Physiol 1997;82(03):902–907 [DOI] [PubMed] [Google Scholar]
- 21.Glenny RW. Heterogeneity in the lung: concepts and measures. In: Hlastala MP, Robertson HT, eds. Complexity in Structure and Function in the Lung. New York, NY: Marcel Dekker Inc.; 1998: 571–609 [Google Scholar]
- 22.Hall ET, Sá RC, Holverda S, et al. The effect of supine exercise on the distribution of regional pulmonary blood flow measured using proton MRI. J Appl Physiol 2014;116(04):451–461 [DOI] [PMC free article] [PubMed] [Google Scholar]
- 23.Glenny RW, Robertson HT. Fractal modeling of pulmonary blood flow heterogeneity. J Appl Physiol 1991;70(03):1024–1030 [DOI] [PubMed] [Google Scholar]
- 24.Glenny RW, Robertson HT. Fractal properties of pulmonary blood flow: characterization of spatial heterogeneity. J Appl Physiol 1990;69(02):532–545 [DOI] [PubMed] [Google Scholar]
- 25.Glenny RW, Bernard SL, Robertson HT. Pulmonary blood flow remains fractal down to the level of gas exchange. J Appl Physiol 2000;89(02):742–748 [DOI] [PubMed] [Google Scholar]
- 26.Sinclair SE, McKinney S, Glenny RW, Bernard SL, Hlastala MP. Exercise alters fractal dimension and spatial correlation of pulmonary blood flow in the horse. J Appl Physiol 2000;88(06):2269–2278 [DOI] [PubMed] [Google Scholar]
- 27.Caruthers SD, Harris TR. Effects of pulmonary blood flow on the fractal nature of flow heterogeneity in sheep lungs. J Appl Physiol 1994;77(03):1474–1479 [DOI] [PubMed] [Google Scholar]
- 28.Levin DL, Buxton RB, Spiess JP, Arai T, Balouch J, Hopkins SR. Effects of age on pulmonary perfusion heterogeneity measured by magnetic resonance imaging. J Appl Physiol 2007;102(05): 2064–2070 [DOI] [PubMed] [Google Scholar]
- 29.Banister J, Torrance RW. The effects of the tracheal pressure upon flow: pressure relations in the vascular bed of isolated lungs. Q J Exp Physiol Cogn Med Sci 1960;45(04):352–367 [DOI] [PubMed] [Google Scholar]
- 30.West JB, Dollery CT, Naimark A. Distribution of blood flow in isolated lung; relation to vascular and alveolar pressures. J Appl Physiol 1964;19:713–724 [DOI] [PubMed] [Google Scholar]
- 31.Hughes JM, Glazier JB, Maloney JE, West JB. Effect of lung volume on the distribution of pulmonary blood flow in man. Respir Physiol 1968;4(01):58–72 [DOI] [PubMed] [Google Scholar]
- 32.Hopkins SR, Arai TJ, Henderson AC, Levin DL, Buxton RB, Kim Prisk G. Lung volume does not alter the distribution of pulmonary perfusion in dependent lung in supine humans. J Physiol 2010;588(Pt 23):4759–4768 [DOI] [PMC free article] [PubMed] [Google Scholar]
- 33.Amis TC, Jones HA, Hughes JM. Effect of posture on inter-regional distribution of pulmonary perfusion and VA/Q ratios in man. Respir Physiol 1984;56(02):169–182 [DOI] [PubMed] [Google Scholar]
- 34.Brudin LH, Rhodes CG, Valind SO, Jones T, Hughes JM. Interrelationships between regional blood flow, blood volume, and ventilation in supine humans. J Appl Physiol 1994;76(03): 1205–1210 [DOI] [PubMed] [Google Scholar]
- 35.Jones AT, Hansell DM, Evans TW. Pulmonary perfusion in supine and prone positions: an electron-beam computed tomography study. J Appl Physiol 2001;90(04):1342–1348 [DOI] [PubMed] [Google Scholar]
- 36.Orphanidou D, Hughes JM, Myers MJ, Al-Suhali AR, Henderson B. Tomography of regional ventilation and perfusion using krypton 81m in normal subjects and asthmatic patients. Thorax 1986;41(07):542–551 [DOI] [PMC free article] [PubMed] [Google Scholar]
- 37.Kaneko K, Milic-Emili J, Dolovich MB, Dawson A, Bates DV. Regional distribution of ventilation and perfusion as a function of body position. J Appl Physiol 1966;21(03):767–777 [DOI] [PubMed] [Google Scholar]
- 38.Petersson J, Rohdin M, Sánchez-Crespo A, et al. Paradoxical redistribution of pulmonary blood flow in prone and supine humans exposed to hypergravity. J Appl Physiol 2006;100(01):240–248 [DOI] [PubMed] [Google Scholar]
- 39.Burrowes KS, Hunter PJ, Tawhai MH. Evaluation of the effect of postural and gravitational variations on the distribution of pulmonary blood flow via an image-based computational model. Conf Proc IEEE Eng Med Biol Soc 2005;2005:6138–6140 [DOI] [PubMed] [Google Scholar]
- 40.Burrowes KS, Tawhai MH. Computational predictions of pulmonary blood flow gradients: gravity versus structure. Respir Physiol Neurobiol 2006;154(03):515–523 [DOI] [PubMed] [Google Scholar]
- 41.Glenny RW. Spatial correlation of regional pulmonary perfusion. J Appl Physiol 1992;72(06):2378–2386 [DOI] [PubMed] [Google Scholar]
- 42.Glenny RW, Bernard S, Robertson HT, Hlastala MP. Gravity is an important but secondary determinant of regional pulmonary blood flow in upright primates. J Appl Physiol 1999;86(02):623–632 [DOI] [PubMed] [Google Scholar]
- 43.Hlastala MP, Bernard SL, Erickson HH, et al. Pulmonary blood flow distribution in standing horses is not dominated by gravity. J Appl Physiol 1996;81(03):1051–1061 [DOI] [PubMed] [Google Scholar]
- 44.Wagner WW Jr, Jaryszak EM, Peterson AJ, et al. A perpetual switching system in pulmonary capillaries. J Appl Physiol 2019; 126(02):494–501 [DOI] [PMC free article] [PubMed] [Google Scholar]
- 45.Wearn JT, Ernstene AC, Bromer AW, Barr JS, German WJ, Zschiesche LJ. The normal behavior of the pulmonary blood vessels with observations on the intermittence of the flow of blood in the arterioles and capillaries. Am J Physiol 1934;109(02):236–256 [Google Scholar]
- 46.Stickland MK, Welsh RC, Haykowsky MJ, et al. Intra-pulmonary shunt and pulmonary gas exchange during exercise in humans. J Physiol 2004;561(Pt 1):321–329 [DOI] [PMC free article] [PubMed] [Google Scholar]
- 47.Bryan TL, van Diepen S, Bhutani M, Shanks M, Welsh RC, Stickland MK. The effects of dobutamine and dopamine on intra-pulmonary shunt and gas exchange in healthy humans. J Appl Physiol 2012;113(04):541–548 [DOI] [PMC free article] [PubMed] [Google Scholar]
- 48.Whyte MK, Peters AM, Hughes JM, et al. Quantification of right to left shunt at rest and during exercise in patients with pulmonary arteriovenous malformations. Thorax 1992;47(10):790–796 [DOI] [PMC free article] [PubMed] [Google Scholar]
- 49.Stickland MK, Lovering AT, Eldridge MW. Exercise-induced arteriovenous intrapulmonary shunting in dogs. Am J Respir Crit Care Med 2007;176(03):300–305 [DOI] [PMC free article] [PubMed] [Google Scholar]
- 50.Stickland MK, Tedjasaputra V, Seaman C, et al. Intra-pulmonary arteriovenous anastomoses and pulmonary gas exchange: evaluation by microspheres, contrast echocardiography and inert gas elimination. J Physiol 2019;597(22):5365–5384 [DOI] [PMC free article] [PubMed] [Google Scholar]
- 51.Aaronson PI, Robertson TP, Knock GA, et al. Hypoxic pulmonary vasoconstriction: mechanisms and controversies. J Physiol 2006; 570(Pt 1):53–58 [DOI] [PMC free article] [PubMed] [Google Scholar]
- 52.Glenny RW, Polissar NL, McKinney S, Robertson HT. Temporal heterogeneity of regional pulmonary perfusion is spatially clustered. J Appl Physiol 1995;79(03):986–1001 [DOI] [PubMed] [Google Scholar]
- 53.Asadi AK, Sá RC, Kim NH, et al. Inhaled nitric oxide alters the distribution of blood flow in the healthy human lung, suggesting active hypoxic pulmonary vasoconstriction in normoxia. J Appl Physiol 2015;118(03):331–343 [DOI] [PMC free article] [PubMed] [Google Scholar]
- 54.Asadi AK, Cronin MV, Sá RC, et al. Spatial-temporal dynamics of pulmonary blood flow in the healthy human lung in response to altered FI(O2). J Appl Physiol 2013;114(01):107–118 [DOI] [PMC free article] [PubMed] [Google Scholar]
- 55.Asadi AK, Sá RC, Arai TJ, et al. Regional pulmonary perfusion patterns in humans are not significantly altered by inspiratory hypercapnia. J Appl Physiol 2019;127(02):365–375 [DOI] [PMC free article] [PubMed] [Google Scholar]
- 56.Beutner A. Ueber die Strom- und Druckkräfte des Blutes in der Arteria pulmonalis. Z rationelle Med 1852;2:97–138 [Google Scholar]
- 57.Plumier L. La circulation pulmonaire chez le chien. Arch Int Physiol 1904;1:176–213 [Google Scholar]
- 58.Euler Uv, Liljestrand G. Observations on the pulmonary arterial blood pressure in the cat. Acta Physiol Scand 1946;12(04):301–320 [Google Scholar]
- 59.Sylvester JT, Shimoda LA, Aaronson PI, Ward JP. Hypoxic pulmonary vasoconstriction. Physiol Rev 2012;92(01):367–520 [DOI] [PMC free article] [PubMed] [Google Scholar]
- 60.Naeije R, Brimioulle S. Physiology in medicine: importance of hypoxic pulmonary vasoconstriction in maintaining arterial oxygenation during acute respiratory failure. Crit Care 2001;5(02):67–71 [DOI] [PMC free article] [PubMed] [Google Scholar]
- 61.Bärtsch P, Gibbs JS. Effect of altitude on the heart and the lungs. Circulation 2007;116(19):2191–2202 [DOI] [PubMed] [Google Scholar]
- 62.Swenson ER. Hypoxic pulmonary vasoconstriction. High Alt Med Biol 2013;14(02):101–110 [DOI] [PubMed] [Google Scholar]
- 63.Dunham-Snary KJ, Wu D, Sykes EA, et al. Hypoxic pulmonary vasoconstriction: from molecular mechanisms to medicine. Chest 2017;151(01):181–192 [DOI] [PMC free article] [PubMed] [Google Scholar]
- 64.Sommer N, Strielkov I, Pak O, Weissmann N. Oxygen sensing and signal transduction in hypoxic pulmonary vasoconstriction. Eur Respir J 2016;47(01):288–303 [DOI] [PubMed] [Google Scholar]
- 65.Grimmer B, Kuebler WM. The endothelium in hypoxic pulmonary vasoconstriction. J Appl Physiol 2017;123(06):1635–1646 [DOI] [PubMed] [Google Scholar]
- 66.Dawson CA, Grimm DJ, Linehan JH. Influence of hypoxia on the longitudinal distribution of pulmonary vascular resistance. J Appl Physiol 1978;44(04):493–498 [DOI] [PubMed] [Google Scholar]
- 67.Dawson CA, Grimm DJ, Linehan JH. Lung inflation and longitudinal distribution of pulmonary vascular resistance during hypoxia. J Appl Physiol 1979;47(03):532–536 [DOI] [PubMed] [Google Scholar]
- 68.Groh J, Kuhnle GE, Kuebler WM, Goetz AE. An experimental model for simultaneous quantitative analysis of pulmonary micro- and macrocirculation during unilateral hypoxia in vivo. Res Exp Med (Berl) 1992;192(06):431–441 [DOI] [PubMed] [Google Scholar]
- 69.Hakim TS, Michel RP, Minami H, Chang HK. Site of pulmonary hypoxic vasoconstriction studied with arterial and venous occlusion. J Appl Physiol 1983;54(05):1298–1302 [DOI] [PubMed] [Google Scholar]
- 70.Madden JA, Dawson CA, Harder DR. Hypoxia-induced activation in small isolated pulmonary arteries from the cat. J Appl Physiol 1985;59(01):113–118 [DOI] [PubMed] [Google Scholar]
- 71.Strielkov I, Pak O, Sommer N, Weissmann N. Recent advances in oxygen sensing and signal transduction in hypoxic pulmonary vasoconstriction. J Appl Physiol 2017;123(06):1647–1656 [DOI] [PubMed] [Google Scholar]
- 72.Dorrington KL, Clar C, Young JD, Jonas M, Tansley JG, Robbins PA. Time course of the human pulmonary vascular response to 8 hours of isocapnic hypoxia. Am J Physiol 1997;273(3, Pt 2):H1126–H1134 [DOI] [PubMed] [Google Scholar]
- 73.Groves BM, Reeves JT, Sutton JR, et al. Operation Everest II: elevated high-altitude pulmonary resistance unresponsive to oxygen. J Appl Physiol 1987;63(02):521–530 [DOI] [PubMed] [Google Scholar]
- 74.Domino KB, Hlastala MP, Eisenstein BL, Cheney FW. Effect of regional alveolar hypoxia on gas exchange in dogs. J Appl Physiol 1989;67(02):730–735 [DOI] [PubMed] [Google Scholar]
- 75.Hambraeus-Jonzon K, Bindslev L, Frostell C, Hedenstierna G. Individual lung blood flow during unilateral hypoxia: effects of inhaled nitric oxide. Eur Respir J 1998;11(03):565–570 [PubMed] [Google Scholar]
- 76.Marshall BE, Marshall C, Benumof J, Saidman LJ. Hypoxic pulmonary vasoconstriction in dogs: effects of lung segment size and oxygen tension. J Appl Physiol 1981;51(06):1543–1551 [DOI] [PubMed] [Google Scholar]
- 77.Ryan D, Frohlich S, McLoughlin P. Pulmonary vascular dysfunction in ARDS. Ann Intensive Care 2014;4:28. [DOI] [PMC free article] [PubMed] [Google Scholar]
- 78.West JB. Regional differences in the lung. Chest 1978;74(04):426–437 [DOI] [PubMed] [Google Scholar]
- 79.West JB, Luks AM. West’s Respiratory Physiology. Philadelphia, PA: Lippincott Williams & Wilkins; 2020 [Google Scholar]
- 80.Whittenberger JL, McGREGOR M, Berglund E, Borst HG. Influence of state of inflation of the lung on pulmonary vascular resistance. J Appl Physiol 1960;15(05):878–882 [DOI] [PubMed] [Google Scholar]
- 81.Hakim TS, Michel RP, Chang HK. Effect of lung inflation on pulmonary vascular resistance by arterial and venous occlusion. J Appl Physiol 1982;53(05):1110–1115 [DOI] [PubMed] [Google Scholar]
- 82.Dubowitz G, Peacock AJ. Pulmonary artery pressure in healthy subjects at 4250 m measured by Doppler echocardiography. Wilderness Environ Med 2007;18(04):305–311 [DOI] [PubMed] [Google Scholar]
- 83.Canepa A, Chavez R, Hurtado A, Rotta A, Velasquez T. Pulmonary circulation at sea level and at high altitudes. J Appl Physiol 1956; 9(03):328–336 [DOI] [PubMed] [Google Scholar]
- 84.Voelkel NF, Mizuno S, Bogaard HJ. The role of hypoxia in pulmonary vascular diseases: a perspective. Am J Physiol Lung Cell Mol Physiol 2013;304(07):L457–L465 [DOI] [PubMed] [Google Scholar]
- 85.Grover RF. The fascination of the hypoxic lung. Anesthesiology 1985;63(06):580–582 [DOI] [PubMed] [Google Scholar]
- 86.Sommer N, Dietrich A, Schermuly RT, et al. Regulation of hypoxic pulmonary vasoconstriction: basic mechanisms. Eur Respir J 2008;32(06):1639–1651 [DOI] [PubMed] [Google Scholar]
- 87.Glasser SA, Domino KB, Lindgren L, Parcella P, Marshall C, Marshall BE. Pulmonary blood pressure and flow during atelectasis in the dog. Anesthesiology 1983;58(03):225–231 [DOI] [PubMed] [Google Scholar]
- 88.Dawson A. Regional pulmonary blood flow in sitting and supine man during and after acute hypoxia. J Clin Invest 1969;48(02):301–310 [DOI] [PMC free article] [PubMed] [Google Scholar]
- 89.Arai TJ, Henderson AC, Dubowitz DJ, et al. Hypoxic pulmonary vasoconstriction does not contribute to pulmonary blood flow heterogeneity in normoxia in normal supine humans. J Appl Physiol 2009;106(04):1057–1064 [DOI] [PMC free article] [PubMed] [Google Scholar]
- 90.Schuster DP, Anderson C, Kozlowski J, Lange N. Regional pulmonary perfusion in patients with acute pulmonary edema. J Nucl Med 2002;43(07):863–870 [PubMed] [Google Scholar]
- 91.Wagner PD, Dantzker DR, Dueck R, Clausen JL, West JB. Ventilation-perfusion inequality in chronic obstructive pulmonary disease. J Clin Invest 1977;59(02):203–216 [DOI] [PMC free article] [PubMed] [Google Scholar]
- 92.Naeye RL. Children at high altitude: pulmonary and renal abnormalities. Circ Res 1965;16:33–38 [DOI] [PubMed] [Google Scholar]
- 93.Sylvester JT, Harabin AL, Peake MD, Frank RS. Vasodilator and constrictor responses to hypoxia in isolated pig lungs. J Appl Physiol 1980;49(05):820–825 [DOI] [PubMed] [Google Scholar]
- 94.Weissmann N, Grimminger F, Walmrath D, Seeger W. Hypoxic vasoconstriction in buffer-perfused rabbit lungs. Respir Physiol 1995;100(02):159–169 [DOI] [PubMed] [Google Scholar]
- 95.Vejlstrup NG, Dorrington KL. Intense slow hypoxic pulmonary vasoconstriction in gas-filled and liquid-filled lungs: an in vivo study in the rabbit. Acta Physiol Scand 1993;148(03):305–313 [DOI] [PubMed] [Google Scholar]
- 96.Vejlstrup NG, O’Neill M, Nagyova B, Dorrington KL. Time course of hypoxic pulmonary vasoconstriction: a rabbit model of regional hypoxia. Am J Respir Crit Care Med 1997;155(01):216–221 [DOI] [PubMed] [Google Scholar]
- 97.Morrell NW, Nijran KS, Biggs T, Seed WA. Magnitude and time course of acute hypoxic pulmonary vasoconstriction in man. Respir Physiol 1995;100(03):271–281 [DOI] [PubMed] [Google Scholar]
- 98.Carlsson AJ, Bindslev L, Santesson J, Gottlieb I, Hedenstierna G. Hypoxic pulmonary vasoconstriction in the human lung: the effect of prolonged unilateral hypoxic challenge during anaesthesia. Acta Anaesthesiol Scand 1985;29(03):346–351 [DOI] [PubMed] [Google Scholar]
- 99.Marshall BE, Marshall C, Frasch F, Hanson CW. Role of hypoxic pulmonary vasoconstriction in pulmonary gas exchange and blood flow distribution. 1. Physiologic concepts. Intensive Care Med 1994;20(04):291–297 [DOI] [PubMed] [Google Scholar]
- 100.Marshall C, Marshall B. Site and sensitivity for stimulation of hypoxic pulmonary vasoconstriction. J Appl Physiol 1983;55(03):711–716 [DOI] [PubMed] [Google Scholar]
- 101.Marshall BE, Marshall C. A model for hypoxic constriction of the pulmonary circulation. J Appl Physiol 1988;64(01):68–77 [DOI] [PubMed] [Google Scholar]
- 102.Mélot C, Naeije R, Hallemans R, Lejeune P, Mols P. Hypoxic pulmonary vasoconstriction and pulmonary gas exchange in normal man. Respir Physiol 1987;68(01):11–27 [DOI] [PubMed] [Google Scholar]
- 103.Grünig E, Mereles D, Hildebrandt W, et al. Stress Doppler echocardiography for identification of susceptibility to high altitude pulmonary edema. J Am Coll Cardiol 2000;35(04):980–987 [DOI] [PubMed] [Google Scholar]
- 104.Gao Y, Raj JU. Regulation of the pulmonary circulation in the fetus and newborn. Physiol Rev 2010;90(04):1291–1335 [DOI] [PubMed] [Google Scholar]
- 105.Arias-Stella J, Saldana M. The terminal portion of the pulmonary arterial tree in people native to high altitudes. Circulation 1963;28(05):915–925 [DOI] [PubMed] [Google Scholar]
- 106.Naeye RL. Hypoxemia, Effects on the Pulmonary Vascular Bed. Normal And Abnormal Pulmonary Circulation. Basel: Karger Publishers; 1963:302–309 [Google Scholar]
- 107.Brimioulle S, LeJeune P, Naeije R. Effects of hypoxic pulmonary vasoconstriction on pulmonary gas exchange. J Appl Physiol 1996;81(04):1535–1543 [DOI] [PubMed] [Google Scholar]
- 108.Marshall BE, Marshall C. Continuity of response to hypoxic pulmonary vasoconstriction. J Appl Physiol 1980;49(02):189–196 [DOI] [PubMed] [Google Scholar]
- 109.Bindslev L, Jolin A, Hedenstierna G, Baehrendtz S, Santesson J. Hypoxic pulmonary vasoconstriction in the human lung: effect of repeated hypoxic challenges during anesthesia. Anesthesiology 1985;62(05):621–625 [DOI] [PubMed] [Google Scholar]
- 110.Neumann PH, Kivlen CM, Johnson A, Minnear FL, Malik AB. Effect of alveolar hypoxia on regional pulmonary perfusion. J Appl Physiol 1984;56(02):338–342 [DOI] [PubMed] [Google Scholar]
- 111.Hlastala MP, Lamm WJ, Karp A, Polissar NL, Starr IR, Glenny RW. Spatial distribution of hypoxic pulmonary vasoconstriction in the supine pig. J Appl Physiol 2004;96(05):1589–1599 [DOI] [PubMed] [Google Scholar]
- 112.Hopkins SR, Garg J, Bolar DS, Balouch J, Levin DL. Pulmonary blood flow heterogeneity during hypoxia and high-altitude pulmonary edema. Am J Respir Crit Care Med 2005;171(01):83–87 [DOI] [PubMed] [Google Scholar]
- 113.Dehnert C, Risse F, Ley S, et al. Magnetic resonance imaging of uneven pulmonary perfusion in hypoxia in humans. Am J Respir Crit Care Med 2006;174(10):1132–1138 [DOI] [PubMed] [Google Scholar]
- 114.Patz MD, Sá RC, Darquenne C, et al. Susceptibility to high-altitude pulmonary edema is associated with a more uniform distribution of regional specific ventilation. J Appl Physiol 2017;122(04):844–852 [DOI] [PMC free article] [PubMed] [Google Scholar]
- 115.Naeije R, Chesler N. Pulmonary circulation at exercise. Compr Physiol 2012;2(01):711–741 [DOI] [PMC free article] [PubMed] [Google Scholar]
- 116.Naeije R. Physiology of the pulmonary circulation and the right heart. Curr Hypertens Rep 2013;15(06):623–631 [DOI] [PubMed] [Google Scholar]
- 117.Halpern SD, Taichman DB. Misclassification of pulmonary hypertension due to reliance on pulmonary capillary wedge pressure rather than left ventricular end-diastolic pressure. Chest 2009;136(01):37–43 [DOI] [PubMed] [Google Scholar]
- 118.Kovacs G, Berghold A, Scheidl S, Olschewski H. Pulmonary arterial pressure during rest and exercise in healthy subjects: a systematic review. Eur Respir J 2009;34(04):888–894 [DOI] [PubMed] [Google Scholar]
- 119.Himelman RB, Stulbarg M, Kircher B, et al. Noninvasive evaluation of pulmonary artery pressure during exercise by saline-enhanced Doppler echocardiography in chronic pulmonary disease. Circulation 1989;79(04):863–871 [DOI] [PubMed] [Google Scholar]
- 120.Nagueh SF, Middleton KJ, Kopelen HA, Zoghbi WA, Quiñones MA. Doppler tissue imaging: a noninvasive technique for evaluation of left ventricular relaxation and estimation of filling pressures. J Am Coll Cardiol 1997;30(06):1527–1533 [DOI] [PubMed] [Google Scholar]
- 121.Cope DK, Grimbert F, Downey JM, Taylor AE. Pulmonary capillary pressure: a review. Crit Care Med 1992;20(07):1043–1056 [DOI] [PubMed] [Google Scholar]
- 122.Bhattacharya J, Nanjo S, Staub NC. Micropuncture measurement of lung microvascular pressure during 5-HT infusion. J Appl Physiol 1982;52(03):634–637 [DOI] [PubMed] [Google Scholar]
- 123.Reeves JT, Taylor AE. Pulmonary hemodynamics and fluid exchange in the lungs during exercise. In: Rowell LB, Shepherd JT, eds. Handbook of Physiology: A Critical, Comprehensive Presentation of Physiological Knowledge and Concepts. New York, NY: Oxford University Press; 1996:585–613 [Google Scholar]
- 124.Moraes DL, Colucci WS, Givertz MM. Secondary pulmonary hypertension in chronic heart failure: the role of the endothelium in pathophysiology and management. Circulation 2000;102(14):1718–1723 [DOI] [PubMed] [Google Scholar]
- 125.Linehan JH, Haworth ST, Nelin LD, Krenz GS, Dawson CA. A simple distensible vessel model for interpreting pulmonary vascular pressure-flow curves. J Appl Physiol 1992;73(03):987–994 [DOI] [PubMed] [Google Scholar]
- 126.Reeves JT, Linehan JH, Stenmark KR. Distensibility of the normal human lung circulation during exercise. Am J Physiol Lung Cell Mol Physiol 2005;288(03):L419–L425 [DOI] [PubMed] [Google Scholar]
- 127.Lalande S, Yerly P, Faoro V, Naeije R. Pulmonary vascular distensibility predicts aerobic capacity in healthy individuals. J Physiol 2012;590(17):4279–4288 [DOI] [PMC free article] [PubMed] [Google Scholar]
- 128.Krenz GS, Dawson CA. Flow and pressure distributions in vascular networks consisting of distensible vessels. Am J Physiol Heart Circ Physiol 2003;284(06):H2192–H2203 [DOI] [PubMed] [Google Scholar]
- 129.Argiento P, Vanderpool RR, Mulè M, et al. Exercise stress echocardiography of the pulmonary circulation: limits of normal and sex differences. Chest 2012;142(05):1158–1165 [DOI] [PMC free article] [PubMed] [Google Scholar]
- 130.Sharma R, Kumar A, Aneja GK. Serial changes in pulmonary hemodynamics during pregnancy: a non-invasive study using Doppler echocardiography. Cardiol Res 2016;7(01):25–31 [DOI] [PMC free article] [PubMed] [Google Scholar]
- 131.Singh I, Horn E, Haythe J. Pulmonary hypertension in pregnancy. Clin Chest Med 2021;42(01):91–99 [DOI] [PubMed] [Google Scholar]
- 132.Beck KC, Rehder K. Differences in regional vascular conductances in isolated dog lungs. J Appl Physiol 1986;61(02):530–538 [DOI] [PubMed] [Google Scholar]
- 133.Greenleaf JF, Ritman EL, Sass DJ, Wood EH. Spatial distribution of pulmonary blood flow in dogs in left decubitus position. Am J Physiol 1974;227(01):230–244 [DOI] [PubMed] [Google Scholar]
- 134.Reed JH Jr, Wood EH. Effect of body position on vertical distribution of pulmonary blood flow. J Appl Physiol 1970;28(03): 303–311 [DOI] [PubMed] [Google Scholar]
- 135.Atwood RM, Burchell HB, Tauxe WN. Pulmonary scans achieved with macroaggregated radioiodinated albumin: use in diagnosis of pulmonary artery agenesis. Am J Med Sci 1966;252(01):84–88 [DOI] [PubMed] [Google Scholar]
- 136.Friedman WF, Braunwald E. Alterations in regional pulmonary blood flow in mitral valve disease studied by radioisotope scanning. A simple nontraumatic technique for estimation of left atrial pressure. Circulation 1966;34(03):363–376 [DOI] [PubMed] [Google Scholar]
- 137.Tauxe WN, Burchell HB, Chaapel DW, Sprau A. Quantitating the effect of gravity on lung scans of macroaggregates of albumin-I-131. J Appl Physiol 1966;21(04):1381–1386 [DOI] [PubMed] [Google Scholar]
- 138.Lovering AT, Haverkamp HC, Romer LM, Hokanson JS, Eldridge MW. Transpulmonary passage of 99mTc macroaggregated albumin in healthy humans at rest and during maximal exercise. J Appl Physiol 2009;106(06):1986–1992 [DOI] [PMC free article] [PubMed] [Google Scholar]
- 139.Roughton FJ, Forster RE. Relative importance of diffusion and chemical reaction rates in determining rate of exchange of gases in the human lung, with special reference to true diffusing capacity of pulmonary membrane and volume of blood in the lung capillaries. J Appl Physiol 1957;11(02):290–302 [DOI] [PubMed] [Google Scholar]
- 140.Hsia CCW. Recruitment of lung diffusing capacity: update of concept and application. Chest 2002;122(05):1774–1783 [DOI] [PubMed] [Google Scholar]
- 141.Langleben D, Orfanos SE, Giovinazzo M, et al. Pulmonary capillary surface area in supine exercising humans: demonstration of vascular recruitment. Am J Physiol Lung Cell Mol Physiol 2019;317(03):L361–L368 [DOI] [PubMed] [Google Scholar]
- 142.Orfanos SE, Langleben D, Khoury J, et al. Pulmonary capillary endothelium-bound angiotensin-converting enzyme activity in humans. Circulation 1999;99(12):1593–1599 [DOI] [PubMed] [Google Scholar]
- 143.Cardús J, Burgos F, Diaz O, et al. Increase in pulmonary ventilation-perfusion inequality with age in healthy individuals. Am J Respir Crit Care Med 1997;156(2, pt 1):648–653 [DOI] [PubMed] [Google Scholar]
- 144.Janssens JP. Aging of the respiratory system: impact on pulmonary function tests and adaptation to exertion. Clin Chest Med 2005;26(03):469–484, vi–vii [DOI] [PubMed] [Google Scholar]
- 145.Holley HS, Milic-Emili J, Becklake MR, Bates DV. Regional distribution of pulmonary ventilation and perfusion in obesity. J Clin Invest 1967;46(04):475–481 [DOI] [PMC free article] [PubMed] [Google Scholar]
- 146.Frerichs I, Braun P, Dudykevych T, Hahn G, Genée D, Hellige G. Distribution of ventilation in young and elderly adults determined by electrical impedance tomography. Respir Physiol Neurobiol 2004;143(01):63–75 [DOI] [PubMed] [Google Scholar]
- 147.Verbanck S, Thompson BR, Schuermans D, et al. Ventilation heterogeneity in the acinar and conductive zones of the normal ageing lung. Thorax 2012;67(09):789–795 [DOI] [PubMed] [Google Scholar]
- 148.Lam CS, Borlaug BA, Kane GC, Enders FT, Rodeheffer RJ, Redfield MM. Age-associated increases in pulmonary artery systolic pressure in the general population. Circulation 2009;119(20):2663–2670 [DOI] [PMC free article] [PubMed] [Google Scholar]
- 149.Coffman KE, Carlson AR, Miller AD, Johnson BD, Taylor BJ. The effect of aging and cardiorespiratory fitness on the lung diffusing capacity response to exercise in healthy humans. J Appl Physiol 2017;122(06):1425–1434 [DOI] [PMC free article] [PubMed] [Google Scholar]
- 150.Chang SC, Chang HI, Liu SY, Shiao GM, Perng RP. Effects of body position and age on membrane diffusing capacity and pulmonary capillary blood volume. Chest 1992;102(01):139–142 [DOI] [PubMed] [Google Scholar]
- 151.Stam H, Hrachovina V, Stijnen T, Versprille A. Diffusing capacity dependent on lung volume and age in normal subjects. J Appl Physiol 1994;76(06):2356–2363 [DOI] [PubMed] [Google Scholar]
- 152.Georges R, Saumon G, Loiseau A. The relationship of age to pulmonary membrane conductance and capillary blood volume. Am Rev Respir Dis 1978;117(06):1069–1078 [DOI] [PubMed] [Google Scholar]
- 153.Hermann EA, Motahari A, Hoffman EA, et al. Pulmonary blood volume among older adults in the community: the MESA Lung Study. Circ Cardiovasc Imaging 2022;15(08):e014380. [DOI] [PMC free article] [PubMed] [Google Scholar]
- 154.Huang YC, Helms MJ, MacIntyre NR. Normal values for single exhalation diffusing capacity and pulmonary capillary blood flow in sitting, supine positions, and during mild exercise. Chest 1994;105(02):501–508 [DOI] [PubMed] [Google Scholar]
- 155.Ross BA, Brotto AR, Fuhr DP, et al. The supine position improves but does not normalize the blunted pulmonary capillary blood volume response to exercise in mild COPD. J Appl Physiol 2020;128(04):925–933 [DOI] [PubMed] [Google Scholar]
- 156.Johnson RL Jr, Spicer WS, Bishop JM, Forster RE. Pulmonary capillary blood volume, flow and diffusing capacity during exercise. J Appl Physiol 1960;15:893–902 [DOI] [PubMed] [Google Scholar]
- 157.Holland J, Milic-Emili J, Macklem PT, Bates DV. Regional distribution of pulmonary ventilation and perfusion in elderly subjects. J Clin Invest 1968;47(01):81–92 [DOI] [PMC free article] [PubMed] [Google Scholar]
- 158.McQuillan BM, Picard MH, Leavitt M, Weyman AE. Clinical correlates and reference intervals for pulmonary artery systolic pressure among echocardiographically normal subjects. Circulation 2001;104(23):2797–2802 [DOI] [PubMed] [Google Scholar]
- 159.Anthonisen NR, Milic-Emili J. Distribution of pulmonary perfusion in erect man. J Appl Physiol 1966;21(03):760–766 [DOI] [PubMed] [Google Scholar]
- 160.West JB. Importance of gravity in determining the distribution of pulmonary blood flow. J Appl Physiol 2002;93(05):1888–1889, author reply 1889–1891 [DOI] [PubMed] [Google Scholar]
- 161.Prisk GK, Yamada K, Henderson AC, et al. Pulmonary perfusion in the prone and supine postures in the normal human lung. J Appl Physiol 2007;103(03):883–894 [DOI] [PMC free article] [PubMed] [Google Scholar]
- 162.Fain SB, Altes TA, Panth SR, et al. Detection of age-dependent changes in healthy adult lungs with diffusion-weighted 3He MRI. Acad Radiol 2005;12(11):1385–1393 [DOI] [PubMed] [Google Scholar]
- 163.Higginbotham MB, Morris KG, Williams RS, McHale PA, Coleman RE, Cobb FR. Regulation of stroke volume during submaximal and maximal upright exercise in normal man. Circ Res 1986;58(02):281–291 [DOI] [PubMed] [Google Scholar]
- 164.Wagner PD, Gale GE, Moon RE, Torre-Bueno JR, Stolp BW, Saltzman HA. Pulmonary gas exchange in humans exercising at sea level and simulated altitude. J Appl Physiol 1986;61(01):260–270 [DOI] [PubMed] [Google Scholar]
- 165.Tedjasaputra V, Bouwsema MM, Stickland MK. Effect of aerobic fitness on capillary blood volume and diffusing membrane capacity responses to exercise. J Physiol 2016;594(15):4359–4370 [DOI] [PMC free article] [PubMed] [Google Scholar]
- 166.Bouwsema MM, Tedjasaputra V, Stickland MK. Are there sex differences in the capillary blood volume and diffusing capacity response to exercise? J Appl Physiol 2017;122(03):460–469 [DOI] [PMC free article] [PubMed] [Google Scholar]
- 167.Hsia CC, McBrayer DG, Ramanathan M. Reference values of pulmonary diffusing capacity during exercise by a rebreathing technique. Am J Respir Crit Care Med 1995;152(02):658–665 [DOI] [PubMed] [Google Scholar]
- 168.Langleben D, Fox BD, Orfanos SE, Giovinazzo M, Catravas JD. Pulmonary capillary recruitment and distention in mammalian lungs: species similarities. Eur Respir Rev 2022;31(163):210248. [DOI] [PMC free article] [PubMed] [Google Scholar]
- 169.La Gerche A, Rakhit DJ, Claessen G. Exercise and the right ventricle: a potential Achilles’ heel. Cardiovasc Res 2017;113(12):1499–1508 [DOI] [PubMed] [Google Scholar]
- 170.Zavorsky GS, Smoliga JM. The association between cardiorespiratory fitness and pulmonary diffusing capacity. Respir Physiol Neurobiol 2017;241:28–35 [DOI] [PubMed] [Google Scholar]
- 171.Elbehairy AF, Faisal A, Guenette JA, et al. ; Canadian Respiratory Research Network (CRRN) Resting physiological correlates of reduced exercise capacity in smokers with mild airway obstruction. COPD 2017;14(03):267–275 [DOI] [PubMed] [Google Scholar]
- 172.West JB, Tsukimoto K, Mathieu-Costello O, Prediletto R. Stress failure in pulmonary capillaries. J Appl Physiol 1991;70(04):1731–1742 [DOI] [PubMed] [Google Scholar]
- 173.Hopkins SR, Schoene RB, Henderson WR, Spragg RG, Martin TR, West JB. Intense exercise impairs the integrity of the pulmonary blood-gas barrier in elite athletes. Am J Respir Crit Care Med 1997;155(03):1090–1094 [DOI] [PubMed] [Google Scholar]
- 174.West JB, Mathieu-Costello O, Jones JH, et al. Stress failure of pulmonary capillaries in racehorses with exercise-induced pulmonary hemorrhage. J Appl Physiol 1993;75(03):1097–1109 [DOI] [PubMed] [Google Scholar]
- 175.Hopkins SR, Schoene RB, Henderson WR, Spragg RG, West JB. Sustained submaximal exercise does not alter the integrity of the lung blood-gas barrier in elite athletes. J Appl Physiol 1998;84(04):1185–1189 [DOI] [PubMed] [Google Scholar]
- 176.West JB. Invited review: pulmonary capillary stress failure. J Appl Physiol 2000;89(06):2483–2489, discussion 2497 [DOI] [PubMed] [Google Scholar]
- 177.Bake B, Bjure J, Widimsky J. The effect of sitting and graded exercise on the distribution of pulmonary blood flow in healthy subjects studied with the 133Xenon technique. Scand J Clin Lab Invest 1968;22(02):99–106 [DOI] [PubMed] [Google Scholar]
- 178.Harf A, Pratt T, Hughes JM. Regional distribution of VA/Q in man at rest and with exercise measured with krypton-81m. J Appl Physiol 1978;44(01):115–123 [DOI] [PubMed] [Google Scholar]
- 179.Mohsenifar Z, Ross MD, Waxman A, Goldbach P, Koerner SK. Changes in distribution of lung perfusion and ventilation at rest and during maximal exercise. Chest 1985;87(03):359–362 [DOI] [PubMed] [Google Scholar]
- 180.Hopkins SR, Kleinsasser A, Bernard S, et al. Hypoxia has a greater effect than exercise on the redistribution of pulmonary blood flow in swine. J Appl Physiol 2007;103(06):2112–2119 [DOI] [PubMed] [Google Scholar]
- 181.Melsom MN, Flatebø T, Sjaastad OV, Aulie A, Nicolaysen G. Minor redistribution of ventilation and perfusion within the lung during exercise in sheep. Acta Physiol Scand 1999;165(03):283–292 [DOI] [PubMed] [Google Scholar]
- 182.Bernard SL, Glenny RW, Erickson HH, et al. Minimal redistribution of pulmonary blood flow with exercise in racehorses. J Appl Physiol 1996;81(03):1062–1070 [DOI] [PubMed] [Google Scholar]
- 183.Kuikka JT, Länsimies E. A fractal approach for evaluation of pulmonary circulation in man at rest and during exercise. Clin Physiol 1999;19(02):107–110 [DOI] [PubMed] [Google Scholar]
- 184.Parker JC, Ardell JL, Hamm CR, Barman SA, Coker PJ. Regional pulmonary blood flow during rest, tilt, and exercise in unanesthetized dogs. J Appl Physiol 1995;78(03):838–846 [DOI] [PubMed] [Google Scholar]
- 185.Burnham KJ, Arai TJ, Dubowitz DJ, et al. Pulmonary perfusion heterogeneity is increased by sustained, heavy exercise in humans. J Appl Physiol 2009;107(05):1559–1568 [DOI] [PMC free article] [PubMed] [Google Scholar]
- 186.Tedjasaputra V, Sá RC, Anderson KM, Prisk GK, Hopkins SR. Heavy upright exercise increases ventilation-perfusion mismatch in the basal lung: indirect evidence for interstitial pulmonary edema. J Appl Physiol 2019;127(02):473–481 [DOI] [PMC free article] [PubMed] [Google Scholar]
- 187.Stokes DL, MacIntyre NR, Nadel JA. Nonlinear increases in diffusing capacity during exercise by seated and supine subjects. J Appl Physiol 1981;51(04):858–863 [DOI] [PubMed] [Google Scholar]
- 188.Musch G, Layfield JD, Harris RS, et al. Topographical distribution of pulmonary perfusion and ventilation, assessed by PET in supine and prone humans. J Appl Physiol 2002;93(05):1841–1851 [DOI] [PubMed] [Google Scholar]
- 189.Nyrén S, Mure M, Jacobsson H, Larsson SA, Lindahl SG. Pulmonary perfusion is more uniform in the prone than in the supine position: scintigraphy in healthy humans. J Appl Physiol 1999;86(04):1135–1141 [DOI] [PubMed] [Google Scholar]
- 190.Henderson AC, Sá RC, Theilmann RJ, Buxton RB, Prisk GK, Hopkins SR. The gravitational distribution of ventilation-perfusion ratio is more uniform in prone than supine posture in the normal human lung. J Appl Physiol 2013;115(03):313–324 [DOI] [PMC free article] [PubMed] [Google Scholar]
- 191.Rohdin M, Petersson J, Sundblad P, et al. Effects of gravity on lung diffusing capacity and cardiac output in prone and supine humans. J Appl Physiol 2003;95(01):3–10 [DOI] [PubMed] [Google Scholar]
- 192.Soni N, Williams P. Positive pressure ventilation: what is the real cost? Br J Anaesth 2008;101(04):446–457 [DOI] [PubMed] [Google Scholar]
- 193.Nieman GF, Paskanik AM, Bredenberg CE. Effect of positive end-expiratory pressure on alveolar capillary perfusion. J Thorac Cardiovasc Surg 1988;95(04):712–716 [PubMed] [Google Scholar]
- 194.Luecke T, Pelosi P. Clinical review: positive end-expiratory pressure and cardiac output. Crit Care 2005;9(06):607–621 [DOI] [PMC free article] [PubMed] [Google Scholar]
- 195.Kallas HJ, Domino KB, Glenny RW, Anderson EA, Hlastala MP. Pulmonary blood flow redistribution with low levels of positive end-expiratory pressure. Anesthesiology 1998;88(05):1291–1299 [DOI] [PubMed] [Google Scholar]
- 196.Petersson J, Ax M, Frey J, Sánchez-Crespo A, Lindahl SG, Mure M. Positive end-expiratory pressure redistributes regional blood flow and ventilation differently in supine and prone humans. Anesthesiology 2010;113(06):1361–1369 [DOI] [PubMed] [Google Scholar]