

Abstract
Academic Abstract
In the wake of the replication crisis, social and personality psychologists have increased attention to power analysis and the adequacy of sample sizes. In this article, we analyze current controversies in this area, including choosing effect sizes, why and whether power analyses should be conducted on already-collected data, how to mitigate the negative effects of sample size criteria on specific kinds of research, and which power criterion to use. For novel research questions, we advocate that researchers base sample sizes on effects that are likely to be cost-effective for other people to implement (in applied settings) or to study (in basic research settings), given the limitations of interest-based minimums or field-wide effect sizes. We discuss two alternatives to power analysis, precision analysis and sequential analysis, and end with recommendations for improving the practices of researchers, reviewers, and journal editors in social-personality psychology.
Public Abstract
Recently, social-personality psychology has been criticized for basing some of its conclusions on studies with low numbers of participants. As a result, power analysis, a mathematical way to ensure that a study has enough participants to reliably “detect” a given size of psychological effect, has become popular. This article describes power analysis and discusses some controversies about it, including how researchers should derive assumptions about effect size, and how the requirements of power analysis can be applied without harming research on hard-to-reach and marginalized communities. For novel research questions, we advocate that researchers base sample sizes on effects that are likely to be cost-effective for other people to implement (in applied settings) or to study (in basic research settings). We discuss two alternatives to power analysis, precision analysis and sequential analysis, and end with recommendations for improving the practices of researchers, reviewers, and journal editors in social-personality psychology.
Keywords: research methods, statistics, power analysis, sample size
The recent movement toward reform in social-personality psychological research has revived interest in studies’ sample sizes and statistical power. Small sample sizes have been shown to jeopardize the accuracy and replicability of statistical conclusions (Open Science Collaboration, 2015). There has been a push to improve the usual methods of determining sample size, such as intuition or rules of thumb (e.g., 20 observations per cell; Simmons et al., 2011). For example, the Journal of Personality and Social Psychology now requires authors to address “justifiable power consideration” (American Psychological Association, 2022; see also Leach, 2021), while other journals such as Personality and Social Psychology Bulletin (Crandall et al., 2018), Social and Personality Psychological Science (Vazire, 2016), and Journal of Experimental Social Psychology (Giner-Sorolla, 2016) have requested authors to discuss sample size determination for some years now. With this emphasis has come an appreciation that further work is needed, because researchers sometimes show confusion or disagreement about the starting effect size needed to make decisions from a priori power analysis (see Blake & Gangestad, 2020; Farmus et al., 2023).
Power also comes into play when evaluating research post hoc. Although the sample size reported in a study is important, the power of its key tests is also tied to study design, analytic choices, and other features of the research setting that feed into effect size. For example, a repeated-measures analysis with few participants, but many data points per participant, can have far greater power than a between-subjects analysis with many participants each supplying one data point, because between-subjects error variance is controlled (see McClelland, 2000). Without understanding this point, relying on N-per-design-cell guidelines (e.g., van Voorhis & Morgan, 2007), which are often calibrated for between-subjects designs, can lead evaluators astray. For example, abstract submission guidelines for psychology articles and presentations often require reporting the N of studies but not the power of focal tests (American Psychological Association, 2020; Society for Personality and Social Psychology, 2022), implicitly promoting heuristic evaluation of robustness in terms of N. An evaluation of a given sample cannot be properly made without power analysis, as power functions are nonlinear and analysis-specific (Cohen, 1988). Therefore, any heuristic that deems a study inadequate based on a mere count of participants can underestimate designs that use participants efficiently.
Accordingly, researchers have turned to various forms of power analyses (Cohen, 1988) and precision-based approaches (e.g., Rothman & Greenland, 2018) to select and evaluate sample sizes. In this article, we review existing facts and controversies about power and sample size adequacy, review different kinds of sample size determination methods, discuss standards for reporting them, and review tools and approaches for power analysis. There are constraints to the generality of this coverage, which is intended for social-personality psychology researchers who are not statistics experts. Formulae and the like are downplayed in favor of conceptual explanations; the methods and analyses used in examples are those most typically used in social-personality research; and we do not cover sample size determination in qualitative and archival research, because these methods usually assume a different basis for inference than the population sampling that underpins most quantitative research with human participants.
The journals and books we cite are mainly published in the United States and Europe (e.g., outlets associated with the American Psychological Association and Association for Psychological Science, along with journals containing the term “European” in the title, e.g., European Journal of Social Psychology). Journals’ geographic locations are not a perfect reflection of authors’ nationality. For example, authors outside the United States can publish in APA journals; however, journals’ locations are probably a reasonable approximation of authors’ nationality. The scholars we most frequently cite are quantitative psychologists, based on the field in which they received their PhD and/or their faculty appointments. Some of the research we cite involves large-scale computer simulation studies, suggesting that some of our cited authors come from highly resourced nations and universities. Authors with interesting ideas on statistical power but who have not published in wealthy nations’ flagship journals may thus be underrepresented in our review.
Uncertainty about how to use power analysis in social/personality psychology led to a Power Analysis Working Group being convened at the 2019 meeting of the Society for Personality and Social Psychology, in response to a call from Executive Director Chad Rummel. This article’s authors are the members of that group. As for our positionality, we are based at various institutions in the United States and Western Europe and conduct quantitative research in social or personality psychology through a variety of approaches including laboratory experiments, analyses of survey data, and meta-analyses. Collectively, we are versed in many statistical techniques, and all have spent time over our careers thinking about issues of statistical power, effect sizes, and the practical importance of research findings. While we all see importance in the common goal of increasing the robustness of published findings, a particular concern for several of our authors has been avoiding roadblocks to research on novel issues and understudied populations, in which sample sizes may be considered small for statistical power purposes. It is from this standpoint that we make these recommendations.
To accompany this review and discussion of issues in power analysis, we have prepared a supplemental document that reviews recent developments, including online tools, in determining sample size (Aberson et al., 2023). Although that document was not part of this article’s peer review, by invitation of the Editor we are referencing it to give the reader access to a more detailed explanation of sample size determination procedures for specific statistical tests.
Sample Size Determination Methods
While most researchers in the field will be, at least superficially, familiar with power analysis as the most common method of sample size determination, there are a variety of others. In addition, power analysis encompasses more flexible methods than many researchers are currently aware of. In this section, we briefly review power analysis before addressing four current controversies: how to derive effect size, whether power analysis post hoc is informative, whether requiring power analysis is detrimental to certain topics of research, and which power level should be adopted. We then consider two of the alternatives to power analysis and finish with recommendations for best practices in sample size determination, reporting, and evaluation.
Power Analysis
Statistical power derives from the Neyman–Pearson approach to statistical hypothesis testing (Neyman & Pearson, 1933). Statistical power is defined as 1 − β (Cohen, 1988, 1992), where β is the false negative error rate (the probability of failing to detect an effect as significant if the alternative hypothesis is true and assumptions of the significance test are met). In other words, higher power means that true effects (if present) are detected more frequently. Importantly, power is a property of a statistical test, not strictly speaking of a study, because any given study may use more than one test of central and peripheral hypotheses. However, common usages of “power” such as “well-powered studies” can be interpreted reasonably as “minimum power of the key hypothesis-confirming test(s) within the study.”
In Cohen’s writings (e.g., Cohen, 1988), and in most current psychology research, the recommended level of power is conventionally 80%, yielding a false-negative error rate (β) of 20% if the alternative hypothesis is true and test assumptions are met. This arbitrary convention stems from Cohen’s (1965) intuition, made by his own admission “diffidently” (p. 99), that false positives are four times worse for science than false negatives. Hence, if “false positives” (α) are kept at 5%, 1 “false negatives” (β) should be no more than 20%. The value of the 80% blanket recommendation is explored more in Controversy #4.
Power analysis should not be conflated with one specific usage in which sample size is determined given a desired power level (and other features of the analysis). Common software (e.g., G*Power; Faul et al., 2007, 2009) refers to this kind of analysis as “a priori,” so researchers may be tempted to presume this is the best (or only) calculation that can be conducted before conducting a study. In fact, there are several values that can be computed as output using the power function. Given a specific research design and hypothesis testing procedure, and treating population parameters as fixed, four parameters are involved: α-level, population effect size, sample size, and power. When three of these are known or estimated, the fourth can be determined, creating four distinct types of analysis (Cohen, 1988). The first three examples below assume α = .05, two-tailed 2 —a common criterion in psychology. In all analyses below, effect size refers to the (unknown) population effect size, not the observed effect size in the sample.
Sample-size determination analysis, our preferred term for what is often called an “a priori” power analysis (Faul et al., 2007), inputs the desired power and an effect size, or distribution of effect sizes, for which power is desired. It returns a target sample size. For example, to detect a Pearson correlation test’s effect size of ρ ≥ .40 with at least 80% power, determination power analysis requires N = 44 observations. Even if the actual data have a fixed N, sample-size determination analysis after data collection can still yield an ideal sample size given certain input assumptions, to be compared against the actual N obtained.
An effect-size sensitivity analysis inputs the desired power and likely (or achieved) usable sample size. It returns the minimum population effect size detectable at this power. For example, with 100 observations, an effect-size sensitivity analysis identifies that 80% power will be achieved for correlations that have size ρ ≥ .27 in the population.
A power-determination analysis, sometimes referred to as “post-hoc power” in tools such as G*Power, inputs N and a population effect size, and it returns power. For example, given that N = 100 are collected, a power-determination analysis reveals power is terrible (16%) to detect a population correlation of ρ = .10 and excellent (87%) to detect a slightly larger population correlation of ρ = .30. Again, this analysis is not necessarily confined to post hoc timing, because N, effect size, and other parameters can be determined hypothetically.
The least well-known kind of power analysis, criterion analysis (Faul et al., 2007), inputs N, effect size, and a power level, and takes as output the α-level (significance criterion) required to reach that power level given the other parameters. For example, it can be used to see whether a power of 80% can be reached in a test of 75 people seeking ρ = .30 by increasing the α, reflecting a decision that in this case it is more important to risk a Type II than Type I error. In this case it is enough to raise α to .071 to reach 80% power. The technique can also be termed “compromise analysis” because it can be used to find an optimal point between minimizing alpha and maximizing beta. We will return to this method when discussing the optimal level of power (Controversy #4).
The appropriate analysis depends on the researcher’s goals. A sample size-determination power analysis will return the minimum necessary sample size given a particular effect size and power level. While this method may seem like the most intuitive for selecting a sample size for a study, it is difficult to use accurately. Primarily, power is influenced by the (unknown) population effect size. Thus, any sample size determination power analysis requires that researchers input some effect size they wish to detect, the value of which determines sample size. A researcher who wishes to detect “small” (d = .20) effects in an independent-samples t-test must collect N = 787 observations, whereas a researcher who is happy to detect slightly larger effects at the same power level (d = .35) need only collect one third that sample size—N = 258.
Elevating sample size determination power to a gold standard, moreover, comes with unintended consequences. First, it incentivizes misrepresentation of substandard procedures. For example, researchers may simply collect data until funding runs out or until an academic term ends, but then, to be published or funded, write up analyses as if sample size planning had been a priori. This questionable practice resembles HARKing (Hypothesizing After the Results are Known; Kerr, 1998), that is, presenting post hoc interpretations as having been generated a priori. Instead, researchers who are limited by practical sampling considerations should report an effect-size sensitivity analysis, which puts the selection of sample size first and leaves effect sizes as an output to be interpreted rather than a prior assumption.
Having effect-size sensitivity in the toolkit gives several advantages. First, it allows researchers to explicitly consider sample-size criteria other than power (e.g., resources) when planning research. These are often realities of research design, yet a sample size-determination analysis does not allow for their consideration. Second, if it is already the practice of researchers to use a given N deemed feasible for their lab or other typical labs, then reporting it as such is transparent and accurate. Third, even if a sample size-determination analysis is used, the final number of cases may differ from its recommendations. For example, researchers who collect reaction-time tests often reject some of their samples for fast, slow, or wrong responses (Ratcliff, 1993). An effect-size sensitivity analysis may be needed to evaluate this new usable sample size.
In practice, all three kinds of power analysis may be run in concert, even before a study begins. For example, a researcher might decide it best to be able to detect d ≥ .20. A sample-size-determination analysis can then be used to find a target N (e.g., finding that N = 787 for 80% power to detect d = 0.20 with an independent-samples t-test). Using this example, they might then realize that N = 787 is unrealistic because 500 is the maximum sample size achievable with current funding. Power-determination analysis could then be used to assess the adequacy of that sample size (e.g., revealing that only 61% power is achieved for N = 500 and d = 0.20). Begrudgingly, the researcher might give up on detecting such small effects and instead ask: What effect sizes can be detected with N = 500? An effect-size sensitivity analysis could then reveal that N = 500 can detect d = 0.25 with 80% power. The researcher might decide this is close enough to the original intended effect size and proceed to gather 500 participants. The researcher may also consider using other means to increase the potential effect size, particularly by improving components such as the strength of manipulation or the reliability of measures. Alternatively, if d = 0.25 seems inadequate, the researcher could seek additional resources to collect the initially recommended sample size for d = .20.
Table 1 summarizes each of these types of power analysis. Although the terms disseminated by G*Power software (Faul et al., 2009) are popular, we believe there are good reasons to prefer our scheme in which each term is defined by the output parameter rather than by assumptions about when the test is carried out. As our examples show, relying on time-based terms can lead to ignoring or unjustly dismissing potential applications of each type of analysis. Both N and effect size can be hypothesized either before or after data collection, and both can also be observed after data collection. Controversies about “post-hoc” power analysis have also hinged on demonstrating low additional value (over and beyond the p value) of a specific kind of power determination using observed effect size. While this use is not recommended, power-determination using effect sizes not derived from the data can be useful, and should be considered without the stigma from the overgeneralized term “post-hoc.” Finally, “sensitivity analysis” sometimes causes confusion because of the well-established use of the identical term to designate a completely different method in risk analysis (e.g., Iooss & Saltelli, 2017), so the addition of “effect-size” as a modifier both distinguishes the term and continues the system of mentioning the output parameter in the name.
Table 1.
Preferred Nomenclature for Four Types of Power Analysis With Brief Explanation.
| Our preferred name | Term used by G*Power software | Main input parameters | Output parameter | Main reason for change |
|---|---|---|---|---|
| Sample-size determination | A priori | Effect size, power, alpha | N | Avoid confusion with a priori use of other methods |
| Effect-size sensitivity | Sensitivity | Power, N, alpha | Effect size | Avoid confusion with the widely used procedure of sensitivity analysis in risk assessment |
| Power-determination | Post hoc | Effect size, N, alpha | Power | Avoid confusion with post hoc use of other methods; avoid stigma from inappropriate uses of power determination based on observed effect size |
| Criterion (compromise) | Criterion | Effect size, N, power | Alpha | No change |
Researchers may be tempted, or requested, to use evaluative terms to characterize “the” power level for a study—or more accurately, for its main hypothesis-confirming analysis. Indeed, a Google Scholar search identifies more than 700 articles since the start of 2018 reporting the phrase “high-powered” or “low-powered” in journals with “Psychology” in the title alone; “well-powered” gives a further 500 hits and “underpowered,” more than 2,000. These phrases usually describe the statistical power of a replication’s focal test, the power of the focal test in the present study, or the evidence base of existing literature. Although such evaluative phrases may seem handy, they are fundamentally ambiguous without further specification. If researchers end up agreeing on their meaning, it is only because they implicitly share some idea of the underlying parameters, that is, the standard Cohen (1988) recommendation of 80% power, and ideas about which effect sizes are typical or desirable in their literature. Also, it is obvious that (for example) a test with 200 participants per condition is better powered than one with 20, all else being equal. This relative sense of “better-powered” is more justifiable than the absolute sense of “well-powered.”
Because population effect sizes are unknown, researchers need to consider a range of possible effect sizes to accurately assess power for each analysis, whether through modeling an effect size distribution, inputting the raw parameters that makeup effect size (e.g., mean, SD) into a simulation, or just by inputting a point value of effect size. Although unknown, the population effect size is also crucial because it determines what analysis has the power to detect. All analyses have high power to detect some (large) effects and low power to detect some (small) effects. For example, a sample test with N = 100 has 99% power to detect a Pearson correlation test’s effect size of ρ = .50 yet only 52% power to detect ρ = .10. Similar calculations can be made for a range of all possible effect sizes. For this reason, power probabilities can be best envisioned as a curve across the range of possible effect sizes rather than a single value (Figure 1).
Figure 1.
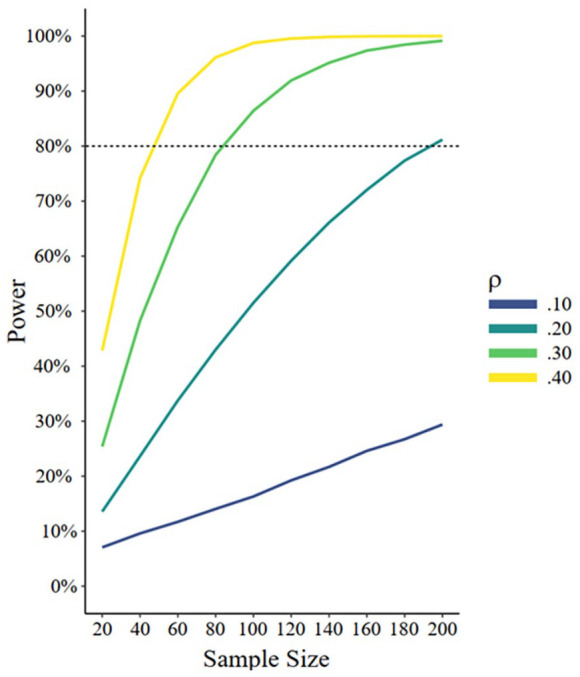
Power Curves for a Simple Correlation Test, Given Different Population Values of the Correlation Coefficient Rho (r)
In addition, different tests within the same study can provide different levels of power. If a study is reported as having 80% power, it can only be reported as such in the context of a given effect size and a given analysis (e.g., “the final sample had at least 80% power to detect Pearson correlations ρ > .28 at α = .05”). But studies with multiple analyses within a single sample (e.g., independent-samples t-test and a mediation analysis) do not have a single level of power because the power for the different tests will differ.
Power Analysis: Controversies and Alternatives
As we can already see, using power analysis to determine and evaluate sample size is not always straightforward. Power analysis makes assumptions about effect size, timing, available resources, and desired power level. In the next section, we review and discuss four important controversies about these assumptions and offer guidelines for researchers. What effect size should we enter into our power calculations? Can power analysis be useful if it is conducted after data collection? How can the downsides of power-based requirements for difficult types of research be dealt with? And what level of power is appropriate?
Controversy # 1: How to Determine Effect Size in Power Analysis?
Interpreting the effect sizes used in power analysis is critical to its employment and interpretation, but it is not always obvious what kind of effect size to expect. It may seem paradoxical for a novel question. Why should we need to know how large an effect will be when our experiment will be the first to tell us how large the effect will be? Out of 614 social and personality psychology researchers surveyed by Washburn et al. (2018), 31% cited the indeterminacy of effect sizes as a reason why they sometimes avoid using power analysis. Against such resistance, it is easy to understand the temptation to propose a standard, conventional target effect size. Especially when funding, publication, or IRB approval might hinge upon study plans being seen as “well-powered” for the critical hypothesis test, agreeing on a fixed standard for effect size would present the appearance of objectivity and consensus. Instead of one clear criterion, there are many different approaches to determining the appropriate effect size, which we will review and evaluate. We then propose our own flexible but principled criteria based on two main kinds of practical interest: basic and applied.
In contemporary social-personality psychology, researchers often refer to Jacob Cohen’s benchmarks designating small, medium, and large effect sizes (e.g., Cohen, 1988). These benchmarks came from Cohen’s subjective perceptions of typical results in psychology, but they have been shown to be internally inconsistent between mathematically transformable sizes for r, d, and f2 (Correll et al., 2020). Even Cohen (1988, pp. 12–13) himself gave clear warnings against adopting these benchmarks too rigidly. We believe, likewise, that standards for effect size should depend on the purpose of the research if there is little existing knowledge about the phenomenon being studied.
Still, the standard benchmarks are popular not just as descriptions of observed effect sizes, but as criteria for power analysis. Correll et al. (2020) observed that most power analyses they found in a survey of the psychology literature started from these “t-shirt size” benchmarks rather than from prior data. Our own Google Scholar search for the exact phrases “detect a medium effect” and “detect a medium-sized effect,” often used in power justifications, yielded, as of October 19, 2021, 2,452 articles since January 1, 2020, mostly in psychology and related disciplines. Compared with similar results substituting “small-to-medium” (494) and “large” (619), it seems that conventional “medium” values prevail as a rationale for power analysis, following the strategy advocated by Hesiod and also by Goldilocks: “moderation in all things.” 3
In this section, we argue that determining the appropriate effect size to use for power analysis and related techniques is a complex process that defies easy solutions. Yet it is important for the advancement of science that we do not shy away from that complexity (Spurlock, 2019). Rather than offering a single criterion, we will first discuss general principles in considering effect sizes, and then review several determination methods in order, including the novel terminology of basic and applied practical effect size. We also note that these determination methods provide vital information both for traditional methods of power analysis in which point estimates for effect size are entered and for newer methods relying on distributions of effect sizes (e.g., S. F. Anderson et al., 2017; Chen et al., 2018; Pek & Park, 2019). Although the latter methods model effect sizes as distributions rather than points, their inputs still need to draw on realistic values for maximum, minimum, and mean parameters.
Principles of Effect Size Determination
Determining effect size a priori requires an understanding of what effect size is. We will assume that most psychology researchers are familiar with the concept of effect size reflecting a ratio of observed effect (e.g., difference between means) to noise surrounding it (e.g., pooled standard deviations). Cohen’s (1988) method of assigning a separate effect size metric to accompany each statistical test has resulted in a plethora of Latin and Greek letters, although there have been calls to adopt a broader standard, such as r-equivalent (Rosenthal & Rubin, 2003) or proportion-of-variance measures in the η2 family (Correll et al., 2020). There are also distinctions such as between population and sample effect size or between standardized and unstandardized effect size (Kelley & Preacher, 2012). In particular, thinking about effect sizes in terms of unstandardized components—raw units of the independent variable (e.g., years of education, temperature in degrees Fahrenheit), standard deviation of the dependent variable—helps to ground effect size estimates in reality and measurement method of the phenomenon being studied (Baguley, 2009; Pek & Flora, 2018). However, the main issue in determining effect sizes for power analysis is which source to use: the typical size of existing research, a size of minimal theoretical interest, a minimal size based on practical considerations, such as whether an effect can realistically be replicated in a basic research lab, or whether a psychological intervention “meaningfully changes something in the world” (Silan, 2019, p. 2).
Typical-Effect-Size Approaches
Because of arguments that Cohen’s sizing standards are arbitrary and inconsistent, which we have just reviewed, an evidence-based approach to effect sizes in research looks appealing. Indeed, benchmarking studies drawing on published results in various areas of behavioral science tend to yield estimates for the central tendency of effect sizes that are smaller than Cohen’s impressionistic “medium” (Bosco et al., 2015; Funder & Ozer, 2019; Richard et al., 2003). These benchmarks have often been proposed as replacements for Cohen’s criteria. However, before we too hastily substitute one heuristic for another, it would make sense to step back and consider the limitations of literature-based benchmarks.
In social and personality psychology, we sometimes see meta-analytic aggregations of study results across many different methods, and even many different topics (e.g., Richard et al., 2003 for social-personality psychology; Gignac & Szodorai, 2016, for personality psychology). Richard et al. (2003), for example, yield an average r of .23 across meta-analyses in social-personality psychology, but different topics yield average effect sizes ranging from near-zero to r = .70. Schäfer and Schwarz (2019) more recently have also found great heterogeneity in the effect sizes of published psychological research. Average effect sizes calculated from a collection of meta-analyses might thus depend critically and arbitrarily on the prevalence of certain kinds of research in their samples. However, it is doubtful that they represent an abstracted, tightly defined size that most research projects should expect to attain.
Method issues, too, are vital when interpreting effect sizes. Effect sizes can be difficult to compare across different models, manipulations, and measures if they even can be sensibly compared (Pek & Flora, 2018). An intervention that combines many different effective mechanisms (e.g., a mood manipulation that uses happy music, bright colors, and a comedy sketch video) may be conceptually imprecise, but it will give stronger effects than an intervention that tests one isolated mechanism. Statistically, effect size interpretation depends critically on the design and model used, so a raw beta coefficient of .20 in a bivariate model (equivalent to r = .20) represents something different than a beta coefficient of .20 in a model with four other intercorrelated predictors.
As an example of the importance of methodological choices, consider methods of manipulating interracial threats within social psychology experiments. At the subtle end of the spectrum, one can manipulate minimal features of vignettes, such as information about the year when the United States is expected to become a “majority-minority” nation (Craig & Richeson, 2014). That manipulation should produce a smaller effect size, all else equal, than a more vivid procedure in which, for example, White and Black men are paired to chat about racial profiling (Goff et al., 2008).
The design of a study, which is one aspect of method, also counts when estimating likely interaction effects based on literature for which only a main or simple effect is known. Even though interactions are statistically independent of main effects, the size of interactions that are built from a previously known effect as one of their simple effects can be estimated. Unless the interaction is a perfect cross-over (e.g., a complete reversal of the original effect in a new condition), its size will be a fraction of the original simple effect; closer to one half if the new condition completely eliminates the effect, or less if the new condition merely attenuates it (Giner-Sorolla, 2018; Simonsohn, 2015; Westfall, 2015). Blake and Gangestad (2020) present further simulations and guidelines supporting these observations. Also, the unreliability of continuous moderators obtained outside experimental control means that interaction effect sizes should be expected to be low (McClelland & Judd, 1993).
Low reliability of measures also attenuates effect sizes. In one example, reducing the reliability of a measure from .90 to .70 reduces the power for a repeated-measures t-test from over .99 to under .70 (Heo et al., 2015). This is equivalent to effectively halving the effect size detectable (from d = .67 to d = .33) if power is held constant at .80. Investing in steps to tighten construct measurement thus promises to pay dividends in statistical power, if it is done with regard for validity; for example, taking care that dropping items to increase reliability does not reduce construct coverage and thus reduce effect size (Cattell & Tsujioka, 1964).
The research literature drawn on when anticipating an effect size, then, should match as closely as possible the topic, statistical question, and method of the proposed study. Direct replication studies are most likely to achieve this match. Beyond replication, emerging meta-analytic tools such as the Cooperation Databank (Spadaro et al., 2022) and the MetaBUS database (Bosco et al., 2020) can be used to gain precise, up-to-date, and methods-sensitive estimates of effect sizes based on research literature, selecting for topic and methods specificity. Data from meta-analyses can also be drawn upon to derive distributions of effect sizes for input into power analyses and modeling uncertainty (Du & Wang, 2016).
No matter how tightly matched the research, however, effect sizes derived from the published literature are overestimated if nonsignificant results have difficulty being published (Dickersin, 1990; Friese & Frankenbach, 2020). Simply put, in a world where only large effects can be significant (as when the test has a high power level only for large effect sizes), then all significant effects will be large. This situation can help explain, among other things, why studies with smaller sample sizes are less likely to show significant independent replication compared with those having larger sample sizes (e.g., Open Science Collaboration, 2015). A useful simulation of the underlying process is provided by Pek et al. (2020), while Schäfer and Schwarz (2019) show relative inflation of effect sizes among non-preregistered compared with preregistered published studies in psychology, possibly due to publication bias.
Because publication bias can be assumed in most topics of psychology, some authors have proposed adjusting downward any effect sizes taken from published literature or otherwise treating them with skepticism (S. F. Anderson et al., 2017; McShane et al., 2016; Perugini et al., 2014; Simonsohn et al., 2014). Bias correction generally involves adjusting an observed distribution of published effect sizes, accounting for publication bias (e.g., a cutoff of p < .05 to be published) by modeling, in various ways, the body of results that did not meet the cutoff and therefore did not get published. Although these techniques only work well when their assumptions are met (N. A. Lewis & Michalak, 2019), it is vital to consider them because published effect sizes from biased literature will not reflect what a researcher starting their own study might find.
Unfortunately, currently available methods of correcting meta-analytic effect sizes for publication bias are complex and may still not be as effective as hoped. Sladekova et al. (2023) reanalyzed many meta-analytic databases using publication-bias-correction methods but found little change from the original unadjusted average effect sizes. Sladekova and colleagues argued that “although the effect size attenuation we found tended to be minimal, this should not be taken as an indication of low levels of publication bias in psychology” (p. 664). Inzlicht et al. (2015) simulated a variety of bias-correction techniques in a situation where heterogeneous effects are subject to publication bias and found little consistency among the results of techniques as well as an overall range of estimates that did little to resolve questions about the true state of the simulated literature in question.
If prior literature is biased or nonexistent, experimenters may want to take matters into their own hands and carry out pilot tests with a descriptive goal: to capture effect sizes. Pilot testing can be valuable in understanding how design choices affect the potency of the psychological experience produced, with implications for effect sizes in the envisioned study. For example, if one is interested in studying cross-race interactions, one could conduct a pilot study to determine whether participants react more strongly to having a face-to-face conversation about race (e.g., Goff et al., 2008) than to read a vignette about changing racial demographics (e.g., Craig & Richeson, 2014), with the intent of maximizing effect size through the final choice of method. However, this method can overestimate effects as well because pilot tests are also selected: We only follow-up on the ones whose results seem promising (Albers & Lakens, 2018). To compare different paradigms for strength, rather than to generate an absolute value, is thus a preferable use of pilots. All the same, uncertainty also surrounds the estimates taken from pilot testing, so firm decisions are best taken on a finding of statistically significant differences between two pilot tests, which may be difficult to achieve if the participant numbers put into pilot testing are relatively low. Essentially, pilot testing can be seen as a home-grown source of estimates, one which can exactly match the topic and methodology of the proposed study, but is subject to similar biases as consulting the prior literature.
Minimal-Effect-Size Approaches
The limitations of benchmarking according to the typical effect size might lead researchers to instead benchmark from the smallest effect size of interest as recommended by Lakens, Scheel, et al. (2018; see also Lakens, 2022). The interest in such criteria arises because no sample or population is likely to show that one variable is completely mathematically unrelated to another (e.g., a correlation coefficient of zero to 20+ decimal places). And yet psychologists would like to know at what point they can declare that two things are for all practical purposes unrelated. Are there ways to determine a minimum effect size of interest—a parameter that can be entered to evaluate whether a proposed or achieved sample size can decisively tell us if a meaningful directional effect exists?
In most social-personality psychology research, it is difficult to gauge the smallest effect size of interest in a way that can be agreed upon. The issue is clouded by purported instances of very small-looking effect sizes corresponding to sizable real-world impacts, as when Rosenthal (1990) identified an aspirin intervention that reduced heart-attack risks considerably as having an effect size of r = .03. But such examples are flawed because they include large numbers of participants who are irrelevant to the hypotheses, due to heart attacks being a very low-occurrence event. Calculating how well the treatment prevents heart attacks, but only considering those people who would be in line to suffer them in the first place, gives a much larger effect size, such as r = .52, in the aspirin example (Ferguson, 2009). This example and similar examples using inappropriate interpretations of 2 × 2 datasets with very uneven outcome numbers interfere with a more reasonable understanding of how an important-looking treatment effect ought to be described in effect size terms.
Other arguments for powering studies to detect small effect sizes are likewise shaky. 4 For example, it has been argued that a very small effect identified in the lab can add up over many repeated exposures, or many individual cases, to a potent real-world effect (Abelson, 1985) or that a small effect identified across the general population can have large effects at the tail ends of the distribution of one variable (Hyde, 1981). But none of these processes occur out of necessity. They rest on assumptions about the additivity of effects over time (as Funder & Ozer, 2019, argue), the transfer of small observed lab effects to large-scale field effects, and the normality of distributions in extreme ranges. Establishing the growth potential of effects from single-instance lab studies would require long-term multiple-exposure interventions (e.g., repeated priming of a concept across a year), large-scale interventions (e.g., across millions of people via mass media), or studies focusing on people at the thin end of a distribution (e.g., incidence of a personality trait among chess grandmasters, presumed extremely high in analytical ability). With all these alterations to design, the small effect could add up to a more considerable effect but also could fail to materialize. The value of small lab-grown effects when translated to a different scale is an empirical question, not an assumption.
If we define a useful finding as an effect size with a tight confidence limit around it, then it is difficult to insist on any smallest effect size of interest. That is, if the goal is to know the direction and size of any effect, it is just as good to know about the finding r = .03, ±.01 as to know about r = .53, ±.01. The theoretical demands for the smallest effect size come not from a science with point-estimation goals but from the framing of psychological hypotheses in a “weak” sense: stating only the positive or negative direction of a relationship, but without a theory-grounded prior estimate of how large it should be (Meehl, 1990). Merely directional hypotheses are nearly impossible to falsify empirically based on nonsignificant findings because it can always be argued that the population effect still points in that direction, but the findings just did not have enough power to detect it. Indeed, most theories in social-personality psychology do not make “strong” predictions that include an effect size (Klein, 2022; Lykken, 1968).
Others have attempted to calibrate effect sizes empirically by appealing to the size of psychological effects visible to the “naked eye” of research participants or observers (e.g., Anvari & Lakens, 2021; Ozer, 1993). To be sure, knowing these sizes is useful for understanding the phenomenology of effects, but they do not guard against the possibility that a meaningful effect on behavior can occur without the subject or casual observers being aware of it. This possibility is a cornerstone of many fields of psychological research, in particular social cognition (Nisbett & Wilson, 1977). If an effect exists below the threshold of observation, but has further consequences, basic science still has an interest in establishing its magnitude and direction.
Practical-Effect-Size Approaches
We argue for a change in focus. When there is little prior guidance for what size of effect to expect in a specific topic and methodology, the target should not be the smallest effect size of “interest,” because any effect size can be of interest to establish—even one close to zero. Nor should it be a typical effect size because of the many difficulties in establishing and generalizing such a parameter from a heterogeneous existing literature. Rather, benchmarks should target an effect size that is “practically meaningful.”
This phrase can be interpreted in two ways. First, to the extent that findings can be applied directly to a problem with a cost-benefit structure, it should be possible to approximate the cost-benefit tradeoff that would be useful for the problem—the minimum applied practical effect size. For example, if making a change that costs US$1,000 in employee time and resources annually would increase donations to a charitable organization, then any percentage increase in donations that would scale to higher than US$1,000 is cost-effective and therefore of interest to establish (for detailed examination of cost-effectiveness and scalability, see Kraft, 2020). Consulting with practitioners, using unstandardized descriptive parameters or other ways of expressing effect sizes that are accessible to non-statisticians (e.g., common language probabilities; Liu et al., 2019) can help researchers to power their analyses (McClelland, 1997). A social psychologist studying education, for instance, can consult users to see whether they see it as worthwhile to invest student time resources (say, 1 hr a week) into a growth mindset exercise that translates into a 0.10 GPA increase in student performance (cf. Yeager et al., 2019), and if so, at what minimal point in GPA improvement the intervention would cease to be seen as worthwhile.
In another example from educational psychology, research has documented that educational interventions should reach at least 60% fidelity for interventions to show their intended effects, but that it is rare for them to be implemented with greater than 80% fidelity (Durlak & DuPre, 2008). Therefore, the “sweet spot” to work toward is an intervention that can be implemented with somewhere between 60% and 80% fidelity, representing the range of effects that can produce a psychologically meaningful change (Durlak & DuPre, 2008; Horowitz et al., 2018; Premachandra & Lewis, 2022). Byrne (2019) further argues for stakeholder involvement in research planning as a way to “identify intervention outcomes that are considered important by stakeholders” (p. 291). Although the three examples Byrne (2019) gives for behavioral diabetes management were largely qualitative (i.e., identifying outcomes that matter to diabetes patients), one can imagine further asking, through sensitive and natural-language means, quantitative questions about how much a given improvement would matter. Psychological measures could take a cue from the concept of the minimally clinically important difference (MCID; Jaeschke et al., 1989), a patient-led measure of symptom relief that has not yet been widely applied to medical research (Brennan et al., 2023). Practically applied sizes will vary greatly with the context (Bakker et al., 2019) and the resources of a given applied setting, a strong argument for the involvement of stakeholders in research.
However, much basic research does not have a directly translatable application. We propose that in these cases, a basic practical effect size can depend on a paradigm’s ability to be replicated, extended, and inspire further research. Effect sizes much smaller than Cohen’s conventional “small” size of r = .10 may in theory be worthwhile to capture. But distinguishing those effects from zero, or effects in the other direction, can require enormous resources. A d = .05 in a two-sample t-test, for example, would require close to 10,000 participants to attain 80% power at two-tailed α = .05. By making sure that effect sizes do not escape the resource limits of a typical research lab or grant in their field while considering the possibility to achieve resource savings through methodological changes such as repeated-measures designs, basic researchers might ensure that other researchers can verify and follow-up their findings. This approach is also suggested by Lakens, Scheel, et al. (2018): “. . . researchers can justify their sample size on the basis of reasonable resource limitations, which are specific to scientific disciplines and research questions . . .” (p. 263). Our only clarification would draw a line between a resource-based practical minimum and the term “smallest effect size of interest.” The small effect size might still be valuable to establish, but the reason it undershoots the minimum is one of practicality, not scientific interest—hence our phrase, “practical effect size.”
We should note two things about the basic practical effect size. First, it is not intended to benchmark a typical effect size that labs must have the resources to achieve. It is an upper, not a lower, limit on resource expenditure. Because labs may split their resources among different lines of research, the basic practical size does not completely define what the typical sample size in a lab will be, although it does caution researchers that studies with lower power to detect it may miss some effects worthy of further study. Second, basing a minimal effect size on the maximum resources to be expected in a discipline is different from simply basing sample size on available resources in one’s own lab, one focus of Lakens’ (2022) recent guidance. If personal resources are the constraint on sample size, then power analysis to determine N through a minimal effect size derived from those resources is hardly necessary. However, either before or after the study, it would be useful to gauge the size of the effect that could be captured via effect-size sensitivity analysis. Lakens’s (2022) consideration of resource limitations in the individual research lab is relevant, and we also discuss how labs without extensive resources can address power concerns in Controversy #3, below.
But there is also a need, field by field, to discuss and establish overall standards. Lakens, Scheel, et al. (2018) suggest that peer reviewers of articles and grants could make such judgments case by case. We also see benefits for openly discussing the issue across an area of research, with the goal of establishing updateable parameters for effect sizes that can be practically replicated (cf. Lakens’ (2022) call for field-wise heuristics). A paradigm that is long, difficult, and lab-bound, for example, might use a practical effect size calibrated to gathering at most 50 participants (perhaps boosted in power by repeated-measures design); while a two-condition design that takes 5 min and can be given to a convenience sample online might use a practical effect size calibrated to 500 participants. Either limit, perhaps, could be determined using a willingness-to-pay survey among researchers interested in building on or replicating the study.
Like its applied effect counterpart, the effect size of basic practical interest will vary according to research paradigms and typical resources, so we are reluctant to suggest a single concrete figure. We acknowledge, too, that the kind of discourse that might lead to more concrete recommendations for both kinds of practical effect sizes has barely begun. The flow of information from basic to applied researchers and from applied research to practitioners tends to be one way (Giner-Sorolla, 2019). Applied practical effect sizes will need to be worked out on a very specific basis due to the differing importance of specific interventions and resources. Seeking general benchmarks would be less useful than working out techniques for surveying practitioners to establish the parameters of cost-effectiveness.
Conversations about what sizes of basic effects might be impractical for future research also need to happen across different fields. Techniques for power analysis assuming budgetary constraint, already developed to some extent in psychometrics (e.g., Marcoulides, 1995), are yet to be formally worked out in social and personality psychology. Effect-size sensitivity analysis can fill in some of the blanks; it suggests, for example, that someone with access to 200 participants per study can detect, with 80% power in a two-sample t-test, d = .40 in a between-participants experiment; someone who can recruit 2,000 participants can detect d = .13 under the same conditions; and a question that engages a worldwide research network putting together 20,000 participants can hope to detect d = .04. It might eventually be decided, for example, that this last level of focus should be reserved for extremely pressing or foundational questions in basic research, while the more moderate levels of expenditure are more appropriate for derivative or peripheral questions. Another source of very small effect sizes that are reliably different from zero might be a meta-analysis of studies in a single paradigm totaling thousands of data points. However, under those conditions, future researchers would be well advised to identify more specific methods and contexts within the meta-analysis that reliably yield higher effect sizes, which can be tested fruitfully with a more reasonable expenditure of resources.
The concept of basic practical effect size recognizes that larger effects are replicable by more labs and end up creating a larger knowledge base than smaller effects do. It does not preclude some questions from being deemed important enough to study at a very large scale, with high power to detect small effects. But although basic research in social-personality psychology is used for its applications, it is also given away to satisfy public curiosity about how the mind works—not just a behavioral technology, but an idea technology (Schwartz, 1997). If we see any effect size as newsworthy no matter how small, we risk giving the wrong impression when the public only sees headlines claiming a link between two constructs or a difference between two groups. Imagine that, on hearing of a scientifically confirmed gender difference between men and women, the average person presumes that men must be “from Mars” and women “from Venus” (or at least 0.8 standard deviations, if not astronomical units, away from each other). Such a belief may grossly exaggerate the actually confirmed difference which may be robust, and significant, but no more than 0.3 standard deviations in size. (For related evidence on overestimation of effects see Hanel & Mehler, 2019.) Until the applied results of a finding are clear, the responsibility of basic research is to communicate the size as well as direction of findings in a way that is understandable to laypeople and to discuss small-sized findings with caution (see Anvari et al., 2023, for discussion of ways to examine the implications of small effects).
Researchers should also explore ways of going beyond Cohen-type effect sizes to convey practical importance to research consumers who lack the foundational statistical training for evaluating effect sizes. As Spurlock (2019) notes, “effect sizes are expressed in technical terms unfamiliar to consumers of research, and further, most effect sizes are expressed in units with no clear real-world application, such as is the case with the correlation coefficient” (p. 624). Researchers and practitioners have come up with more intuitive metrics for conveying real-world importance, such as number needed to treat, defined as the “number of patients who need to be treated with an intervention before one patient benefits from the treatment” (Spurlock, 2019, p. 624). Many recent articles wrestling with the issue of defining practical significance in real-world terms arrive at the conclusion that subjectivity will never be removed from such determinations and that experts in the relevant content field will need to be consulted (e.g., Balkin & Lenz, 2021; Spurlock, 2019).
In bringing up difficulties with both the minimal and typical effect size approaches, we do not wish to elevate one set of difficulties over another. Indeed, both have difficult and variable solutions. Minimal sizes need to be benchmarked against their resource implications, whether for following through with basic research or for implementing applied research. Typical sizes need to be assessed carefully for accuracy, keeping in mind the similarity in method as well as in hypothesis between the existing and proposed research. A target size averaged from literature can be better than nothing, but a more contextually sensitive size is bound to be even better than that.
We conclude our discussion of effect size by listing four considerations researchers can use to determine which effect size to use in their power analyses. We start from a situation of maximum information about the typical effect size in the experimental paradigm and move to techniques that can be used when little is known about the effect under investigation.
The best option is to work from an accurately estimated literature. This is a literature that focuses on a single topic studied with highly similar and comparable methods, usually a single paradigm and outcome. Although finding accurate literature retrospectively may be difficult in the present moment, they can be recognized going forward by their use of results-neutral formats, such as Registered Reports or multistudy papers that affirm to be a complete account of the lab’s research using that paradigm. Such precedents are best used if the purpose of new research is to test the original effect in a new situation—for example, when removing a potential confound, moving to a different culture, or adding a new contextual factor. However, if the focus is on a novel moderation effect, the size of that effect is likely to be less than the original basis for one of its simple effects, so prior estimates usually should be revised downward, sometimes drastically.
Empirically determining an anticipated effect size from a biased precedent, which may draw on previous results, requires a set of studies with a comparable topic and methodology, but also a valid method for correcting bias in the estimate, which at present seems to be hard to achieve. Aggregations of effect sizes without a comparable methodology are also common but are likely to be even less accurate as a precedent for a given anticipated effect. Internal pilot testing as a source of precedent also has enough problems with accuracy and bias that it can only be recommended as a means to make relative decisions about, for example, the strength of different manipulations.
While they are rare in social-personality psychology, strong theories, or theories that yield effect size predictions, can be helpful if they exist (Navarro, 2019; Rohrer, 2018).
- Finally, for researchers who find no relevant prior literature or theory firmly establishing an effect size for what they want to study, we advocate considering the practical effect size for basic and applied research.
- A case for basic practical effect size can be made by assuming a maximal level of resources typically available for studying the question, aiming to calibrate a minimum effect size that most basic researchers can build on.
- A case for applied practical effect size is ideally made after consultation with practitioners. It can focus either on a cost-benefit analysis or on a pragmatic estimate of the lowest size of the outcome, in raw units, that would be meaningful.
Controversy #2: Is Power Useful After the Completion of a Study?
Some methodologists and statisticians have emphasized that power is only relevant before data are collected (see Levine & Ensom, 2001; Senn, 2002; Zhang et al., 2019). Similarly, Wilkinson and Task Force on Statistical Inference, American Psychological Association, Science Directorate (1999) state that “Once the study is analyzed, confidence intervals replace calculated power in describing results” (p. 596). We agree that, strictly speaking, the probabilistic process that determines power no longer applies after data is collected. However, power analysis and related tools can be useful for understanding and evaluating studies after their completion, particularly when a priori power analyses are not reported for the study. Complicating matters, the term “post-hoc power analysis” is often applied to a specific kind of analysis that is not useful: using the observed effect size from a sample to evaluate the same sample. Acceptable and unacceptable uses of power analysis for post hoc evaluation are discussed in this section.
Avoid Power Determination Using the Observed Effect Size
Within power-determination analyses (ones that output a test’s power), a common misstep is to input all parameters based on those observed in the sample (i.e., sample size and effect size). Proponents of this kind of analysis argue that for nonsignificant results, it provides useful information about the need for replication (e.g., Onwuegbuzie & Leech, 2004). This practice is also encouraged by the popular software package SPSS, which provides entirely sample-based power estimates (called “observed power”) as an option for many analyses (IBM Corp., 2017) suggesting to users that this kind of power determination must be useful. Reviewers also sometimes request “observed power,” particularly when effects are nonsignificant. After such requests, authors have an incentive to follow them, even if they know better.
In truth, it is incorrect to use the sample’s observed effect size to determine the power of that analysis (Cohen, 1988; Gelman, 2019). In that case, the output power estimate is a monotonic function of the p value calculated in the sample (see (Goodman & Berlin, 1994; Lenth, 2001, 2007), so no new information is gained from calculating power using the observed effect size if the p value is already known. When the p value is nonsignificant, observed-effect-size power is usually close to the unimpressive figure of 50% (with exceptions for F tests with high denominator degrees of freedom), but when results are strongly significant, it will reach 90% or higher (Hoenig & Heisey, 2001; Lenth, 2007; Nakagawa & Foster, 2004). However, the low information value of this specific practice should not be over-generalized to more useful practices by calling it simply “post-hoc power analysis.” This label unjustly maligns all forms of power-determination analysis that can be done after data are collected.
Observed Power and p Values in Plausibility Determination
There is also one case in which observed power based on data can be useful, compatible with the insight that this statistic is another way to express a p value. Because previous editorial practices have discouraged authors from submitting nonsignificant studies in a multistudy article, it has been observed that some articles whose studies all yield significant results are very unlikely to be a complete report of a research program (Schimmack, 2012). That is, if each study in a seven-study paper has some chance of obtaining a nonsignificant finding in its hypothesis-confirming test, given its observed effect size, what are the odds that all of seven straightforwardly analyzed and reported studies would be significant, and are these odds credible across a paper or a larger literature? To this end, it has been suggested that post hoc power for each key test using the observed effect size can be calculated and then combined to estimate just how much of a stroke of luck the all-significant article is. At some point, it should be possible to observe that an unbroken series of positive results from studies, given their power to capture a plausible effect size, is implausible. Such a series would suggest, if not definitively prove, some kind of selective reporting at work.
Numerous published analyses have attempted to test the credibility of published multistudy articles or even literature, using one of the specific methods developed for these purposes: for example, p-curve (Simonsohn et al., 2014) or Z-curve (Bartoš & Schimmack, 2022; Brunner & Schimmack, 2020). Using a precursor to these methods, an analysis of Bem’s (2011) controversial paper on precognition, for example, found the joint product of the observed power for a set of 10 studies yielding 19 tests to be <.001. Although among these studies, only 14 tests produced significant results, this figure still suggested an unlikely outcome for a world where the reported analyses represented all planned studies and analyses (Schimmack, 2012, pp. 558–559). The more likely explanation, later confirmed through interviews with those involved in the project, is that the research program involved many unreported studies, and many options to choose which analysis was declared consequential for the hypotheses (Engber, 2017). However, the plausibility of findings can also be assessed by testing how likely it is for a set of significant p values to arise from null versus alternative distributions (e.g., Gronau et al., 2017; Simonsohn et al., 2014).
The application of these methods has itself come under criticism, most strongly by Pek et al. (2022). Apart from definitional objections to calculating power post hoc, they also bring up cautions about the theoretical assumptions of power analysis that are likely to be violated by properties of aggregated actual studies. These include nonindependence of observations, heterogeneity of population characteristics, and heterogeneity of sample size. These assumptions render diagnostic analyses based on observed statistical power imprecise, and “at best, exploratory” (p. 261). Although Brunner and Schimmack (2020) assess the accuracy of different post hoc analytic methods under conditions of effect and sample size heterogeneity, this assessment is unlikely to allay Pek et al.’s, more broadly based doubts completely. However, there remains a compelling logic to the idea that some sets of studies with a dearth of negative results look unlikely as complete reports, regardless of whether statistical power is the best concept to use in testing it.
Power and the Evaluation of Significant Effects
In addition to reducing the likelihood of negative results, having good power before the study is conducted also improves the robustness of the eventual positive results (Szucs & Ioannidis, 2017). In a world where power to detect true effects is low, then any given positive result is less likely to be a true positive, and thus relatively more likely to be a false positive. Some people may intuitively admire a “heroic” significant effect found in an analysis with relatively low power, thinking that the effect must be inherently strong to emerge as significant under such difficult conditions. However, this evaluation is wrong (Loken & Gelman, 2017). Low power decreases, rather than increases, the credibility of a significant effect.
For example, assume that out of 100 effects, 30 are true in the population. If the power to detect a reasonable effect size across all studies is extremely low (e.g., 12%), then 3.6 true positives are expected. However, 3.5 false positives are also expected, so nearly half of all significant effects are not true in the population (Szucs & Ioannidis, 2017). At a power of 80%, 24 true positives are found versus 3.5 false positives, meaning we can be much more confident that any observed significant effect is true. 5 In this example, increasing the power from 12% to 80% is assumed to be achieved by increasing sample size, not by increasing the effect size of the alternative hypothesis, which as Mayo (2019) notes, would also have to increase the alpha criterion or else result in an internally incompatible model. Thus, having high power to detect an effect of interest is important in controlling the field-wide dissemination of false positive results as well as controlling study-level false-negative rates.
To further understand how power carries implications for the value of observed p values, one must understand what error rates do—and do not—say about research. If α = .05, many researchers and educators make the fallacious assumption that there is only a 5% risk of a false positive (for evidence see, e.g., Hubbard et al., 2011). Setting α to .05 does indeed allow only 5% of null effects to appear significant. However, it does not lead to the converse inference that 5% of all observed significant effects correspond to a null effect, any more than knowing that 95% of all dogs are pets entails that 95% of all pets are dogs. Researchers may wish to know the percentage of all observed significant results that are false positives, known as the false discovery rate (FDR; Ioannidis, 2005) or false-positive risk (FPR; Colquhoun, 2019), aiming to restrict this risk to 5% or some other low number (e.g., Colquhoun, 2019).
Using reasoning based on signal detection theory, as in the previous example about higher- and lower-powered studies, the FPR depends on the frequency of false positives (determined by α) and true positives (determined by power), as well as the odds of the effect being true in the population (prior odds). High power to detect a given effect size means the FPR is closer to an acceptable number. For example, in a test with a very low power of 10% to detect the population effect size, and uninformed prior odds of 1:1, the FPR is 33%, whereas an identical test with power of 80% has FPR of 5.9%, which is closer to the naive assumption that the FPR equals the conventional alpha value of 5%. A middling power of 40% leads to an FPR of 11.1%, meaning that the α level needed to reach the same FPR as the test with 80% power would have to be set closer to .025 than to .05. That is, p values close to .05 are particularly untrustworthy in lower-powered tests because they are unlikely to reach the α level required to achieve an intuitively acceptable risk of false positives. (All calculations were facilitated by the online resources at Zehetleitner & Schönbrodt, 2022.)
The contribution of power to false-positive rates should not be exaggerated. As Wegener et al. (2022) point out, power plays a limited role when the prior odds are close to 50% or higher, and increasing power has diminishing returns beyond the power of .50. A similar line of argument about the low importance of power compared with prior odds is taken by Mayo and Morey (2017), who additionally point out that prior odds for any given research question are indeterminate (see also Mayo, 2018). Still, it can be argued that in an ideal world, psychologists would choose research questions with mid-range prior odds: interesting because they are somewhat in doubt but grounded on plausible theory or real-world observations. Indeed, a recent selection of unbiased psychological results reporting via Registered Reports, which are published regardless of findings, suggests something close to 50% prior odds with attrition from less than perfect power (i.e., 44% of main hypotheses were confirmed; Scheel et al., 2021). It cannot be said conclusively that the research questions chosen for Registered Reports are representative of all research questions. Perhaps particularly risky or safe ones are chosen. However, the state of this literature would be a good model for a level of scientific risk going forward, in the absence of strong theories that can make confident predictions about effect sizes.
But given that some literature (including Bem’s (2011) paper) has been built on surprising findings rather than solid theoretical frameworks, lower prior odds are not out of the question. For example, Wilson and Wixted (2018) compared social to cognitive psychology articles within a large-scale replication project of studies published in 2008 (Open Science Collaboration, 2015). They estimated that, along with differences in power, cognitive experiments were likely to have higher prior odds (e.g., 25% assuming 80% power) than social (e.g., 10% even assuming 50% power; with much stronger differences if power is assumed to be equal in the two fields). Given that a recent summary placed the median effect size of 134 social psychology meta-analyses at d = .36 (Lovakov & Agadullina, 2021), pre-2011 studies with n = 20 to 30 per cell must have had power considerably lower than 50% to detect many presumed effects, even without adjusting for publication bias.
We should also keep in mind that concerns about “low-powered” findings often piggyback onto other features of those findings which may be just as important in casting doubt on the findings, if not more, as their probabilistic false-positive rate (Mayo & Morey, 2017). For example, an isolated p < .05 result should not be taken as definitive evidence, certainly not by Fisher’s original hypothesis testing guidelines which aimed to establish experimental procedures that would rarely fail to produce a significant result. And if the positive result occurs in a test that had low power to detect a reasonable effect, we might further investigate the selectivity of reporting and analysis that went into producing this result, even more so if multiple low-powered tests yield positive results in a relatively implausible way.
Options for Post Hoc Analysis
In conclusion, for analyses of completed studies where N, alpha, and desired power level are known or assumed, there are two options for meaningful evaluation of the analysis after the fact. First, one might enter the given sample size and desired power into an effect-size sensitivity analysis to determine whether the analysis was powered to detect meaningful effects. The question is how to evaluate the effect size output. We suggest that if analysis at 80% power can only detect effects much larger than those considered typically or practically useful from a basic or applied standpoint (see Controversy #1), then an analysis of more reasonable effect sizes would yield low power, and p values in the .01 to .05 range should be viewed with caution. The 80% power figure is chosen as being an acceptable but not overly restrictive level for power (see Controversy #4); the range for p values comes from our earlier observation that p values close to .05 are particularly untrustworthy in lower-powered tests because they are likely to have FPRs much greater than .05.
Second, one might choose to use power-determination analysis with one of the effect size derivation methods listed previously. The resulting power then can feed into decisions about the robustness of the finding, with special caution applying to power levels under 50%, especially when the hypothesis is deemed to be low probability. We emphasize, however, that the state of uncertainty about population effect sizes, theoretically predicted effect sizes, and prior hypothesis odds in social-personality psychology argues against trying to convert these impressionistic recommendations into hard-and-fast quantified criteria.
Despite having different outputs, both the effect-size sensitivity and power-determination methods, when applied correctly post hoc, require only one empirical parameter from the data (the test’s N). Assuming a fixed alpha, the other two parameters each require some kind of criterion value, with one being fixed at a criterion, and the other being evaluated against a criterion. That is, in effect-size sensitivity, power is fixed (say, at 80% or 90%) and the effect size output has to be evaluated—is this an unrealistically large effect size? Conversely, in properly conducted power determination, the effect size is fixed at some typical or minimal value, and the power of the test is then evaluated against the conventional criteria—is this much lower than the generally accepted 80%? If there is a reason to prefer sensitivity analysis here, it might have to do with the difficulty of deriving an agreed-upon criterion effect size to start with, so it would be better to end with an effect size for further discussion rather than presume an effect size in the first place.
Finally, additional cautions apply to both these methods, when aggregating multiple estimates of power from several studies in published literature. Specifically, the existence of heterogeneity, selection bias, and moderating factors means that accurate modeling is likely to require more sophisticated techniques than simply looking at the average (mean) power (McShane et al., 2020).
Controversy #3: Do Power Criteria Unjustly Disadvantage Some Kinds of Research?
While we have seen that power can be important in evaluating the strength of a study, simply excluding manuscripts deemed to have low power from publication and other forms of dissemination can limit a scientific field in undesirable ways. Because publication is a major metric of hiring, tenure, and promotion, these decisions will also influence scholars’ judgments about whether to pursue a particular type of research in the first place. Here we will address objections to the practice of using the perceived low power of a study’s key analyses as an argument against conducting or accepting it.
A policy of rejecting “low-powered” research could discourage work on hard-to-reach and diverse populations, for whom sample sizes would tend to be lower, as each participant is reached at additional cost and with a potential limit on numbers available. Increasing research power to increase confidence in conclusions is a value we welcome, but research exists in a context of multiple values. If discouraging low-powered research also discourages research focusing on underrepresented groups in society, then this trade-off in values needs to be carefully examined. Outright rejecting low-powered research would also perpetuate the long-standing file drawer problem, an issue that becomes particularly pernicious for groups that are already underrepresented in the literature. This includes underserved groups and ones that are simply more diverse or difficult to study than typical samples from relatively affluent Western citizens (WEIRD populations; Henrich et al., 2010).
Conversely, standards requiring high power to detect reasonable effects are most easily reached through samples such as undergraduate college students or online workers, who can be recruited relatively easily, quickly, and in large numbers. But these samples are simply not appropriate or possible for some research questions and methods. In addition, prioritizing undergraduate samples can systematically exclude scholars from institutions with smaller participant pools, decreasing the diversity of perspectives in our field. Researchers have thus recently turned to crowdsourced participant pools online for data collection (e.g., Buhrmester et al., 2011, 2018; Paolacci & Chandler, 2014; Sassenberg & Ditrich, 2019). However, online samples are not appropriate for some research needs, such as immersive face-to-face social environments or nondigital behavioral outcomes (C. A. Anderson et al., 2019). Well-funded labs are also privileged in the number of online workers they can recruit, assuming an ethical commitment to pay adequate wages for the work.
As an example of the kind of research that strict sample size requirements might disadvantage, consider a researcher interested in prejudice experiences of Asian Americans, who also wants to represent the diversity of backgrounds within this category (East Asian Americans vs. Southeast Asian Americans, for example, Leong & Okazaki, 2009). Doing so could require recruiting enough participants to represent, say, five or six ethnic backgrounds, some of which might be relatively small in numbers or hard to reach. Or consider a researcher who studies intersectional health disparities. While existing literature has shown meaningful population health disparities between people of color and Whites in the United States, researchers are only just beginning to examine how the intersection of multiple identities (Crenshaw, 1989) may exacerbate existing health disparities (e.g., T. T. Lewis & Van Dyke, 2018). Perhaps this researcher is interested in group differences in depression between Whites and people of color in the United States, but additionally in how these ethnic disparities may be exacerbated in elderly populations.
In both cases, conducting research with high power to detect smallish effects would be very difficult. The investigators would need time and resources to ensure the validity of their materials; adequate participant-payment funds; and most likely, longer-term partnerships with people in their communities to locate participants. They would be limited, critically, by the number of reachable participants fitting the target demographics. Furthermore, eligible individuals may not want to participate, for a variety of reasons—time, wariness, or specific concerns about the research process. If intersectional populations are studied as a statistical interaction of categories, effects are likely to be weaker and more variable for a number of reasons (McClelland & Judd, 1993; Simonsohn, 2015). Given these barriers, analyses targeting the kind of effect sizes detectable by larger studies are likely to show low power, despite researchers’ most assiduous efforts. In this case, a rigid decision to reject the work based on conventional power criteria may do more harm than good. It would perpetuate the exclusion from research literature of hard-to-reach populations who are already severely under-represented. A file-drawer problem based on statistical power is still a file-drawer problem.
When planning and conducting research with less accessible populations, researchers need to plan around power issues, to ensure their efforts are productive and lead to reasonable conclusions. They may want to concentrate on larger, rather than smaller, effects—for example, in studies involving a policy or health-related intervention. They can also choose methods for stronger effect size and hence power: for instance, using a more robust vs. subtle experimental manipulation, explicitly justifying a higher alpha level, working to increase measurement reliability, or adopting a within-subjects versus between-subjects design, including diary or other intensive longitudinal methods (Bolger et al., 2012; Finkel et al., 2015).
Some projects may benefit from collaborations pooling together resources and samples from many labs to maximize power (e.g., the Psychological Science Accelerator; Moshontz et al., 2018). Researchers may also choose to share unpublished data through other means than formal publication, remedying distorted perceptions of effect sizes under publication bias and aiding future meta-analyses. That is, instead of encouraging the publication of significant effects and the suppression of nonsignificant ones, a system should encourage the dissemination of all relevant data and their aggregation, while also ensuring appropriate credit for the researchers providing the data, as Lange (2020) describes for research on non-neurotypical populations. The quality control that is supposed to be provided by peer review, however, is still an issue. As has been recommended for meta-analyses (Hohn et al., 2019), users should carefully check the validity and completeness of methods reported in this way, for unpublished articles but also for published ones, as peer review is not a complete guarantee of quality control either. Finally, the inherent difficulties of deriving statistical conclusions from small samples should also lead researchers to consider qualitative approaches (Levitt et al., 2018), or descriptive quantitative research, which some have argued is underappreciated in social-personality psychology (e.g., Rozin, 2001).
When evaluating such research, too, rejection should not be the only option if it lacks power to detect the kind of effect sizes that are common in research with larger samples. Indeed, every test has sufficient power to detect some effects but lacks power to detect others. Editors and reviewers must thus focus on the effects that a study’s key test is adequately powered to detect, weighing the clarity of the finding against the importance of doing research at all in the context. They might join researchers in adopting different thresholds (e.g., a different power criterion, or higher alpha) for reporting research that uses difficult methods or studies difficult-to-reach populations. But critically, if such publications are valued more than publications with standard methods and samples, authors should also be allowed to be more tentative in their conclusions, without having to oversell the findings to get published.
Controversy #4: Should 80% Still Be Considered a Universal Standard for Desired Power?
The 80% power criterion suggested by Cohen (1977, 1988) is now widely used, if not always (Bacchetti, 2010), with its implication that a false positive is four times more important to avoid (5% risk given H0) than a false negative (20% given H1). Cohen (1977) himself, however, was flexible in his original recommendation of 80% power. He urged researchers to determine for themselves the relative costs of the two kinds of errors, clarified that 80% power should be selected only when the researcher has “no other basis” (p. 56) for power to be something different, and even shared his hope that the 80% criterion would be ignored whenever researchers could determine a different level to use based on substantive considerations. Over the decades since Cohen published his recommendations, however, most researchers (to the extent they report power in their articles at all) appear to have defaulted readily to 80%, rather than weighing the issues suggested by Cohen. Should the field de-emphasize 80% power and encourage other approaches?
Arguments for Retaining the 80% Power Criterion
For some statistical tests and effect sizes, the 80% value has been said to mark an inflection point in the trade-off between cost and power (Cumming, 2012). With an independent-groups t test and effect size d = .80 (large), for example, there is a near-linear relationship between sample size and power until power hits .80. That is, a similar percentage increase in sample size is necessary moving from the power of .50 to .60 to .70 to .80. However, moving from .80 to .90 requires a larger increase. Another argument for retaining (at least) an 80% criterion comes from the judgment that “a materially smaller value than .80 would incur too great a risk of Type II error” (Cohen, 1992, p. 156). On the contrary, seeking a power of 90% or above might force researchers to use sample sizes that are prohibitively large. Hence, 80% can be seen as a “Goldilocks” level of power: not too low, not too high, but just right.
Arguments for Abolishing the 80% Power Criterion
Bacchetti (2010) offers three arguments against the 80% power criterion. The first is that “a meaningful boundary between adequate and inadequate sample sizes” does not exist, even approximately (p. 2). Bacchetti asks his readers to imagine a plot of sample size on the horizontal axis and studies’ “projected scientific and/or practical value” on the vertical axis. Projected value can be operationalized in terms of power or various frequentist and Bayesian-based indices. For any of these, Bacchetti contends, the plot of sample size versus projected value is an ordinary concave circular arc, roughly resembling the circumference of a clock between 9:00 and 12:00. He notes further that “This characteristic shape was recently verified for a wide variety of measures of projected value that have been proposed for use in sample size planning, including power” (Bacchetti, 2010, p. 2). Importantly, this curve does not have an elbow inflection bend suggesting that power flattens off at 80% power (or any other power value) with increasing sample size, which Bacchetti characterizes as the “threshold myth.”
Bacchetti’s (2010) two other arguments against an 80% power criterion are that the inputs for calculating power carry considerable uncertainty (e.g., knowing standard deviations for focal variables ahead of time) and that determining power in the name of statistical significance “does not reflect how a completed study’s information should actually be used” (p. 2). On the latter point, those evaluating a study’s contribution will want to know more than whether a result was statistically significant, and meta-analyses will also value studies’ effect sizes more so than p values.
Our Recommendation
We suggest that in psychology, 80% should be a bare minimum, to avoid expanding the false-negative (Type II) error rate beyond 20%. However, in selecting a target power value, we strongly encourage researchers to explicitly weigh the relative costs of false-negative and false-positive (Type I) error rates, considering multiple criteria. There are certainly times when the goal to avoid a false negative is more strongly indicated than usual, arguing for power above 80% (Di Stefano, 2003). For example, many journals accepting Registered Reports, which commit them to publish both negative and positive results, require a power of 90% or greater (Montoya et al., 2021).
In many cases, researchers should be able to identify the costs of each type of error. To use an example from daily life, people awaiting the results of a medical diagnostic test would not be happy if it could only detect a life-changing condition 80% of the time! Accordingly, some medical tests have very low false-negative rates (e.g., some pregnancy tests have only a 1% false-negative rate with others no higher than 5%; Bhandari, 2019; Kleinschmidt et al., 2021). Regardless of the exact approach one uses, however, it is important to justify trade-offs involved in adopting any power criterion, as with any particular value of α (Lakens, Adolfi, et al., 2018). Managing such trade-offs may best be addressed by applying discontinuous criterion power analysis (Holbert et al., 2018), a technique that inputs power, effect size, and sample size to determine whether an α level lower than .05 should be adopted to optimize the tradeoff between type I and type II error in a given study.
Alternatives to Power Analysis
Because our review has focused on power analysis, researchers might assume that using this technique is the only statistically defensible way to plan a sample size. Here, we complete the picture by presenting two alternative methods for sample size planning that do not require a priori effect size estimation: precision analysis and sequential analysis.
Precision Analysis
Sometimes researchers will want to do more than reject the null hypothesis. For example, they may be confident that an effect is not zero and, instead, focus on estimating its size. In situations like these, sample size planning should be based on precision rather than power. Precision in estimation data analysis means that the confidence interval (CI) for the effect size is narrow; the term is formally equivalent to “accuracy” when the parameter estimate is unbiased (Kelley & Maxwell, 2003). The CI gives a range of effect size values around the effect size estimate, usually based on the standard error. A CI produced through the same sampling procedure will contain the population value of the parameter, 95% of the time if the conventional 5% α level is observed, and for other levels (1 − α)% of the time. 6 One advantage of the precision approach is that, for many analyses conducted in psychology, the width of the CI is affected by sample size and confidence level but not by the effect size itself. Assuming normality, a CI becomes narrower as the sample size increases, but wider if the desired confidence level increases, holding constant the effect size at the center. Thus, precision analysis escapes having to deal with the tricky question of what size of effect to expect before research is conducted.
The Accuracy in Parameter Estimation (AIPE) approach can be used with many different statistical tests using analytic (e.g., Maxwell et al., 2008) or Monte Carlo methods (Kelley & Maxwell, 2003), alone or in conjunction with power analysis. Sample size planning with AIPE aims to reach a prespecified width of the CI around a parameter. Because this width varies separately from the size of the effect, a test with conventionally “good” power to detect differences from zero will not necessarily have a narrow CI. Maxwell et al. (2008) provide an example of a test comparing two means with d = 0.50 and a sample size of N = 128 (64 per group), which provides 80% power. However, that sample size results in a predicted 95% CI ranging widely from 0.15 to 0.85. Similarly, a test with a narrow CI but an estimate close to zero may have power far below conventional standards. For example, when comparing two means with d = .05, a sample size of 342 results in a predicted 95% CI of [−0.10, 0.20] but only 9.5% power. Thus, an AIPE analysis can be useful for selecting the appropriate sample size for the desired level of precision, but independently of power.
AIPE also does not completely escape questions of the meaningfulness of its inputs and outputs. It requires deciding when a CI is narrow enough to be desirable, a subjective decision like selecting an effect size or power level in power analysis. Most applications of AIPE use CIs around standardized effect sizes, for example, standardized mean differences, or correlations, for sample size planning. However, determining the optimal CI width of interest can be a difficult task. A researcher should consider factors such as the maturity of the research area and the need for a practically useful range, which may require a look at the CI in terms of raw rather than standardized units. Controversy #1 discusses methods for determining practically meaningful effect sizes, and many of these ideas could be generalized to thinking about AIPE approaches. For example, the consequences of having a too-wide or too-narrow interval for future basic research as well as for practical applications could be examined.
Sequential Analysis/Optional Stopping
Traditionally, a researcher specifies one sample size a priori. However, uncertainty about the population effect size could lead to such a test either being underpowered and missing effects in the population or being overpowered and needlessly exhausting resources. To balance power and feasibility concerns, several optional stopping techniques let researchers make data-dependent changes to their sample size while correcting for an increased FPR. In these designs, participants are collected in “waves.” Between waves, an interim decision is made—whether to continue collecting data or to stop, based on a hypothesis-relevant significance test corrected for multiple testing, and/or the achieved N. On average these designs require fewer participants than fixed N methods (Schnuerch & Erdfelder, 2020). This method, importantly, is not the same as undisclosed optional stopping without controlling for multiple testing, which has been rightly criticized as a practice leading to false positive inflation and low replicability in psychology (Simmons et al., 2011).
One set of sequential methods involves setting a lower and upper bound on p values. A study is run collecting several cases at a time. After each collection, the study is stopped if the observed p value is below the lower bound, or above the upper bound. Otherwise, the collection continues. Several different SSR methods have been developed for different statistical tests and minimum and maximum Ns, including the COAST method (Frick, 1998), the CLAST method (Botella et al., 2006), variable criteria sequential stopping rule (Fitts, 2010a, 2010b), and others (Ximenez & Revuelta, 2007).
Another set of techniques is group sequential analyses. In these designs, researchers set only a lower p value bound and a maximum N and stop the study early if the p value at an interim analysis falls below the boundary. To keep the overall alpha level at the prespecified level, the total alpha is portioned out across the interim analyses, using one of a number of different boundary equations or spending functions (see Lakens, 2014; Lakens & Evers, 2014).
Optional stopping techniques differ from traditional methods in important ways. Optional stopping techniques prioritize inference and hypothesis testing, but may undermine the separate goal of estimation accuracy: sample sizes from studies stopped early will be smaller, and so their effect-size estimation will be less precise. In addition, studies that stop early will show effect-size inflation, because only larger effect sizes will pass the lower significance bounds with the smaller samples of early analyses. There are methods to correct this bias (e.g., Chang, 2011, ch. 1; Cornfield, 1966; Lakens, 2014), and we suggest that researchers report the corrected effect size when using these designs. Another potential downside of some kinds of sequential analyses is that, if their maximum N is reached, they are somewhat less powerful than a traditional design, because their significance criterion is more stringent. This means that the use of optional stopping should be based on the possibility that the effect size might be stronger than expected, giving a reason to stop data collection early.
Summary
Power analysis is an excellent tool, but has a variety of limitations: in particular, reliance on having a meaningful effect size metric in the first place. Precision analysis focuses on the precision of an estimate. It usually does not require researchers to select an effect size, but rather the precision with which they would like to estimate their effect size, although this criterion might perhaps be seen as equally arbitrary. Sequential sampling methods also do not require an effect size estimate but may provide biased size estimates when looking beyond the mere directionality of an effect. Each of these methods presents a promising alternative, optimizing different considerations than sample size-determination power analysis does.
Recommendations for Best Practices
Based on our discussion to this point, we will now set out recommendations for best practices in three areas: planning future research, reporting power analysis in published research, and evaluating existing research based on power.
Planning Future Research
Sample size analyses can play an important part in planning a study. To control the risks of unjustified negative or inconclusive outcomes from research, a priori power analysis has become required in recent decades by many funders, and by ethical bodies charged with determining whether research is worthwhile (Vollmer & Howard, 2010). However, as savvy applicants know, such analyses can deliver seemingly high-powered prospects if a suitably optimistic effect size is used (Maxwell & Kelley, 2011).
Therefore, we recommend that the effect size input to any a priori power analysis be justified in terms of one of the following: (a) estimates from an accurate and unbiased literature specific to the paradigm and question at hand; (b) estimates from biased literature that has been adequately corrected; (c) strong relevant theory; (d) if research addresses basic theoretical questions, basic practical effect size, usually based on the capacity of a typical lab to perform follow-up work to the question; and (e) if research is applied, practical effect size, usually based on the minimum change in raw units that would be cost-effective or otherwise seen as meaningful and useful. The last two considerations should be amended under special circumstances: for example, if a basic question is so central that its exact effect size needs to be established even if small, a larger scale study might be justified. Some of these methods of input estimation can also inform the preferred width of confidence intervals for precision analysis as well as the parameters for techniques based on a distribution of effect sizes. In these methods that rely on a range instead of a point estimate, what range would be useful, with the limits of resources in mind, to inform future basic research, or to justify the costs and benefits of an application?
Pilot testing is also recommended if the goal is to compare the strength of different manipulations. However, it can lead to undesirable biases if an effect size estimate is literally transferred from a less powerful pilot test. Even without directly addressing relative effect sizes through data, a priori analyses can also test the relative power of different designs, such as within- versus between- subjects, more versus less reliable measures, or the number of levels in a proposed manipulation. Researchers are encouraged to experiment with methodological variants of study designs to assess their benefits for any particular study. Again, it is more accurate to speak of relatively higher and lower power rather than absolutely high and low power.
Also, there are multiple tradeoffs in proposing a target a priori power level. Although diminishing returns appear after 80% power, accepting a false-negative possibility as high as 20% may be unpalatable, especially in high-stakes research settings. The most desirable procedure is to explicitly consider the costs of type I error, type II error, and the research itself in justifying a power level (and alpha). For example, researchers doing an exploratory study on a topic of largely academic interest might be able to justify the 20% Type I error rate implied by 80% power, while researchers doing a study that is meant to yield a definitive real-world conclusion with high stakes may settle for no less than 95% power. But if the inputs to this reasoning process are unclear, 90% can be seen as a reasonable compromise.
While the details of how to derive power and sample size calculations for any given test lies beyond the scope of this review, power analysis is a constantly evolving field that may not always keep up with developments in inferential analyses at any one time. Researchers who want to determine sample size for a technique that lacks an associated power analysis algorithm have a few options: develop their own power simulation (perhaps in consultation with a methodologist), fall back on the known power of an analogous or related technique, or incorporate the technique into a sequential data collection method.
Reporting Power Analyses
Current writing guides (e.g., Appelbaum et al., 2018; APA Publication Manual, American Psychological Association, 2020) leave unclear exactly how power should be reported in manuscripts. We offer recommendations here.
In the same way, as the field is coming to terms with the need to accurately report all methodological details and analyses, authors should accurately report reasons for their sample size decisions, including decisions driven by practical considerations rather than statistical ones. Often, the sample size is decided by resource availability, rules of thumb, or emulation of prior sample sizes. In such cases, effect-size sensitivity analysis is the most useful and honest tool (Cohen, 1988). Even when sample size is planned, missing or incomplete responses may reduce the amount of usable data below the original intent, reducing achieved power and also making effect-size sensitivity analysis advisable.
Full and transparent reporting of analyses and data preparation, which is good in and of itself, is also important for the accurate application of power considerations to the published study. An effect-size sensitivity analysis of a study where many outcomes were analyzed, but only significant results reported, cannot be evaluated in the same way as the identical result from a single-analysis study. Other practices that inflate Type I error, such as undisclosed optional stopping, also reduce confidence in the parameters necessary to evaluate power. A statement that all measures, manipulations, and even relevant studies are disclosed can give greater confidence in effect size estimates from research (Simmons et al., 2012). Preregistration and Registered Reports can also help ensure full disclosure of research practices.
As noted earlier, the method is important to power. Even within a single study, power may vary if multiple conclusions are drawn on statistical analyses with different tests, designs, and/or presumed effect sizes. We suggest that researchers consider reporting power analyses (plural) if they have multiple key hypothesis tests, not in the Methods section, but in the Results section close to each type of analysis (following Sleegers, 2019). Even if only one analysis is relied upon, the Participants subsection of Methods should specify which of these analyses, if any, the overall sample size was based on.
If the sample size was decided a priori via power analysis, make sure to report the statistical test the analysis is based on, the effect size (with units, e.g., d, f2), the rationale for choosing an effect size, target power including any justification for using that criterion, and any other parameters used in the power analysis. We also recommend full reporting of parameters and decisions for precision and sequential analysis. Regardless of which method of power analysis is reported, there may be discrepancies between different statistical programs, so the program or package and function used should also be cited. The burden of reporting all parameters is comparable to the burden of full reporting for other statistical analyses, which should be seen as minimal compared with the duty of scientists to make their results as computationally reproducible as possible.
To give a moderately complex example, imagine that an author is reporting a power analysis of a study. The central analysis is a three-group analysis of variance (ANOVA) applied to three dependent variables in separate analyses. Analyses of correlations among the variables, which did not play a part in planning, are nonetheless of interest. The study had a fair amount of attrition (13%) so the final sample size is less than planned. An a priori analysis of the design using G*Power has been conducted. In the Participants section, to justify the choices made, the author writes:
Three hundred and twenty participants were recruited for the study. This figure was based on a priori power analysis that established 320 as the N adequate to achieve a relatively stringent 90% level of power in the main three-group, one-way ANOVA hypothesis test of this design. The analysis used alpha = .05, two-tailed, and an effect size f = .20, based on the bias-corrected d = .41 from a recent meta-analysis of similar effects in the paradigm (citation). However, only 280 participants finished the procedure, and this sample was the basis of our analyses (see further power analyses in Results). For all power analyses we used G*Power 3.1.9.7 (Faul et al., 2009), and for this design we used the “ANOVA, fixed effects, special” procedure.
In the Results section, the author gives power information about the actual final sample in the place where the ANOVAs are reported, using post hoc analysis (but not with the observed effect size!) to gauge the effect of the attrition.
To judge the adequacy of the new ANOVAs after participant attrition, we conducted a post-hoc analysis with the relevant parameters from the a priori analyses, including the target effect size f = .20, but entering the actual N of 280. This showed a power of 85.5% to detect the target effect size, which is still above the conventional 80% level, even if not as stringent as originally planned.
Finally, a different section of Results reports unplanned analyses looking at correlation patterns among the three dependent variables. The power of these is reported with a sensitivity analysis giving effect size as output because the author feels they have little basis to justify anticipating any one size of correlation.
This analysis with N = 280 had sensitivity power, at a 90% level and alpha .05, two-tailed, to detect a Pearson correlation as low as r = .19 with G*Power’s “exact: correlation, bivariate” procedure.
Journal guidelines, too, should encourage good practice. They should be as specific as possible about what kind of power analysis is needed in a report for their readers to evaluate the research and results. They should not simply require a few words about power, because to fulfill such a vague requirement, authors may rely on unrealistic or arbitrary input parameters.
Using Power in Evaluating Reported Research
Evaluating the sample size of reported research has become commonplace in the past 10 years. In social and personality psychology, many journals and conferences have increased their commitment to foregrounding issues of power, although sometimes by such indirect methods as requiring a report of sample size in abstracts or presentation submissions. However, larger sample sizes must be weighed against other factors in evaluating research, including the use of resources to attain those sizes and the statistical strength of conclusions.
Research should ideally be evaluated based on a calculation of statistical power or effect-size sensitivity, not on the heuristic basis of sample size or any other single component of power. Using sample size as a heuristic disadvantages efficient designs (e.g., repeated-measures) and obscures the role of expected or desirable effect sizes.
Discussions of achieved power should be anchored in a concrete effect size that is justified in one of the recommended ways (Controversy #1, effect size). A study’s main test may undoubtedly have relatively higher or lower power than another, but if a study is characterized as having “good,” “high,” “poor,” etc. power, the effect size assumption underlying this evaluation, as well as which test(s) are meant, should be made explicit. Alternatively, a sensitivity power analysis can be conducted, and the minimum effect size that it gives can be judged based on how realistic or useful it is. Even if there is no relevant unbiased literature or theory, we still might call a study’s power into question if its key test can only detect effects much stronger than even a biased estimate from published research or pilot tests would suggest.
All data are potentially useful in aggregation, so data sets should not be suppressed merely for having low power, provided that a commitment is made to report their results regardless of significance. If data are by themselves deemed too inconclusive for publication, other means of dissemination should be explored, with an eye toward making them available to meta-analyses.
When power is much lower than 80% to detect an effect size that would be of practical interest, inferences from conventionally significant results (especially those close to the α criterion) should be made with greater caution, because of the elevated chance that significant results are false positives.
Sample sizes arrived at through methods other than a priori power analysis, such as precision analysis or sequential analysis, can be evaluated according to the appropriateness of the criteria central to those analyses. Specifically, the width of precision should be evaluated for its utility in fixing an effect size, while the parameters of sequential analysis including stopping rules should also be calibrated against the criteria for determining effect size.
Conclusion
Within psychology, there has been increased recognition over the years of statistical power and related considerations such as effect size or precision). Determining statistical power can be daunting, however, due to its statistical and mathematical complexity and the multitude of different approaches, depending on one’s research design and statistical test. Most researchers might be content to draw conclusions from ready-made algorithms. However, more accurate analyses for regularly used techniques may benefit from using simulation approaches, as well as from considering variability in methods, inputs, and outputs rather than simply looking at single-number results. Simulation may also be the only option available to analyze innovative techniques which have not yet seen the development of power algorithms, or which may indeed be unsuitable for an algorithmic approach.
If there is one take-home message, it is that issues of power depend crucially on questions of meaningful effect size, which many disciplines in psychology have avoided tackling in their theory or methodology. The approximate nature of effect size criteria should be a caution against applying overly rigid “bright lines” to power statistics, and against repeating the statistical mistake that has treated p values as rigid, live-or-die criteria of evidence (Wasserstein & Lazar, 2016). In emphasizing the essential role of effect size in power analysis, we challenge researchers and reviewers to reframe their evaluations of pending or completed research. Instead of asking “does this study have enough power?” we should ask “What effects does this study’s key test have acceptable power to detect—and what does that mean?”
Supplemental Material
Supplemental material, sj-docx-1-psr-10.1177_10888683241228328 for Power to Detect What? Considerations for Planning and Evaluating Sample Size by Roger Giner-Sorolla, Amanda K. Montoya, Alan Reifman, Tom Carpenter, Neil A. Lewis, Christopher L. Aberson, Dries H. Bostyn, Beverly G. Conrique, Brandon W. Ng, Alexander M. Schoemann and Courtney Soderberg in Personality and Social Psychology Review
Although the choice of α is increasingly seen as an analytic choice (Lakens, Adolfi, et al., 2018) with an argument to be made for values below .05 (e.g., Benjamin et al., 2018; Nosek et al., 2018), we assume α = .05 throughout most of this paper because it remains the most commonly applied criterion.
Researchers can improve power by committing to a one-tailed test, although this requires they only make inferences about effects in the predicted direction. The particular case of preregistered confirmatory analysis is an excellent application of one-tailed testing (Nosek et al., 2018). Arguments also exist for adopting a more stringent criterion α (e.g., .005; Benjamin et al., 2018).
Although similar phrases including “small [-sized] effect” are quite common (1,517), many of these are observations that a study had very low power to detect a small effect, rather than justifications of the sample size actually used. To probe further the nature of authors’ use of common effect-size benchmarks, we collected a random sample of 50 articles identified on Google Scholar as containing the phrase “detect a medium effect” and published between January 1, 2021 and June 29, 2023. Forty-one articles could readily be classified as either (a) assuming a medium effect-size to inform an a priori, power-driven determination of sample size or (b) determining sample size through other considerations (e.g., number of participants available) and then commenting after the fact on the power implications of their sample or on other power-related issues. Of these 41 articles, 25 (61%) used a power analysis to inform an a priori sample-size determination, with the term “medium” used to justify the specification of a quantitative effect size. The other 16 (39%) determined sample sizes in other ways and used the term “medium” uncritically to describe the power afforded by their samples. Among articles alluding to medium effect sizes, therefore, most appeared to use the labels as a primary benchmark in power-focused discussion of the sample size either before or after data collection. Nine articles did not fit this framework: four were unclear, in our view, whether power calculation occurred before or after the sample size was known; three were proposals rather than completed studies, so we could not know if or how sampling and data collection were successfully completed; and two were methodological or simulation articles. Our list of 50 articles, including details on how they were sampled, our codings, and key quotations on their use of effect sizes, is available via OSF:
Prentice and Miller (1992) are sometimes cited in support of small effects. However, despite the title of the article, their argument is not actually about small effect sizes, but about nonobvious paradigms that would have value in testing theory even if the effects were small. Most of their examples, in fact, yield conventionally “medium” or “large” effects when analyzed (e.g., the key effect on helping in Study 1 of Isen and Levin (1972), had d = .55; the key mere exposure interaction in Wilson (1979), Study 1 had partial η2 = .39; Study 1 in Tajfel et al. (1971) had ingroup favoritism effects which, although not completely reported, must be d = 1.5 or greater).
To explain these figures, in the lower-power example, 30 × power of 12% gives 3.6, the number of true results that are accurately declared significant; 70 × alpha of 5% gives 3.5, the number of false results that are wrongly declared significant. In the higher-power example, 30 × power of 80% gives 24 true results accurately declared significant, and 70 × alpha of 5% gives the same number of false positives, 3.5.
Defining confidence intervals and characterizing researchers’ understanding of them are complex matters. Hoekstra et al. (2014) quizzed a large sample of undergraduate, master’s, and PhD psychology students and psychology faculty members on six items purporting to test understanding of CIs. Large majorities—even of the PhD students and faculty—answered half or more of the items incorrectly, a performance Hoekstra and colleagues found indicative of a “gross misunderstanding” of CIs. Miller and Ulrich (2016) published a rejoinder, however, arguing that Hoekstra et al.’s criteria for correctness on the items were narrow and technical and likely understated psychologists’ knowledge of CI’s. For example, according to Miller and Ulrich, one statement that Hoekstra et al. considered wrong, “is essentially the standard interpretation of CIs recommended by authoritative statistics texts” (p. 125).
Footnotes
The author(s) declared no potential conflicts of interest with respect to the research, authorship, and/or publication of this article.
Funding: The author(s) received no financial support for the research, authorship, and/or publication of this article.
ORCID iD: Neil A. Lewis  https://orcid.org/0000-0001-7912-1689
Supplemental Material: Supplemental material for this article is available online.
References
- Abelson R. P. (1985). A variance explanation paradox: When a little is a lot. Psychological Bulletin, 97, 129–133. 10.1037/0033-2909.97.1.129 [DOI] [Google Scholar]
- Aberson C., Bostyn D. H., Carpenter T., Conrique B. G., Giner-Sorolla R., Lewis N. A., Jr., . . . Soderberg C. (2023). Techniques and solutions for sample size determination in psychology: A critical review. https://osf.io/gcb4d
- Albers C., Lakens D. (2018). When power analyses based on pilot data are biased: Inaccurate effect size estimators and follow-up bias. Journal of Experimental Social Psychology, 74, 187–195. 10.1016/j.jesp.2017.09.004 [DOI] [Google Scholar]
- American Psychological Association. (2020). Publication manual of the American Psychological Association (7th ed.). [Google Scholar]
- American Psychological Association. (2022). Journal of Personality and Social Psychology. https://www.apa.org/pubs/journals/psp
- Anderson C. A., Allen J. J., Plante C., Quigley-McBride A., Lovett A., Rokkum J. N. (2019). The MTurkification of social and personality psychology. Personality and Social Psychology Bulletin, 45, 842–850. 10.1177/0146167218798 [DOI] [PubMed] [Google Scholar]
- Anderson S. F., Kelley K., Maxwell S. E. (2017). Sample-size planning for more accurate statistical power: A method adjusting sample effect sizes for publication bias and uncertainty. Psychological Science, 28, 1547–1562. 10.1177/0956797617723724 [DOI] [PubMed] [Google Scholar]
- Anvari F., Kievit R., Lakens D., Pennington C. R., Przybylski A. K., Tiokhin L., . . . Orben A. (2023). Not all effects are indispensable: Psychological science requires verifiable lines of reasoning for whether an effect matters. Perspectives on Psychological Science, 18(2), 503–507. 10.1177/17456916221091565 [DOI] [PubMed] [Google Scholar]
- Anvari F., Lakens D. (2021). Using anchor-based methods to determine the smallest effect size of interest. Journal of Experimental Social Psychology, 96, 104–159. 10.1016/j.jesp.2021.104159 [DOI] [Google Scholar]
- Appelbaum M., Cooper H., Kline R. B., Mayo-Wilson E., Nezu A. M., Rao S. M. (2018). Journal article reporting standards for quantitative research in psychology: The APA Publications and Communications Board Task Force report. American Psychologist, 73, 3–25. 10.1037/amp0000191 [DOI] [PubMed] [Google Scholar]
- Bacchetti P. (2010). Current sample size conventions: Flaws, harms, and alternatives. BMC Medicine, 8, 1–7. 10.1186/1741-7015-8-17 [DOI] [PMC free article] [PubMed] [Google Scholar]
- Baguley T. (2009). Standardized or simple effect size: What should be reported? British Journal of Psychology, 100(3), 603–617. 10.1348/000712608X377117 [DOI] [PubMed] [Google Scholar]
- Bakker A., Cai J., English L., Kaiser G., Mesa V., Van Dooren W. (2019). Beyond small, medium, or large: Points of consideration when interpreting effect sizes. Educational Studies in Mathematics, 102, 1–8. 10.1007/s10649-019-09908-4 [DOI] [Google Scholar]
- Balkin R. S., Lenz A. S. (2021). Contemporary issues in reporting statistical, practical, and clinical significance in counseling research. Journal of Counseling & Development, 99, 227–237. 10.1002/jcad.12370 [DOI] [Google Scholar]
- Bartoš F., Schimmack U. (2022). Z-curve 2.0: Estimating replication rates and discovery rates. Meta-Psychology, 6. 10.15626/MP.2021.2720 [DOI] [Google Scholar]
- Bem D. J. (2011). Feeling the future: Experimental evidence for anomalous retroactive influences on cognition and affect. Journal of Personality and Social Psychology, 100, 407–425. 10.1037/a0021524 [DOI] [PubMed] [Google Scholar]
- Benjamin D. J., Berger J. O., Johannesson M., Nosek B. A., Wagenmakers E.-J., Berk R., . . . Johnson V. E. (2018). Redefine statistical significance. Nature Human Behaviour, 2, 6–10. 10.1038/s41562-017-0189-z [DOI] [PubMed] [Google Scholar]
- Bhandari T. (2019, April 18). Flaw in many home pregnancy tests can return false negative results: Test results later in pregnancy may be misleading. Washington University School of Medicine in St. Louis. https://medicine.wustl.edu/news/flaw-in-many-home-pregnancy-tests-can-return-false-negative-results/ [Google Scholar]
- Blake K. R., Gangestad S. (2020). On attenuated interactions, measurement error, and statistical power: Guidelines for social and personality psychologists. Personality and Social Psychology Bulletin, 46, 1702–1711. 10.1177/0146167220913363 [DOI] [PubMed] [Google Scholar]
- Bolger N., Stadler G., Laurenceau J. P. (2012). Power analysis for intensive longitudinal studies. In Mehl M. R., Conner T. S. (Eds.), Handbook of research methods for studying daily life (pp. 285–301). Guilford Press. [Google Scholar]
- Bosco F. A., Aguinis H., Singh K., Field J. G., Pierce C. A. (2015). Correlational effect size benchmarks. Journal of Applied Psychology, 100, 431–449. 10.1037/a0038047 [DOI] [PubMed] [Google Scholar]
- Bosco F. A., Field J. G., Larsen K. R., Chang Y., Uggerslev K. L. (2020). Advancing meta-analysis with knowledge-management platforms: Using metaBUS in psychology. Advances in Methods and Practices in Psychological Science, 3, 124–137. 10.1177/2515245919882693 [DOI] [Google Scholar]
- Botella J., Ximenez C., Revuelta J., Suero M. (2006). Optimization of sample size in controlled experiments: The CLAST rule. Behavior Research Methods, 38, 65–76. 10.3758/BF03192751 [DOI] [PubMed] [Google Scholar]
- Brennan J., Poon M. T., Christopher E., Fulton O., Porteous C., Brennan P. M. (2023). Reporting of PPI and the MCID in phase III/IV randomised controlled trials—A systematic review. Trials, 24, 1–7. 10.1186/s13063-023-07367-0 [DOI] [PMC free article] [PubMed] [Google Scholar]
- Brunner J., Schimmack U. (2020). Estimating population mean power under conditions of heterogeneity and selection for significance. Meta-Psychology, 4. 10.15626/MP.2018.874 [DOI] [Google Scholar]
- Buhrmester M. D., Kwang T., Gosling S. D. (2011). Amazon’s Mechanical Turk: A new source of inexpensive, yet high-quality, data? Perspectives on Psychological Science, 6, 3–5. 10.1177/1745691610393980 [DOI] [PubMed] [Google Scholar]
- Buhrmester M. D., Talaifar S., Gosling S. D. (2018). An evaluation of Amazon’s Mechanical Turk, its rapid rise, and its effective use. Perspectives on Psychological Science, 13, 149–154. 10.1177/1745691617706516 [DOI] [PubMed] [Google Scholar]
- Byrne M. (2019). Increasing the impact of behavior change intervention research: Is there a role for stakeholder engagement? Health Psychology, 38(4), 290–296. 10.1037/hea0000723 [DOI] [PubMed] [Google Scholar]
- Cattell R. B., Tsujioka B. (1964). The importance of factor-trueness and validity, versus homogeneity and orthogonality, in test scales. Educational and Psychological Measurement, 24, 3–30. 10.1177/001316446402400101 [DOI] [Google Scholar]
- Chang M. (2011). Modern issues and methods in biostatistics. Springer Science & Business Media. [Google Scholar]
- Chen D.-G., Fraser M. W., Cuddeback G. S. (2018). Assurance in intervention research: A Bayesian perspective on statistical power. Journal of the Society for Social Work and Research, 9, 159–173. 10.1086/696239 [DOI] [Google Scholar]
- Cohen J. (1965). Some statistical issues in psychological research. In Wolman B. B. (Ed.), Handbook of Clinical Psychology (pp. 95–121). McGraw-Hill. [Google Scholar]
- Cohen J. (1977). Statistical power analysis for the behavioral sciences. Lawrence Erlbaum. [Google Scholar]
- Cohen J. (1988). Statistical power analysis for the behavioral sciences (2nd ed.). Lawrence Erlbaum. [Google Scholar]
- Cohen J. (1992). A power primer. Psychological Bulletin, 112, 155–159. 10.1037/0033-2909.112.1.155 [DOI] [PubMed] [Google Scholar]
- Colquhoun D. (2019). The false positive risk: A proposal concerning what to do about p-values. The American Statistician, 73(Suppl. 1), 192–201. 10.1080/00031305.2018.1529622 [DOI] [Google Scholar]
- Cornfield J. (1966). Sequential trials, sequential analysis and the likelihood principle. The American Statistician, 20, 18–23. [Google Scholar]
- Correll J., Mellinger C., McClelland G. H., Judd C. M. (2020). Avoid Cohen’s “small,” “medium,” and “large” for power analysis. Trends in Cognitive Sciences, 24, 200–207. 10.1016/j.tics.2019.12.009 [DOI] [PubMed] [Google Scholar]
- Craig M. A., Richeson J. A. (2014). On the precipice of a “majority-minority” America: Perceived status threat from the racial demographic shift affects White Americans’ political ideology. Psychological Science, 25, 1189–1197. 10.1177/0956797614527113 [DOI] [PubMed] [Google Scholar]
- Crandall C. S., Leach C. W., Robinson M., West T. (2018). PSPB editorial philosophy. Personality and Social Psychology Bulletin, 44, 287–289. https://doi.org./10.1177/0146167217752103 [DOI] [PubMed] [Google Scholar]
- Crenshaw K. (1989). Demarginalizing the intersection of race and sex: A Black feminist critique of antidiscrimination doctrine, feminist theory and antiracist politics. University of Chicago Legal Forum, 1989, 139–167. [Google Scholar]
- Cumming G. (2012). Understanding the new statistics: Effect sizes, confidence intervals, and meta-analysis. Routledge/Taylor & Francis. [Google Scholar]
- Dickersin K. (1990). The existence of publication bias and risk factors for its occurrence. JAMA, 263, 1385–1389. 10.1001/jama.1990.03440100097014 [DOI] [PubMed] [Google Scholar]
- Di Stefano J. (2003). How much power is enough? Against the development of an arbitrary convention for statistical power calculations. Functional Ecology, 17, 707–709. 10.1046/j.1365-2435.2003.00782.x [DOI] [Google Scholar]
- Du H., Wang L. (2016). A Bayesian power analysis procedure considering uncertainty in effect size estimates from a meta-analysis. Multivariate Behavioral Research, 51, 589–605. 10.1080/00273171.2016.1191324 [DOI] [PubMed] [Google Scholar]
- Durlak J. A., DuPre E. P. (2008). Implementation matters: A review of research on the influence of implementation on program outcomes and the factors affecting implementation. American Journal of Community Psychology, 41, 327–350. 10.1007/s10464-008-9165-0 [DOI] [PubMed] [Google Scholar]
- Engber D. (2017, June 7). Daryl Bem proved ESP is real: Which means science is broken. Slate. https://slate.com/health-and-science/2017/06/daryl-bem-proved-esp-is-real-showed-science-is-broken.html
- Farmus L., Beribisky N., Martinez Gutierrez N., Alter U., Panzarella E., Cribbie R. A. (2023). Effect size reporting and interpretation in social personality research. Current Psychology, 42, 15752–15762. 10.1007/s12144-021-02621-7 [DOI] [Google Scholar]
- Faul F., Erdfelder E., Buchner A., Lang A.-G. (2009). Statistical power analyses using G* Power 3.1: Tests for correlation and regression analyses. Behavior Research Methods, 41, 1149–1160. 10.3758/brm.41.4.1149 [DOI] [PubMed] [Google Scholar]
- Faul F., Erdfelder E., Lang A. G., Buchner A. (2007). G*Power 3: A flexible statistical power analysis program for the social, behavioral, and biomedical sciences. Behavior Research Methods, 39, 175–191. 10.3758/BF03193146 [DOI] [PubMed] [Google Scholar]
- Ferguson C. J. (2009). Is psychological research really as good as medical research? Effect size comparisons between psychology and medicine. Review of General Psychology, 13, 130–136. 10.1037/a0015103 [DOI] [Google Scholar]
- Finkel E. J., Eastwick P. W., Reis H. T. (2015). Best research practices in psychology: Illustrating epistemological and pragmatic considerations with the case of relationship science. Journal of Personality and Social Psychology, 108, 275–297. [DOI] [PubMed] [Google Scholar]
- Fitts D. A. (2010. a). Improved stopping rules for the design of efficient small-sample experiments in biomedical and biobehavioral research. Behavior Research Methods, 42, 3–22. 10.3758/BRM.42.1.3 [DOI] [PubMed] [Google Scholar]
- Fitts D. A. (2010. b). The variable-criteria sequential stopping rule: Generality to unequal sample sizes, unequal variances, or to large ANOVAs. Behavior Research Methods, 42, 918–929. 10.3758/BRM.42.4.918 [DOI] [PubMed] [Google Scholar]
- Frick R. W. (1998). A better stopping rule for conventional statistical tests. Behavioral Research Methods, Instruments, & Computers, 30, 690–697. 10.3758/BF03209488 [DOI] [Google Scholar]
- Friese M., Frankenbach J. (2020). P-Hacking and publication bias interact to distort meta-analytic effect size estimates. Psychological Methods, 25, 456–471. 10.1037/met0000246 [DOI] [PubMed] [Google Scholar]
- Funder D. C., Ozer D. J. (2019). Evaluating effect size in psychological research: Sense and nonsense. Advances in Methods and Practices in Psychological Science, 2, 156–168. 10.1177/2515245919847202 [DOI] [Google Scholar]
- Gelman A. (2019). Don’t calculate post-hoc power using observed estimate of effect size. Annals of Surgery, 269, e9–e10. 10.1097/SLA.0000000000002908 [DOI] [PubMed] [Google Scholar]
- Gignac G. E., Szodorai E. T. (2016). Effect size guidelines for individual differences researchers. Personality and Individual Differences, 102, 74–78. 10.1016/j.paid.2016.06.069 [DOI] [Google Scholar]
- Giner-Sorolla R. (2016). Approaching a fair deal for significance and other concerns. Journal of Experimental Social Psychology, 65, 1–6. 10.1016/j.jesp.2016.01.010 [DOI] [Google Scholar]
- Giner-Sorolla R. (2018, January 24). Powering your interaction [Blog post]. https://approachingblog.wordpress.com/2018/01/24/powering-your-interaction-2
- Giner-Sorolla R. (2019). From crisis of evidence to a “crisis” of relevance? Incentive-based answers for social psychology’s perennial relevance worries. European Review of Social Psychology, 30(1), 1–38. 10.1080/10463283.2018.1542902 [DOI] [Google Scholar]
- Goff P. A., Steele C. M., Davies P. G. (2008). The space between us: Stereotype threat and distance in interracial contexts. Journal of Personality and Social Psychology, 94, 91–107. 10.1037/0022-3514.94.1.91 [DOI] [PubMed] [Google Scholar]
- Goodman S. N., Berlin J. A. (1994). The use of predicted confidence intervals when planning experiments and the misuse of power when interpreting results. Annals of Internal Medicine, 121, 200–206. 10.7326/0003-4819-121-3-199408010-00008 [DOI] [PubMed] [Google Scholar]
- Gronau Q. F., Duizer M., Bakker M., Wagenmakers E.-J. (2017). Bayesian mixture modeling of significant p values: A meta-analytic method to estimate the degree of contamination from H₀. Journal of Experimental Psychology: General, 146, 1223–1233. 10.1037/xge0000324.supp [DOI] [PubMed] [Google Scholar]
- Hanel P. H., Mehler D. M. (2019). Beyond reporting statistical significance: Identifying informative effect sizes to improve scientific communication. Public Understanding of Science, 28, 468–485. 10.1177/0963662519834193 [DOI] [PubMed] [Google Scholar]
- Henrich J., Heine S. J., Norenzayan A. (2010). The WEIRDest people in the world? Behavioral and Brain Sciences, 33(2–3), 61–83. 10.1017/S0140525X0999152X [DOI] [PubMed] [Google Scholar]
- Heo M., Kim N., Faith M. S. (2015). Statistical power as a function of Cronbach alpha of instrument questionnaire items. BMC Medical Research Methodology, 15(1), 1–9. 10.1186/s12874-015-0070-6 [DOI] [PMC free article] [PubMed] [Google Scholar]
- Hoekstra R., Morey R. D., Rouder J. N., Wagenmakers E. J. (2014). Robust misinterpretation of confidence intervals. Psychonomic Bulletin & Review, 21, 1157–1164. 10.3758/s13423-013-0572-3 [DOI] [PubMed] [Google Scholar]
- Hoenig J. M., Heisey D. M. (2001). The abuse of power: The pervasive fallacy of power calculations for data analysis. The American Statistician, 55, 19–24. 10.1198/000313001300339897 [DOI] [Google Scholar]
- Hohn R. E., Slaney K. L., Tafreshi D. (2019). Primary study quality in psychological meta-analyses: An empirical assessment of recent practice. Frontiers in Psychology, 9, Article 2667. 10.3389/fpsyg.2018.02667 [DOI] [PMC free article] [PubMed] [Google Scholar]
- Holbert R. L., Hardy B. W., Park E., Robinson N. W., Jung H., Zeng C., . . . Sweeney K. (2018). Addressing a statistical power-alpha level blind spot in political-and health-related media research: Discontinuous criterion power analyses. Annals of the International Communication Association, 42, 75–92. 10.1080/23808985.2018.1459198 [DOI] [Google Scholar]
- Horowitz E., Sorensen N., Yoder N., Oyserman D. (2018). Teachers can do it: Scalable identity-based motivation intervention in the classroom. Contemporary Educational Psychology, 54, 12–28. 10.1016/j.cedpsych.2018.04.004 [DOI] [Google Scholar]
- Hubbard R. A., Kerlikowske K., Flowers C. I., Yankaskas B. C., Zhu W., Miglioretti D. L. (2011). Cumulative probability of false-positive recall or biopsy recommendation after 10 years of screening mammography: A cohort study. Annals of Internal Medicine, 155, 481–492. 10.7326/0003-4819-155-8-201110180-00004 [DOI] [PMC free article] [PubMed] [Google Scholar]
- Hyde J. S. (1981). How large are cognitive gender differences? A meta-analysis using !w² and d. American Psychologist, 36, 892–901. 10.1037/0003-066X.36.8.892 [DOI] [Google Scholar]
- IBM Corp. (2017). IBM SPSS statistics for Windows, version 25.0. [Google Scholar]
- Inzlicht M., Gervais W., Berkman E. (2015). Bias-correction techniques alone cannot determine whether ego depletion is different from zero: Commentary on Carter, Kofler, Forster, & McCullough, 2015. http://doi.org/10.2139/ssrn.2659409
- Ioannidis J. P. (2005). Why most published research findings are false. PLOS Medicine, 2, Article e124. 10.1371/journal.pmed.1004085 [DOI] [PMC free article] [PubMed] [Google Scholar]
- Iooss B., Saltelli A. (2017). Introduction to sensitivity analysis. In Ghanem R., Higdon D., Owhadi H. (Eds.), Handbook of uncertainty quantification (pp. 1103–1122). Springer. 10.1007/978-3-319-12385-1_31 [DOI] [Google Scholar]
- Isen A. M., Levin P. F. (1972). Effect of feeling good on helping: Cookies and kindness. Journal of Personality and Social Psychology, 21(3), 384–388. 10.1037/h0032317 [DOI] [PubMed] [Google Scholar]
- Jaeschke R., Singer J., Guyatt G. H. (1989). Measurement of health status: Ascertaining the minimal clinically important difference. Controlled Clinical Trials, 10, 407–415. 10.1016/0197-2456(89)90005-6 [DOI] [PubMed] [Google Scholar]
- Kelley K., Maxwell S. E. (2003). Sample size for multiple regression: Obtaining regression coefficients that are accurate, not simply significant. Psychological Methods, 8, 305–321. 10.1037/1082-989X.8.3.305 [DOI] [PubMed] [Google Scholar]
- Kelley K., Preacher K. J. (2012). On effect size. Psychological Methods, 17(2), 137–152. 10.1037/a0028086 [DOI] [PubMed] [Google Scholar]
- Kerr N. L. (1998). HARKing: Hypothesizing after the results are known. Personality and Social Psychology Review, 2, 196–217. 10.1207/s15327957pspr0203_4 [DOI] [PubMed] [Google Scholar]
- Klein S. B. (2022). Psychological theory and the illusion of scientific prediction. Culture, Medicine, and Psychiatry, 46, 1–13. 10.1007/s11013-021-09757-y [DOI] [PubMed] [Google Scholar]
- Kleinschmidt S., Dugas J. N., Nelson K. P., Feldman J. A. (2021). False negative point–of–care urine pregnancy tests in an urban academic emergency department: a retrospective cohort study. Journal of the American College of Emergency Physicians Open, 2(3), e12427. https://doi.org//10.1002/emp2.12427 [DOI] [PMC free article] [PubMed] [Google Scholar]
- Kraft M. A. (2020). Interpreting effect sizes of education interventions. Educational Researcher, 49, 241–253. 10.3102/0013189X20912798 [DOI] [Google Scholar]
- Lakens D. (2014). Performing high-powered studies efficiently with sequential analyses. European Journal of Social Psychology, 44, 701–710. 10.1002/ejsp.2023 [DOI] [Google Scholar]
- Lakens D. (2022). Sample size justification. Collabra: Psychology, 8, 33267. 10.1525/collabra.33267 [DOI] [Google Scholar]
- Lakens D., Adolfi F. G., Albers C. J., Anvari F., Apps M. A., Argamon S. E., . . . Buchanan E. M. (2018). Justify your alpha. Nature Human Behaviour, 2, 168–171. 10.1038/s41562-018-0311-x [DOI] [Google Scholar]
- Lakens D., Evers E. R. (2014). Sailing from the seas of chaos into the corridor of stability: Practical recommendations to increase the information value of studies. Perspectives on Psychological Science, 9, 278–292. 10.1177/1745691614528520 [DOI] [PubMed] [Google Scholar]
- Lakens D., Scheel A. M., Isager P. M. (2018). Equivalence testing for psychological research: A tutorial. Advances in Methods and Practices in Psychological Science, 1, 259–269. 10.1177/2515245918770963 [DOI] [Google Scholar]
- Lange F. (2020). Are difficult-to-study populations too difficult to study in a reliable way? Lessons learned from meta-analyses in clinical neuropsychology. European Psychologist, 25, 41–50. 10.1027/1016-9040/a000384 [DOI] [Google Scholar]
- Leach C. W. (2021). Editorial. Journal of Personality and Social Psychology, 120, 30–32. http://doi.org/10.1037/pspi0000226 [DOI] [PubMed] [Google Scholar]
- Lenth R. V. (2001). Some practical guidelines for effective sample size determination. The American Statistician, 55, 187–193. 10.1198/000313001317098149 [DOI] [Google Scholar]
- Lenth R. V. (2007). Post hoc power: Tables and commentary. Department of Statistics and Actuarial Science, The University of Iowa. [Google Scholar]
- Leong F. T., Okazaki S. (2009). History of Asian American psychology. Cultural Diversity and Ethnic Minority Psychology, 15, 352–362. 10.1037/a0016443 [DOI] [PubMed] [Google Scholar]
- Levine M., Ensom M. H. (2001). Post hoc power analysis: An idea whose time has passed? Pharmacotherapy: The Journal of Human Pharmacology and Drug Therapy, 21, 405–409. 10.1592/phco.21.5.405.34503 [DOI] [PubMed] [Google Scholar]
- Levitt H. M., Bamberg M., Creswell J. W., Frost D. M., Josselson R., Suárez-Orozco C. (2018). Journal article reporting standards for qualitative primary, qualitative meta-analytic, and mixed methods research in psychology: The APA Publications and Communications Board task force report. American Psychologist, 73, 26–46. 10.1037/amp0000151 [DOI] [PubMed] [Google Scholar]
- Lewis N. A., Jr., Michalak N. M. (2019, April 8). Has stereotype threat dissipated over time? A cross-temporal meta-analysis. 10.31234/osf.io/w4ta2 [DOI]
- Lewis T. T., Van Dyke M. E. (2018). Discrimination and the health of African Americans: The potential importance of intersectionalities. Current Directions in Psychological Science, 27, 176–182. 10.1177/0963721418770442 [DOI] [PMC free article] [PubMed] [Google Scholar]
- Liu X. S., Carlson R., Kelley K. (2019). Common language effect size for correlations. The Journal of General Psychology, 146, 325–338. 10.1080/00221309.2019.1585321 [DOI] [PubMed] [Google Scholar]
- Loken E., Gelman A. (2017). Measurement error and the replication crisis. Science, 355, 584–585. 10.1126/science.aal3618 [DOI] [PubMed] [Google Scholar]
- Lovakov A., Agadullina E. R. (2021). Empirically derived guidelines for effect size interpretation in social psychology. European Journal of Social Psychology, 51, 485–504. 10.1002/ejsp.2752 [DOI] [Google Scholar]
- Lykken D. T. (1968). Statistical significance in psychological research. Psychological Bulletin, 70(3, Pt. 1), 151–159. 10.1037/h0026141 [DOI] [PubMed] [Google Scholar]
- Marcoulides G. A. (1995). Designing measurement studies under budget constraints: Controlling error of measurement and power. Educational and Psychological Measurement, 55, 423–428. 10.1177/0013164495055003005 [DOI] [Google Scholar]
- Maxwell S. E., Kelley K. (2011). Ethics and sample size planning. In Panter A. T., Sterba S. K. (Eds.), Handbook of ethics in quantitative methodology (pp. 159–184). Routledge/Taylor & Francis. [Google Scholar]
- Maxwell S. E., Kelley K., Rausch J. R. (2008). Sample size planning for statistical power and accuracy in parameter estimation. Annual Review of Psychology, 59, 537–563. 10.1146/annurev.psych.59.103006.093735 [DOI] [PubMed] [Google Scholar]
- Mayo D. G. (2018). Statistical inference as severe testing: How to get beyond the statistics wars. Cambridge University Press. [Google Scholar]
- Mayo D. G. (2019). P-value thresholds: Forfeit at your peril. European Journal of Clinical Investigation, 49, e13170. 10.1111/eci.13170 [DOI] [PubMed] [Google Scholar]
- Mayo D. G., Morey R. D. (2017). A poor prognosis for the diagnostic screening critique of statistical tests. https://osf.io/ps38b
- McClelland G. H. (1997). Optimal design in psychological research. Psychological Methods, 2, 3–19. https://doi-org.chain.kent.ac.uk/10.1037/1082-989X.2.1.3 [Google Scholar]
- McClelland G. H. (2000). Increasing statistical power without increasing sample size. American Psychologist, 55, 963–964. 10.1037/0003-066X.55.8.963 [DOI] [Google Scholar]
- McClelland G. H., Judd C. M. (1993). Statistical difficulties of detecting interactions and moderator effects. Psychological Bulletin, 114, 376–390. 10.1037/0033-2909.114.2.376 [DOI] [PubMed] [Google Scholar]
- McShane B. B., Böckenholt U., Hansen K. T. (2016). Adjusting for publication bias in meta-analysis: An evaluation of selection methods and some cautionary notes. Perspectives on Psychological Science, 11, 730–749. 10.1177/1745691616662243 [DOI] [PubMed] [Google Scholar]
- McShane B. B., Böckenholt U., Hansen K. T. (2020). Average power: A cautionary note. Advances in Methods and Practices in Psychological Science, 3, 185–199. 10.1177/2515245920902370 [DOI] [Google Scholar]
- Meehl P. E. (1990). Why summaries of research on psychological theories are often uninterpretable. Psychological Reports, 66, 195–244. 10.2466/pr0.1990.66.1.195 [DOI] [Google Scholar]
- Miller J., Ulrich R. (2016). Interpreting confidence intervals: A comment on Hoekstra, Morey, Rouder, and Wagenmakers (2014). Psychonomic Bulletin & Review, 23, 124–130. 10.3758/s13423-015-0859-7 [DOI] [PubMed] [Google Scholar]
- Montoya A. K., Leo W., Krenzer D., Fossum J. L. (2021). Opening the door to registered reports: Census of journals publishing registered reports (2013–2020). Collabra: Psychology, 7, 24404. 10.1525/collabra.24404 [DOI] [Google Scholar]
- Moshontz H., Campbell L., Ebersole C. R., IJzerman H., Urry H. L., Forscher P. S., . . . Castille C. M. (2018). The Psychological Science Accelerator: Advancing psychology through a distributed collaborative network. Advances in Methods and Practices in Psychological Science, 1, 501–515. 10.1177/2515245918797607 [DOI] [PMC free article] [PubMed] [Google Scholar]
- Nakagawa S., Foster T. M. (2004). The case against retrospective statistical power analyses with an introduction to power analysis. Acta Ethologica, 7, 103–108. 10.1007/s10211-004-0095-z [DOI] [Google Scholar]
- Navarro D. J. (2019). Between the devil and the deep blue sea: Tensions between scientific judgement and statistical model selection. Computational Brain and Behavior, 2, 28–34. 10.1007/s42113-018-0019-z [DOI] [Google Scholar]
- Neyman J., Pearson E. S. (1933, October). The testing of statistical hypotheses in relation to probabilities a priori. Mathematical Proceedings of the Cambridge Philosophical Society, 29, 4, 492–510). [Google Scholar]
- Nisbett R. E., Wilson T. D. (1977). Telling more than we can know: Verbal reports on mental processes. Psychological Review, 84, 231–259. 10.1037/0033-295X.84.3.231 [DOI] [Google Scholar]
- Nosek B. A., Ebersole C. R., DeHaven A. C., Mellor D. T. (2018). The preregistration revolution. Proceedings of the National Academy of Sciences, 115, 2600–2606. 10.1073/pnas.1708274114 [DOI] [PMC free article] [PubMed] [Google Scholar]
- Onwuegbuzie A. J., Leech N. L. (2004). Post hoc power: A concept whose time has come. Understanding Statistics, 3(4), 201–230. 10.1207/s15328031us0304_1 [DOI] [Google Scholar]
- Open Science Collaboration. (2015). Estimating the reproducibility of psychological science. Science, 349, aac4716. 10.1126/science.aac4716 [DOI] [PubMed] [Google Scholar]
- Ozer D. J. (1993). Classical psychophysics and the assessment of agreement and accuracy in judgments of personality. Journal of Personality, 61, 739–767. 10.1111/j.1467-6494.1993.tb00789.x [DOI] [Google Scholar]
- Paolacci G., Chandler J. (2014). Inside the Turk: Understanding Mechanical Turk as a participant pool. Current Directions in Psychological Science, 23(3), 184–188. 10.1177/0963721414531598 [DOI] [Google Scholar]
- Pek J., Flora D. B. (2018). Reporting effect sizes in original psychological research: A discussion and tutorial. Psychological Methods, 23(2), 208–225. 10.1037/met0000126 [DOI] [PubMed] [Google Scholar]
- Pek J., Hoisington-Shaw K. J., Wegener D. T. (2022). Avoiding questionable research practices surrounding statistical power analysis. In O’Donohue W., Masada A., Lilienfeld S. (Eds.), Avoiding questionable research practices in applied psychology (pp. 243–267). Springer. [Google Scholar]
- Pek J., Park J. (2019). Complexities in power analysis: Quantifying uncertainties with a Bayesian-classical hybrid approach. Psychological Methods, 24, 590–605. 10.1037/met0000208 [DOI] [PubMed] [Google Scholar]
- Pek J., Wegener D. T., McClelland G. H. (2020). Signal detection continues to be part of science. Proceedings of the National Academy of Sciences, 117, 13199–13200. 10.1073/pnas.2005860117 [DOI] [PMC free article] [PubMed] [Google Scholar]
- Perugini M., Gallucci M., Costantini G. (2014). Safeguard power as a protection against imprecise power estimates. Perspectives on Psychological Science, 9(3), 319–332. 10.1177/1745691614528519 [DOI] [PubMed] [Google Scholar]
- Premachandra B., Lewis N. A. (2022). Do we report the information that is necessary to give psychology away? A scoping review of the psychological intervention literature 2000–2018. Perspectives on Psychological Science, 17, 226–238. 10.1177/1745691620974774 [DOI] [PubMed] [Google Scholar]
- Prentice D. A., Miller D. T. (1992). When small effects are impressive. Psychological Bulletin, 112, 160–164. 10.1037/0033-2909.112.1.160 [DOI] [Google Scholar]
- Ratcliff R. (1993). Methods for dealing with reaction time outliers. Psychological Bulletin, 114, 510–532. http://doi.org/10.1037/0033-2909.114.3.510 [DOI] [PubMed] [Google Scholar]
- Richard F. D., Bond C. F., Jr., Stokes-Zoota J. J. (2003). One hundred years of social psychology quantitatively described. Review of General Psychology, 7, 331–363. 10.1037/1089-2680.7.4.331 [DOI] [Google Scholar]
- Rohrer J. M. (2018). Thinking clearly about correlations and causation: Graphical causal models for observational data. Advances in Methods and Practices in Psychological Science, 1, 27–42. 10.1177/2515245917745629 [DOI] [Google Scholar]
- Rosenthal R. (1990). How are we doing in soft psychology? American Psychologist, 45, 775–777. 10.1037/0003-066X.45.6.775 [DOI] [Google Scholar]
- Rosenthal R., Rubin D. B. (2003). R equivalent: A simple effect size indicator. Psychological Methods, 8, 492–496. 10.1037/1082-989X.8.4.492 [DOI] [PubMed] [Google Scholar]
- Rothman K. J., Greenland S. (2018). Planning study size based on precision rather than power. Epidemiology, 29, 599–603. 10.1097/EDE.0000000000000876 [DOI] [PubMed] [Google Scholar]
- Rozin P. (2001). Social psychology and science: Some lessons from Solomon Asch. Personality and Social Psychology Review, 5, 2–14. 10.1207/S15327957PSPR0501_1 [DOI] [Google Scholar]
- Sassenberg K., Ditrich L. (2019). Research in social psychology changed between 2011 and 2016: Larger sample sizes, more self-report measures, and more online studies. Advances in Methods and Practices in Psychological Science, 2, 107–114. 10.1177/25152459198387 [DOI] [Google Scholar]
- Schäfer T., Schwarz M. A. (2019). The meaningfulness of effect sizes in psychological research: Differences between sub-disciplines and the impact of potential biases. Frontiers in Psychology, 10, Article 813. 10.3389/fpsyg.2019.00813 [DOI] [PMC free article] [PubMed] [Google Scholar]
- Scheel A. M., Schijen M. R., Lakens D. (2021). An excess of positive results: Comparing the standard psychology literature with registered reports. Advances in Methods and Practices in Psychological Science, 4, 25152459211007467. 10.1177/25152459211007467 [DOI] [Google Scholar]
- Schimmack U. (2012). The ironic effect of significant results on the credibility of multiple-study articles. Psychological Methods, 17, 551–566. 10.1037/a0029487 [DOI] [PubMed] [Google Scholar]
- Schnuerch M., Erdfelder E. (2020). Controlling decision errors with minimal costs: The sequential probability ratio t test. Psychological Methods, 25, 206–226. 10.1037/met0000234 [DOI] [PubMed] [Google Scholar]
- Schwartz B. (1997). Psychology, idea technology, and ideology. Psychological Science, 8, 21–27. 10.1111/j.1467-9280.1997.tb00539.x [DOI] [Google Scholar]
- Senn S. J. (2002). Power is indeed irrelevant in interpreting completed studies. BMJ, 325, 1304–1304. 10.1136/bmj.325.7375.1304 [DOI] [PMC free article] [PubMed] [Google Scholar]
- Silan M. A. (2019, January 13). A primer on practical significance. PsyArXiv. 10.31234/osf.io/zdhfe [DOI]
- Simmons J. P., Nelson L. D., Simonsohn U. (2011). False-positive psychology: Undisclosed flexibility in data collection and analysis allows presenting anything as significant. Psychological Science, 22, 1359–1366. 10.1177/0956797611417632 [DOI] [PubMed] [Google Scholar]
- Simmons J. P., Nelson L. D., Simonsohn U. (2012, October 14). A 21 word solution. https://papers.ssrn.com/sol3/papers.cfm?abstract_id=2160588
- Simonsohn U. (2015). Small telescopes: Detectability and the evaluation of replication results. Psychological Science, 26, 559–569. 10.1177/0956797614567341 [DOI] [PubMed] [Google Scholar]
- Simonsohn U., Nelson L. D., Simmons J. P. (2014). P-curve: A key to the file-drawer. Journal of Experimental Psychology: General, 143, 534–547. 10.1037/a0033242 [DOI] [PubMed] [Google Scholar]
- Sladekova M., Webb L. E. A., Field A. P. (2023). Estimating the change in meta-analytic effect size estimates after the application of publication bias adjustment methods. Psychological Methods, 28, 664–686. 10.1037/met0000470 [DOI] [PubMed] [Google Scholar]
- Sleegers W. (2019, February 25). [Twitter post]. https://twitter.com/willemsleegers/status/1100087024785244161
- Society for Personality and Social Psychology. (2022). 2023 single presenter submission guide. https://spsp.org/sites/default/files/2022-07/2023-Single-Presenter-Submission-Guide.pdf
- Spadaro G., Tiddi I., Columbus S., Jin S., Ten Teije A., CoDa Team, & Balliet D. (2022). The Cooperation Databank: Machine-readable science accelerates research synthesis. Perspectives on Psychological Science, 17, 1472–1489. 10.1177/17456916211053319 [DOI] [PMC free article] [PubMed]
- Spurlock D., Jr. (2019). Defining practical significance is hard, but we should do it anyway. Journal of Nursing Education, 58, 623–626. 10.3928/01484834-20191021-02 [DOI] [PubMed] [Google Scholar]
- Szucs D., Ioannidis J. P. A. (2017). Empirical assessment of published effect sizes and power in the recent cognitive neuroscience and psychology literature. PLOS Biology, 15, Article e2000797. 10.1371/journal.pbio.2000797 [DOI] [PMC free article] [PubMed] [Google Scholar]
- Tajfel H., Billig M. G., Bundy R. P., Flament C. (1971). Social categorization and intergroup behaviour. European Journal of Social Psychology, 1, 149–178. 10.1002/ejsp.2420010202 [Google Scholar]
- van Voorhis C. W., Morgan B. L. (2007). Understanding power and rules of thumb for determining sample sizes. Tutorials in Quantitative Methods for Psychology, 3, 43–50. [Google Scholar]
- Vazire S. (2016). Editorial. Social Psychological and Personality Science, 7, 3–7. 10.1177/1948550615603955 [DOI] [Google Scholar]
- Vollmer S. H., Howard G. (2010). Statistical power, the Belmont Report, and the ethics of clinical trials. Science and Engineering Ethics, 16, 675–691. 10.1007/s11948-010-9244-0 [DOI] [PubMed] [Google Scholar]
- Washburn A. N., Hanson B. E., Motyl M., Skitka L. J., Yantis C., Wong K. M., . . . Carsel T. S. (2018). Why do some psychology researchers resist adopting proposed reforms to research practices? A description of researchers’ rationales. Advances in Methods and Practices in Psychological Science, 1, 166–173. 10.1177/2515245918757427 [DOI] [Google Scholar]
- Wasserstein R. L., Lazar N. A. (2016). The ASA statement on p-values: Context, process, and purpose. The American Statistician, 70, 129–133. 10.1080/00031305.2016.1154108 [DOI] [Google Scholar]
- Wegener D. T., Fabrigar L. R., Pek J., Hoisington-Shaw K. (2022). Evaluating research in personality and social psychology: Considerations of statistical power and concerns about false findings. Personality and Social Psychology Bulletin, 48, 1105–1117. 10.1177/01461672211030811 [DOI] [PubMed] [Google Scholar]
- Westfall J. (2015, May 26). Think about total N, not n per cell [Blog post]. http://jakewestfall.org/blog/index.php/2015/05/26/think-about-total-n-not-n-per-cell/
- Wilkinson L., & Task Force on Statistical Inference, American Psychological Association, Science Directorate. (1999). Statistical methods in psychology journals: Guidelines and explanations. American Psychologist, 54, 594–604. 10.1037/0003-066X.54.8.594 [DOI] [Google Scholar]
- Wilson B. M., Wixted J. T. (2018). The prior odds of testing a true effect in cognitive and social psychology. Advances in Methods and Practices in Psychological Science, 1, 186–197. 10.1177/2515245918767122 [DOI] [Google Scholar]
- Wilson W. R. (1979). Feeling more than we can know: Exposure effects without learning. Journal of Personality and Social Psychology, 37(6), 811–821. 10.1037/0022-3514.37.6.811 [DOI] [Google Scholar]
- Ximenez C., Revuelta J. (2007). Extending the CLAST sequential rule to one-way ANOVA under group sampling. Behavior Research Methods, 39, 86–100. 10.3758/BF03192847 [DOI] [PubMed] [Google Scholar]
- Yeager D. S., Hanselman P., Walton G. M., Murray J. S., Crosnoe R., Muller C., . . . Dweck C. S. (2019). A national experiment reveals where a growth mindset improves achievement. Nature, 573, 364–369. 10.1038/s41586-019-1466-y [DOI] [PMC free article] [PubMed] [Google Scholar]
- Zehetleitner M., Schönbrodt F. (2022). When does a significant p-value indicate a true effect? [Web page]. http://shinyapps.org/apps/PPV/
- Zhang Y., Hedo R., Rivera A., Rull R., Richardson S., Tu X. M. (2019). Post hoc power analysis: Is it an informative and meaningful analysis? General Psychiatry, 32, e100069. 10.1136/gpsych-2019-100069 [DOI] [PMC free article] [PubMed] [Google Scholar]
Associated Data
This section collects any data citations, data availability statements, or supplementary materials included in this article.
Supplementary Materials
Supplemental material, sj-docx-1-psr-10.1177_10888683241228328 for Power to Detect What? Considerations for Planning and Evaluating Sample Size by Roger Giner-Sorolla, Amanda K. Montoya, Alan Reifman, Tom Carpenter, Neil A. Lewis, Christopher L. Aberson, Dries H. Bostyn, Beverly G. Conrique, Brandon W. Ng, Alexander M. Schoemann and Courtney Soderberg in Personality and Social Psychology Review