Abstract
Background:
Compared to other ethnicities, Hispanics/Latinos have a high incidence of acute lymphoblastic leukemia (ALL), enrichment of unfavorable ALL genetic subtypes and worse outcomes, even after correcting for socioeconomic factors. We previously demonstrated increased incidence of the high-risk genetic drivers IKZF1 deletion and IGH::CRLF2 rearrangement in Hispanic/Latino (HL) compared to non-H/L children with B-ALL. Here in an expanded pediatric cohort, we sought to identify novel genetic drivers and secondary genetic alterations in B-ALL associated with H/L ethnicity.
Procedure:
Comprehensive clinicopathologic data from patients with B-ALL treated from 2016 to 2020 were analyzed. Subtype was determined from karyotype, fluorescence in situ hybridization (FISH), chromosome microarray (CMA) and our next-generation sequencing (NGS) panel (OncoKids®). Non-driver genetic variants were also examined. p-values <0.05 (Fisher’s exact test) were considered significant.
Results:
Among patients with B-ALL at diagnosis (n=273), H/L patients (189, 69.2%) were older (p=0.018), more likely to present with CNS2 or 3 disease (p=0.004) and NCI high-risk ALL (p=0.014) compared to non-H/L patients. Higher incidence of IGH::CRLF2 rearrangement (B-ALL, BCR::ABL1-like, unfavorable; p=0.016) and lower incidence of ETV6::RUNX1 rearrangement (favorable, p=0.02) were also associated with H/L ethnicity. Among secondary (non-subtype-defining) genetic variants, B-ALL in H/L was associated with IKFZ1 deletion alone (p=0.001) or with IGH::CRLF2 rearrangement (p=0.003). The IKZF1PLUS profile (IKZF1 deletion plus CDKN2A/2Bdel, PAX5del or P2RY8::CRLF2 rearrangement without DUX4 rearrangement) was identified as a novel high-risk feature enriched in H/L patients (p=0.001).
Conclusions:
Our study shows enrichment of high-risk genetic variants in H/L B-ALL and raises consideration for novel therapeutic targets.
Keywords: Pediatric, leukemia, acute lymphoblastic leukemia, B-ALL, Hispanic, ethnicity
Introduction
Acute lymphoblastic leukemia (ALL) is the most common pediatric malignancy, with an annual incidence in the United States of 3.7–4.9 cases per 100,000 children aged 0–14.1–3 It carries an overall excellent prognosis, with cure rates reaching approximately 90%.3,4 Though the outcome is promising for many children diagnosed with ALL, the disease remains a significant burden on the pediatric population, and one that disproportionally impacts certain groups. There is a known ethnic disparity in both the incidence and outcomes in pediatric ALL.5 Hispanic/Latino (H/L) individuals have a higher incidence of ALL,6 and H/L children are 1.2–1.75 times more likely than non-Hispanic white (NHW) children to be diagnosed with ALL.5,7 Additionally, H/L children are 1.4 times more likely to die from the disease than NHW children,8 even after accounting for socioeconomic status9,10 and medication adherence.11
B-ALL accounts for 85% of pediatric ALL cases and is subclassified by genetic driver lesions, rearrangements or mutations.12–15 Many subtypes are associated with prognoses and have therapeutic implications.15,16 For example, B-ALL characterized by an ETV6::RUNX1 rearrangement or hyperdiploidy with double trisomy has an excellent survival rate of 93% and may be treated with less intensive therapy than other subtypes.17,18 On the other hand, KMT2A rearrangement, BCR::ABL1 (Philadelphia chromosome) rearrangement (Ph+) and Philadelphia-like (Ph-like, e.g. CRLF2 rearrangement, often with IKZF1 deletion) are among the subtypes associated with less favorable prognoses.19–24
We have previously shown that concomitant CRLF2 rearrangement and IKZF1 deletion are associated with H/L ethnicity.25 In the current study, we sought to identify novel genetic drivers and secondary genetic alterations in B-ALL associated with H/L ethnicity.
Methods
Setting and Participants
Following IRB approval, we identified all patients with B-ALL diagnosed at 21 years of age or younger and treated at our tertiary pediatric referral center between January 2016 and December 2020. Inclusion criteria were available molecular genetic data from diagnostic leukemia samples processed and analyzed at our Center for Personalized Medicine (CPM). Cases included all those from our previous study (n=239)25 as well as additional cases collected after that study period.
Data Collection
Comprehensive clinicopathologic data were gathered from the electronic medical record, pathology and CPM databases, including demographic information [sex, ethnicity, constitutional trisomy 21 (Down syndrome) status], age, white blood cell (WBC) count, central nervous system (CNS) status by cerebrospinal fluid (CSF) cytomorphology, National Cancer Institute (NCI) risk group, treatment information, response to therapy, and outcome. Ethnicity was drawn from the self-reported race and ethnicity data in the electronic health record, which were collected at the time of registration to the hospital per NIH criteria. Patients were treated per ongoing or completed Children’s Oncology Group (COG) frontline trials for ALL.26,27
The standard cytogenetic and molecular work-up for B-ALL subclassification at our institution has been previously described28 and includes karyotype, B-ALL fluorescence in situ hybridization (FISH) panel, chromosome microarray (CMA), and an institutional next-generation sequencing (NGS) panel (OncoKids®),29 for DNA and RNA variants across pediatric cancers, including hematologic malignancies. FISH include the standard Children’s Oncology Group (COG) probe sets as well as additional probes for selected cases, including ABL1, ABL2 and PDGFRB probes for NCI high-risk ALL and IGH and CRLF2 probes for cases with CRLF2 expression identified by flow cytometry. CytoScan™ HD arrays (Thermo Fisher Scientific, Waltham, MA) were used for CMA testing. DNA preparation, hybridization, washing, and labeling followed the protocols recommended by the manufacturer, and the data were analyzed with the Chromosome Analysis Suite (ChAS) software (V3.1. Thermo Fisher Scientific, Waltham, MA). OncoKids® panel testing was performed as previously described.28,29 Primary and secondary genetic lesions (fusions, mutations, deletions, and insertions) for all available samples were catalogued.
Outcomes and Measures
Primary outcome measures were the presence of CRLF2 rearrangement and/or IKZF1 deletion in B-ALL. Secondary outcome measures included the presence of other primary genetic drivers and secondary genetic alterations in B-ALL as determined by the OncoKids® assay (mutations) and CMA (copy number alterations). Exploratory clinical outcomes were event-free survival (EFS) and overall survival (OS). B-ALL subtypes based on primary genetic drivers were defined by the current WHO13 and ICC14 classifications and grouped into associated favorable, neutral, and unfavorable cytogenetic risk categories as follows: favorable = ETV6::RUNX1, hyperdiploidy with double trisomy, DUX4 and PAX5 P80R; neutral = ETV6::RUNX1-like, hyperdiploidy without double trisomy, TCF3::PBX1, dic(9;20), PAX5alt, ZNF384, IGH::BCL2, IGH::CEBPE, IGH::ID4, IGH::MYC, NUTM1, and not otherwise specified (NOS); and unfavorable = BCR::ABL1, BCR::ABL1-like (non-CRLF2), IGH::CRLF2, P2RY8::CRLF2, hypodiploidy, intrachromosomal amplification of chromosome 21 (iAMP21), KMT2A-R, and MEF2D. Event-free survival (EFS) was calculated as the interval from the date of initial diagnosis until the date of first relapse or death from any cause. OS was calculated from date of initial diagnosis to date of death from any cause or date of last follow-up.
Statistical Analysis
Demographics and characteristics at diagnosis were summarized for the full cohort and across H/L ethnicity and non-H/L ethnicity groups using median and interquartile range (IQR) for continuous variables. Categorical variables were described as frequency and percentage. Differences between groups were assessed via Wilcoxon rank-sum tests for continuous variables and Fisher’s exact tests for categorical variables. For primary outcomes, we utilized Fisher’s exact tests as univariate analyses, as well as logistic regression models adjusting for sex and NCI Risk score. A penalized likelihood-based method, Firth’s bias-reduced logistic regression (R package “logistf”), was used to accommodate the low prevalence rates.30 We also performed the aforementioned univariate analyses for the secondary outcomes. As exploratory analyses, an ordinal logistic regression model was fit to determine whether prognosis is related to H/L ethnicity, with and without adjusting for sex and NCI Risk. Associations of ethnicity and cytogenetic risk groups with EFS and OS were evaluated via Kaplan Meier curves to visualize time to first relapse/death and death, accompanied by log-rank tests. A multivariate Cox proportional hazards regression model with ethnicity, cytogenetic risk groups, and sex was also fitted as we recognized the potential confounding effects of sex and cytogenetic risk groups on the observed relationship between ethnicity and survival outcomes based on literature and clinical perspective. To keep the probability of a type I error less than 0.05 with the multiple hypotheses tested in the secondary analyses, p-values were controlled with respect to false discovery rate (FDR) using Benjamini-Hochberg’s procedure.31 All tests were two-sided and a p-value < 0.05 was considered statistically significant. All statistical analyses were conducted by R-studio 4.2.2.
Results
The cohort consisted of 273 patients presenting with a new diagnosis of B-ALL. Of these, 239 patients had also been included in Raca et al Leukemia 2021; however, comprehensive molecular characterization was not included in the previous report.25 Median (IQR) age was 6.5 (3.4, 12.5) years, 54.6% (149 patients) were male, and 69.2% (189 patients) identified as H/L. Detailed demographic and disease information with respect to ethnicity is presented in Table 1.
Table 1.
Demographic and disease information by ethnicity
| Overall N = 273 | Hispanic N = 189 | Non-Hispanic N = 84 | p-value1 | |
|---|---|---|---|---|
|
| ||||
| Age (median), years (IQR) | 6.5 (3.4, 12.5) | 7.4 (3.5, 13.2) | 5.2 (3.1, 9.6) | 0.018 |
|
| ||||
| Male, n (%) | 149 (54.6) | 108 (57.1) | 41 (48.8) | 0.2 |
|
| ||||
| Down syndrome, n (%) | 14 (5.1) | 10 (5.3) | 4 (4.8) | 0.9 |
|
| ||||
| WBC (median), K/µL (IQR) | 7.7 (3.1, 32.1) | 9.0 (3.1, 47.5) | 6.9 (3.0, 15.7) | 0.2 |
|
| ||||
| Subtype, n (%) | ||||
| Favorable | 101 (37.0) | 61 (32.3) | 40 (47.6) | 0.056 |
| Neutral | 78 (28.6) | 58 (30.7) | 20 (23.8) | |
| Unfavorable | 94 (34.3) | 70 (37.0) | 24 (28.6) | |
|
| ||||
| CNS2 or CNS3, n (%) 2 | 67 (24.7) | 56 (29.9) | 11 (13.1) | 0.004 |
|
| ||||
| NCI high risk, n (%) | 130 (47.6) | 100 (52.9) | 30 (35.7) | 0.009 |
|
| ||||
| EOI MRD+, n (%) 2 | 66 (24.4) | 50 (26.7) | 16 (19.0) | 0.2 |
Wilcoxon rank-sum test, Fisher’s exact test
N=271 (Hispanic: 187, Non-Hispanic: 84); IQR, interquartile range; WBC, white blood cell count; BM, bone marrow; CNS2, central nervous system 2 status at diagnosis; NCI high risk, National Cancer Institute risk score of 2 or 3; EOI, end of Induction; MRD, minimal/measurable residual disease.
Clinicopathologic features
Compared to non-H/L patients, H/L patients were older (median [IQR] age: 7.4 [3.5, 13.2] vs. 5.2 [3.1, 9.6] years, p=0.018), more likely to present with CNS2 or CNS3 disease (29.9% vs. 13.1%, p=0.004) and NCI high-risk ALL (52.9% H/L vs. 35.7% non-H/L, p=0.009). The difference in NCI high-risk status was predominantly driven by age (Supplementary Table 1). There was no significant difference in sex, prevalence of Down syndrome, WBC at diagnosis, or MRD by flow cytometry at end of induction (EOI, day 29).
CRLF2 rearrangement and IKZF1 deletion
All univariate and multivariate analysis estimates are presented in Table 2. H/L patients had higher prevalence of IGH::CRLF2 rearrangement (13.2% H/L vs. 3.6% non-H/L, p=0.016) than non-H/L patients. However, this relationship was confounded by sex and NCI Risk in the multivariate model (OR: 2.59, 95% CI: [0.89, 10.1], p = 0.08).
Table 2.
Associations of key genetic rearrangements and deletions with Hispanic/Latino ethnicity
| Prevalence by ethnicity | Multivariate logistic regression adjusted for sex and NCI risk | ||||||
|---|---|---|---|---|---|---|---|
| Overall N = 2731 | Hispanic N = 1891 | Non-Hispanic N = 841 | p2 | OR3 | 95% CI3 | p3 | |
| IGH::CRLF2 rearrangement | 28 (10.3%) | 25 (13.2%) | 3 (3.6%) | 0.016 | 2.59 | 0.9, 10.1 | 0.08 |
| IKZF1 deletion | 63 (23.1%) | 54 (28.6%) | 9 (10.7%) | 0.001 | 2.56 | 1.22, 5.86 | 0.012 |
| IKZF1 deletion + concomitant IGH::CRLF2 rearrangement | 23 (8.4%) | 22 (11.6%) | 1 (1.2%) | 0.003 | 5.15 | 1.2, 47.7 | 0.021 |
| IKZF1 PLUS | 41 (15%) | 37 (19.6%) | 4 (4.8%) | 0.001 | 3.53 | 1.37, 11.4 | 0.007 |
| VPREB1 deletion | 71 (26%) | 56 (29.6%) | 15 (17.9%) | 0.052 | 1.81 | 0.97, 3.51 | 0.061 |
| IKZF1 deletion + concomitant VPREB1 deletion | 26 (9.5%) | 21 (11.1%) | 5 (6%) | 0.3 | 1.38 | 0.53, 4.14 | 0.5 |
n (%)
Fisher’s exact test
Adjusted logistic regression; OR, Odds Ratio; CI, Confidence Interval.
Confirming the reported finding in our previous study,25 H/L ethnicity was associated with IKZF1 deletion [54 of 189 (28.6%) H/L patients compared to 9 of 84 (10.7%) non-H/L patients, p=0.001]. H/L patients had higher prevalence of IKZF1 deletion plus concomitant IGH::CRLF2 rearrangement (22/189 [11.6%] H/L vs. 1/84 [1.2%], p=0.003) compared to non-H/L ethnicity. After adjusting for sex and NCI Risk, both IKZF1 deletion and IKZF1 deletion plus concomitant IGH::CRLF2 rearrangement remained significantly associated with H/L ethnicity (OR: 2.56, 95% CI: [1.22, 5.86], p = 0.012 and OR: 5.15, 95% CI: [1.23, 47.7], p = 0.021, respectively).
IKZF1PLUS B-ALL
IKZF1PLUS, defined by IKZF1 deletion plus CDKN2A/2Bdel, PAX5del or P2RY8::CRLF2 rearrangement without DUX4 rearrangement,32–34 was also strongly associated with H/L ethnicity (19.6% in H/L vs 4.8% in non-H/L, p=0.001). IKZF1PLUS remained significantly associated with H/L ethnicity in the multivariate model (OR: 3.53, 95% CI: [1.37, 11.4], p = 0.007). Among 41 patients with IKZF1PLUS (36 H/L and 4 non-H/L, with one patient missing EOI MRD), 20 (50%) had positive MRD. 19/36 (52.8%) of H/L patients with IKZF1PLUS (vs 1/4 (25%) of non-HL patients) had positive MRD. The genetic characteristics qualifying for IKZF1PLUS designation in our cohort (n=41) are detailed in Supplementary Table 2.
VPREB1 deletion
Based on findings in previous studies demonstrating a link between VPREB1 deletion and higher-risk B-ALL,22–24 we tested whether VPREB1 was associated with H/L ethnicity in our cohort. Among H/L patients, 56 of 189 (29.6%) harbored a leukemia-associated VPREB1 deletion compared to 15 of 84 (17.9%) non-H/L patients. H/L patients also had a higher prevalence of IKZF1 deletion plus concomitant VPREB1 deletion than non-H/L patients (11.1% vs. 6%). However, these associations were not statistically significant in either univariate or multivariate analyses (p > 0.05).
Other genetic drivers
H/L patients with B-ALL had lower prevalence of ETV6::RUNX1 fusion (13.2% H/L vs. 25.0% non-H/L, p=0.02) compared to non-H/L ethnicity. However, this association was no longer statistically significant after controlling for false discovery rate (p=0.3). H/L ethnicity was not associated with other B-ALL subtypes in our cohort as follows: BCR::ABL1, BCR::ABL1-like features, ETV6::RUNX1-like features, hyperdiploidy without double trisomy, hyperdiploidy with double trisomy, low hyperdiploidy, hypodiploidy, iAMP21, TCF3::PBX1, KMT2A-R, dic(9;20), DUX4, PAX5alt, PAX5 P80R, MEF2D, IGH::BCL2, IGH::CEBPE, IGH::ID4, IGH::MYC, NUTM1, ZNF384 and not otherwise specified (NOS) (Figure 1).
Figure 1. Prevalence of B-lymphoblastic leukemia (B-ALL) genetic drivers by patient ethnicity.
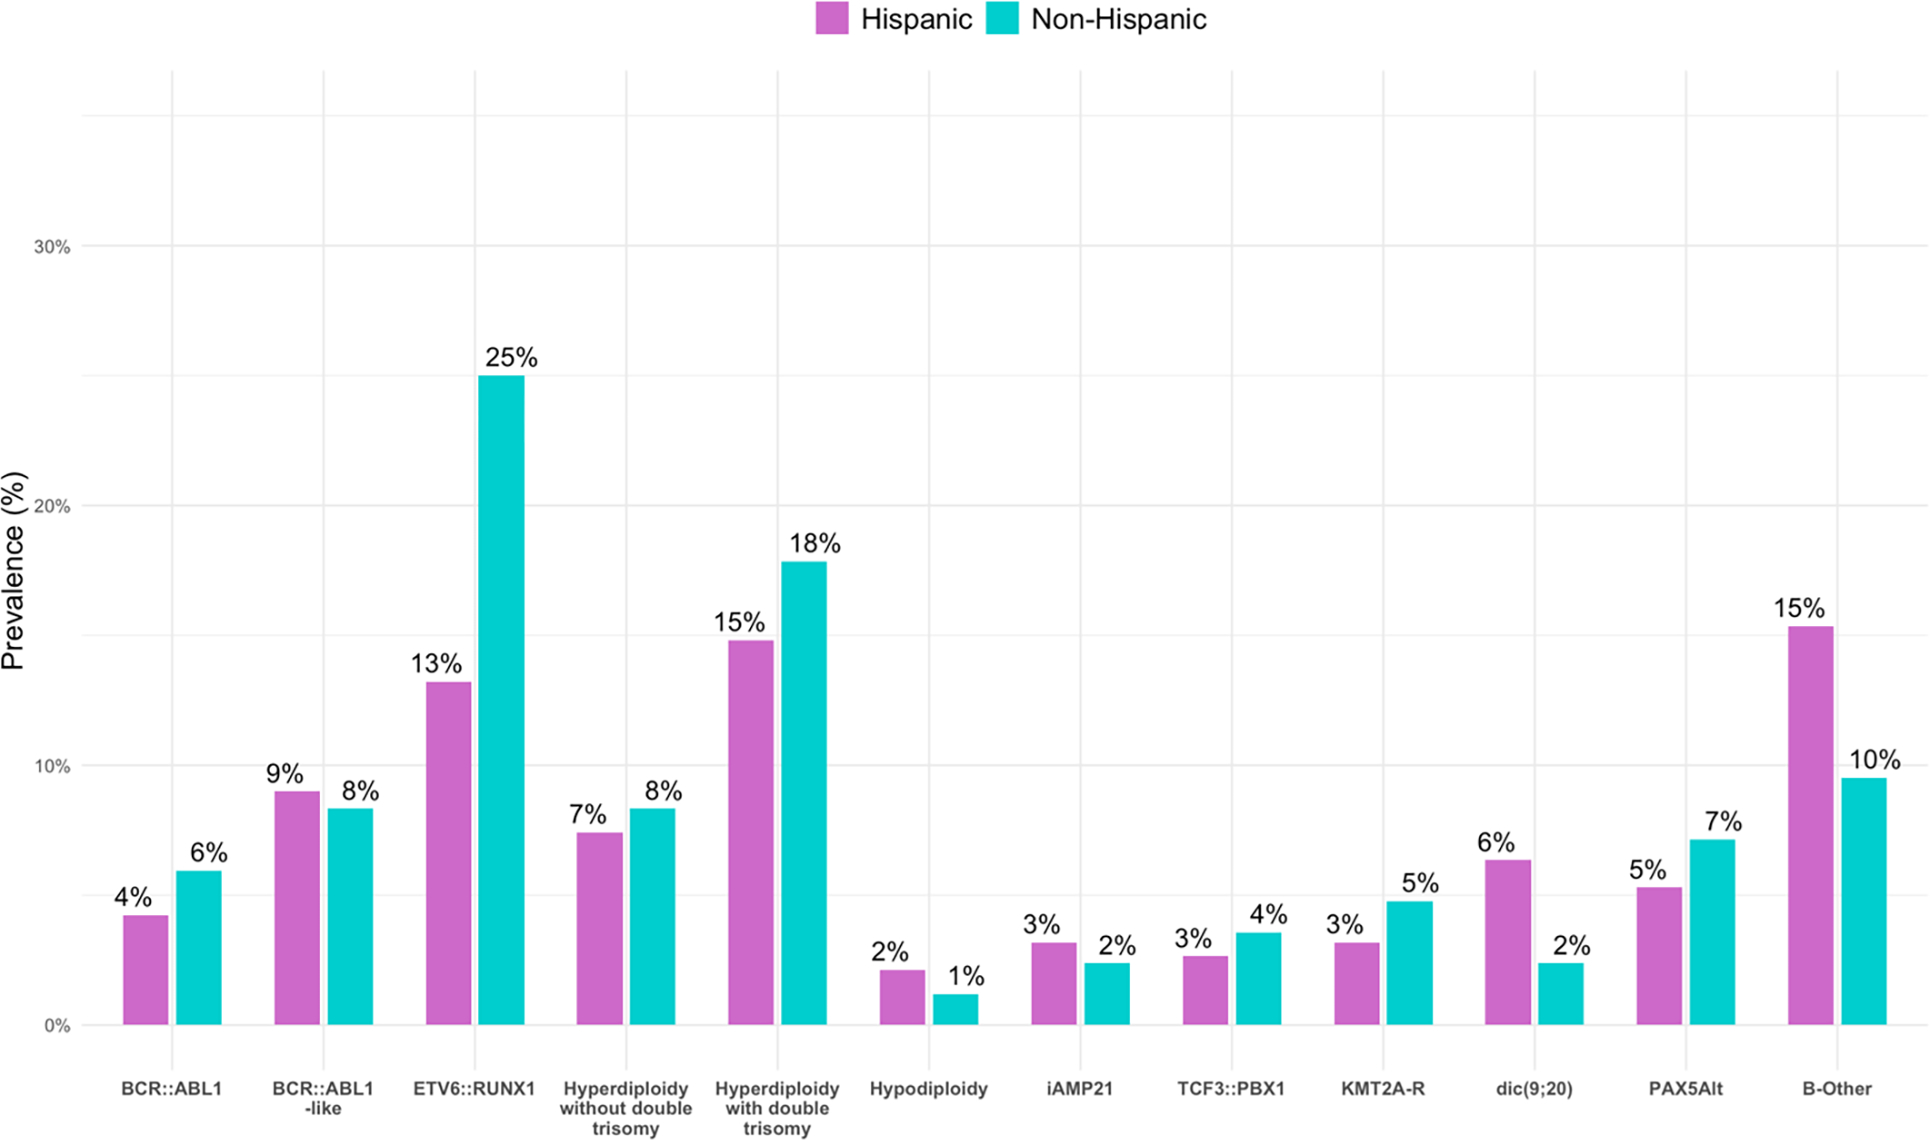
Higher incidence of IGH::CRLF2 rearrangement (B-ALL, BCR::ABL1-like, unfavorable; p=0.016) and lower incidence of ETV6::RUNX1 rearrangement (favorable, p=0.02) were associated with H/L ethnicity.
Secondary genetic alterations
Comprehensive cytogenetic and molecular data from CMA (CytoScan™ HD array) and NGS-based mutation panel (OncoKids®) testing was available for the leukemias of 189 of 273 patients (69.2%; 130/189, or 68.8%, of H/L patients; 59/84, or 70.2%, of non-H/L patients. H/L ethnicity group had a higher proportion of CDKN2A/2B deletion (40.2% H/L vs. 25.0% non-H/L, p=0.020) as well as KRAS mutation [24/130 (18.5%) H/L vs. 4/59 (6.8%) non-H/L, p=0.046]. However, these associations were no longer statistically significant after applying a false discovery rate correction to all secondary hypothesis tests (p=0.05 and p>0.9, respectively). There were no significant associations between H/L ethnicity and deletion of the following gene loci by CMA: BTG1, BTLA, TBL1XR1, NSD2, NR3C2, LEF1, EBF1, NR3C1, HIST1H3B, TOX, PAX5, ADD3, ADARB2, ETV6, SH2B3, RB1, SERP2, PAN3, CREBBP, NF1, TP53, STAG2, or DDX3X; gain of the PAX5 locus by CMA; or mutations in the following genes by OncoKids®29: ABL1, ASXL1, ATRX, BRAF, CCND3, CDKN2A, CREBBP, CRLF2, EZH2, FLT3, GATA3, IL7R, JAK1, JAK2, KMT2D, MTOR, NF1, NRAS, NSD2, NT5C2, PAX5, PTPN11, SH2B3, SETD2, TPMT or TP53.
Clinical outcomes
Treatment information is summarized in Supplementary Results. After categorizing patients into favorable, neutral, and unfavorable cytogenetic risk groups based on subtype as described in the methods section, H/L patients were found to have higher proportions of less favorable subtypes compared to non-H/L patients (neutral: 30.7% H/L vs. 23.8% non-HL; unfavorable: 37.0% H/L vs. 28.6% non-HL, p = 0.056) (Table 1). The odds of having a less favorable subtypes are 1.71 times higher for H/L patients compared to non-H/L patients (95% CI: 1.1, 2.8, p=0.029). However, this relationship was confounded by sex and NCI risk in the multivariate model (OR=1.4, 95% CI: 0.8, 2.3, p=0.23).
In the overall cohort, there were 17 deaths (6.2%), 15 among H/L patients (15/189, or 7.9%) and 2 among non-H/L patients (2/84, or 2.4%). EFS and OS between ethnicity groups are depicted in Figure 2. In the overall cohort, there were 42 relapses (15.4%), 29 among H/L patients (29/189, or 15.3%) and 13 among non-H/L patients (13/84, or 15.5%). There was no difference in EFS or OS between the two groups in either long-rank tests (p=0.41 and p=0.08, respectively) or in the multivariable models with sex and cytogenetic risk groups (HR=1.17, 95% CI: 0.63, 2.16, p=0.60 and HR=3.19, 95% CI: 0.72, 14.0, p=0.13, respectively).
Figure 2. Kaplan-Meier survival curves, with log-rank test, by ethnicity groups.
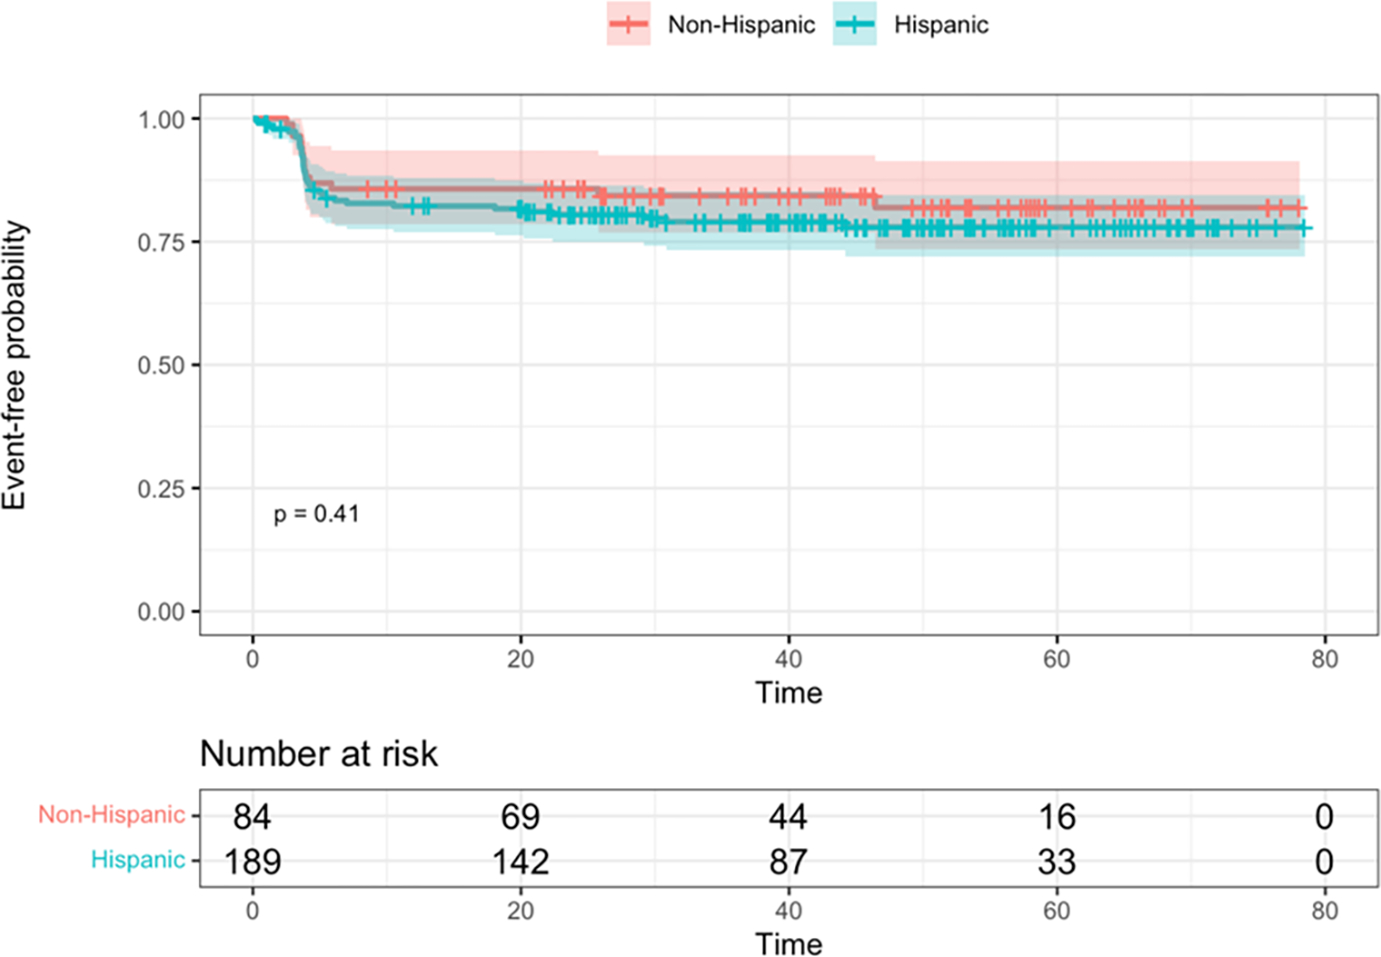
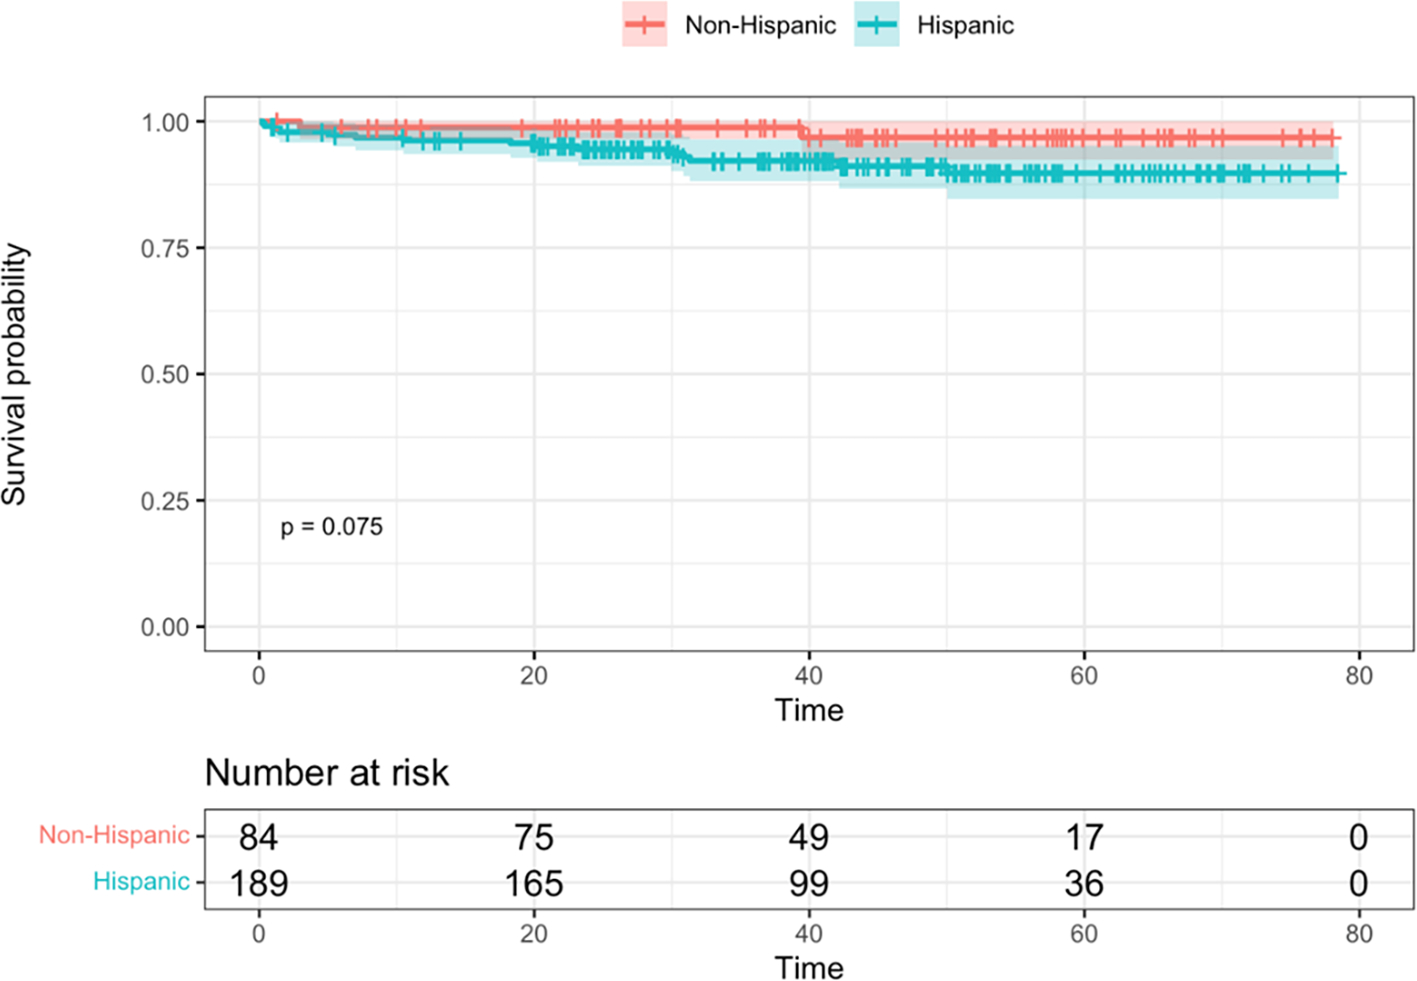
A. Event-free survival. B. Overall survival. Time is shown in months.
Differences in EFS and OS between cytogenetic risk groups were both significant via log-rank tests (p = 0.007 and p < 0.001, respectively) (Figure 3). Unfavorable subtypes were associated with poorer EFS compared to favorable and neutral subtypes (HR = 2.6, 95% CI: 1.3, 5.2, p = 0.005, HR = 1.9, 95% CI: 0.97, 3.7, p = 0.06, respectively). The hazard ratio for OS was 14.1 (95% CI: 1.9, 108, p=0.011) times higher in those with unfavorable subtypes as compared to those with favorable subtypes, and 6.1 times higher compared to those with neutral subtypes (95% CI: 1.4, 26.9, 0.02).
Figure 3. Kaplan-Meier survival curves by cytogenetic risk groups.
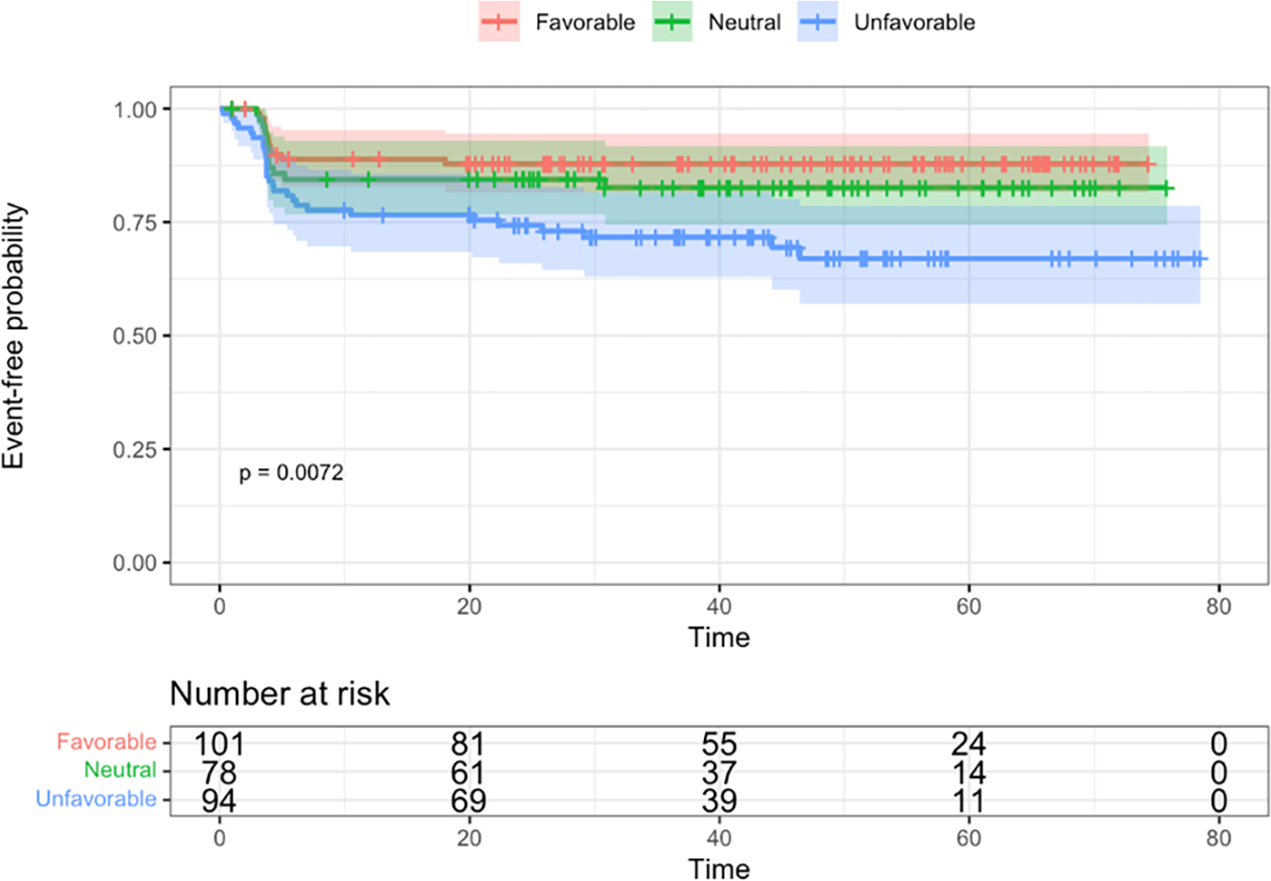
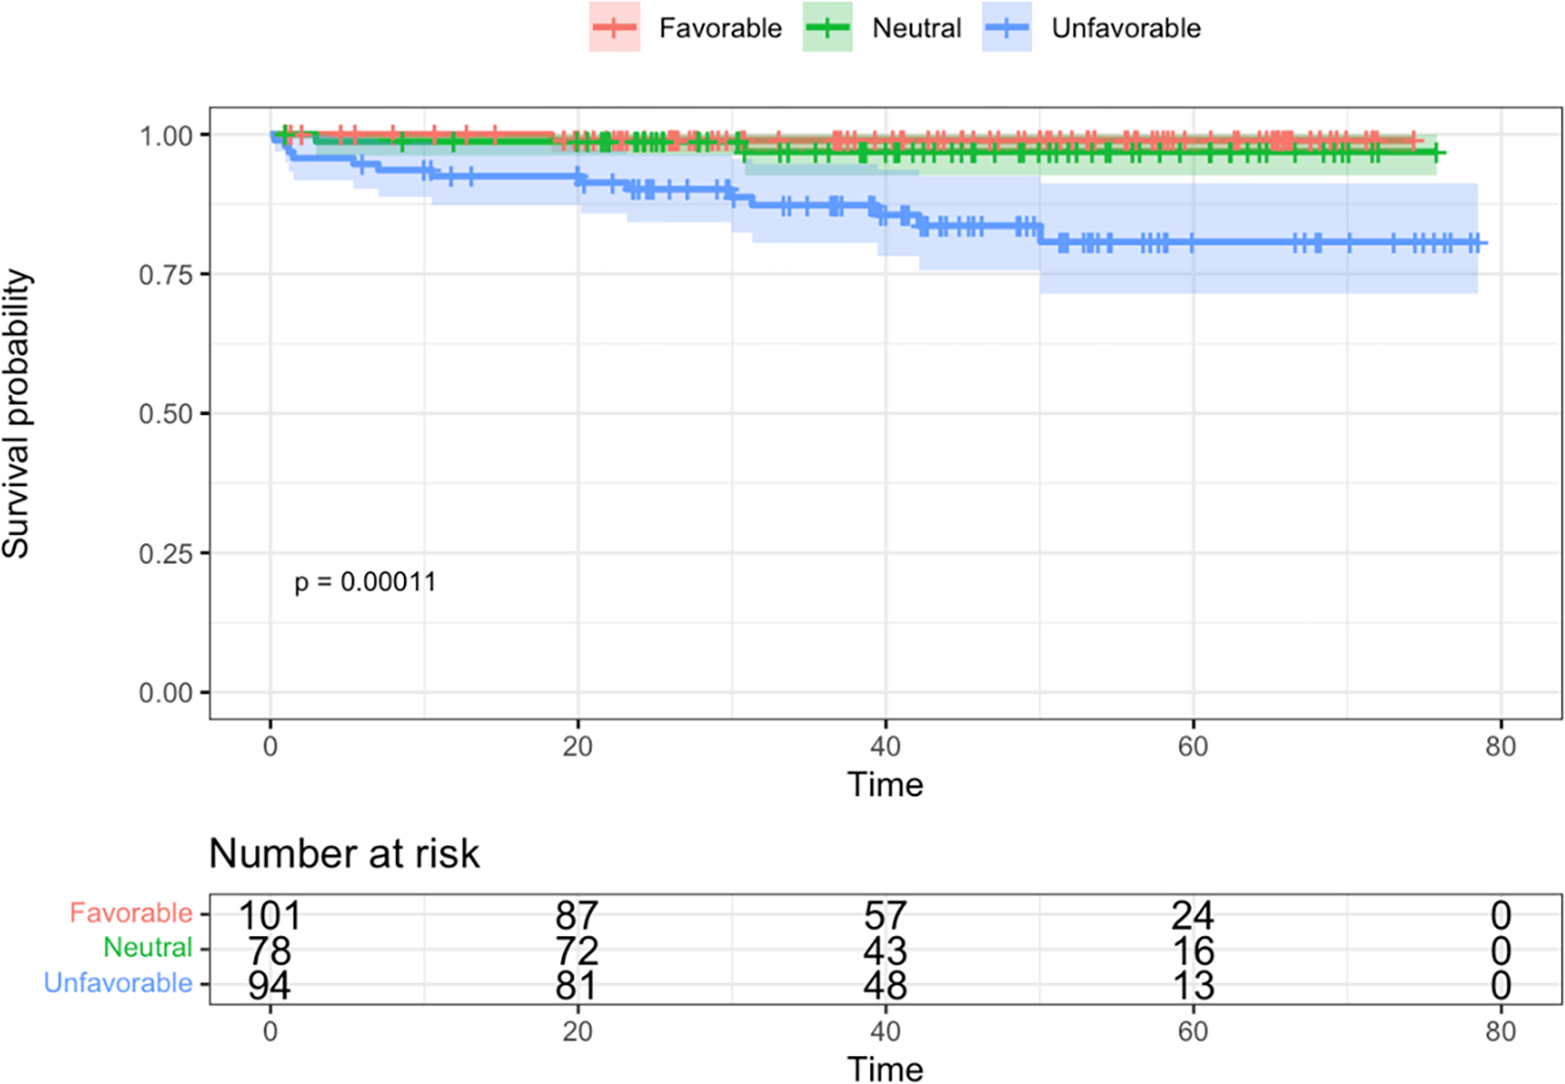
A. Event-free survival. B. Overall survival. Time is shown in months.
EFS and OS between EOI MRD levels among patients with IKZF1PLUS (N = 41, with one patient missing MRD status) are depicted in Figure 4. Due to small sample size and exploratory nature of this aim, we only performed log-rank tests to compare survival outcomes between MRD levels. However, these were not statistically significant (p = 0.29 and p = 0.07). Similarly, statistically significant differences were not identified among relapses.
Figure 4. Kaplan-Meier survival curves, with log-rank test, by minimal/measurable residual disease (MRD) at end of Induction (EOI).
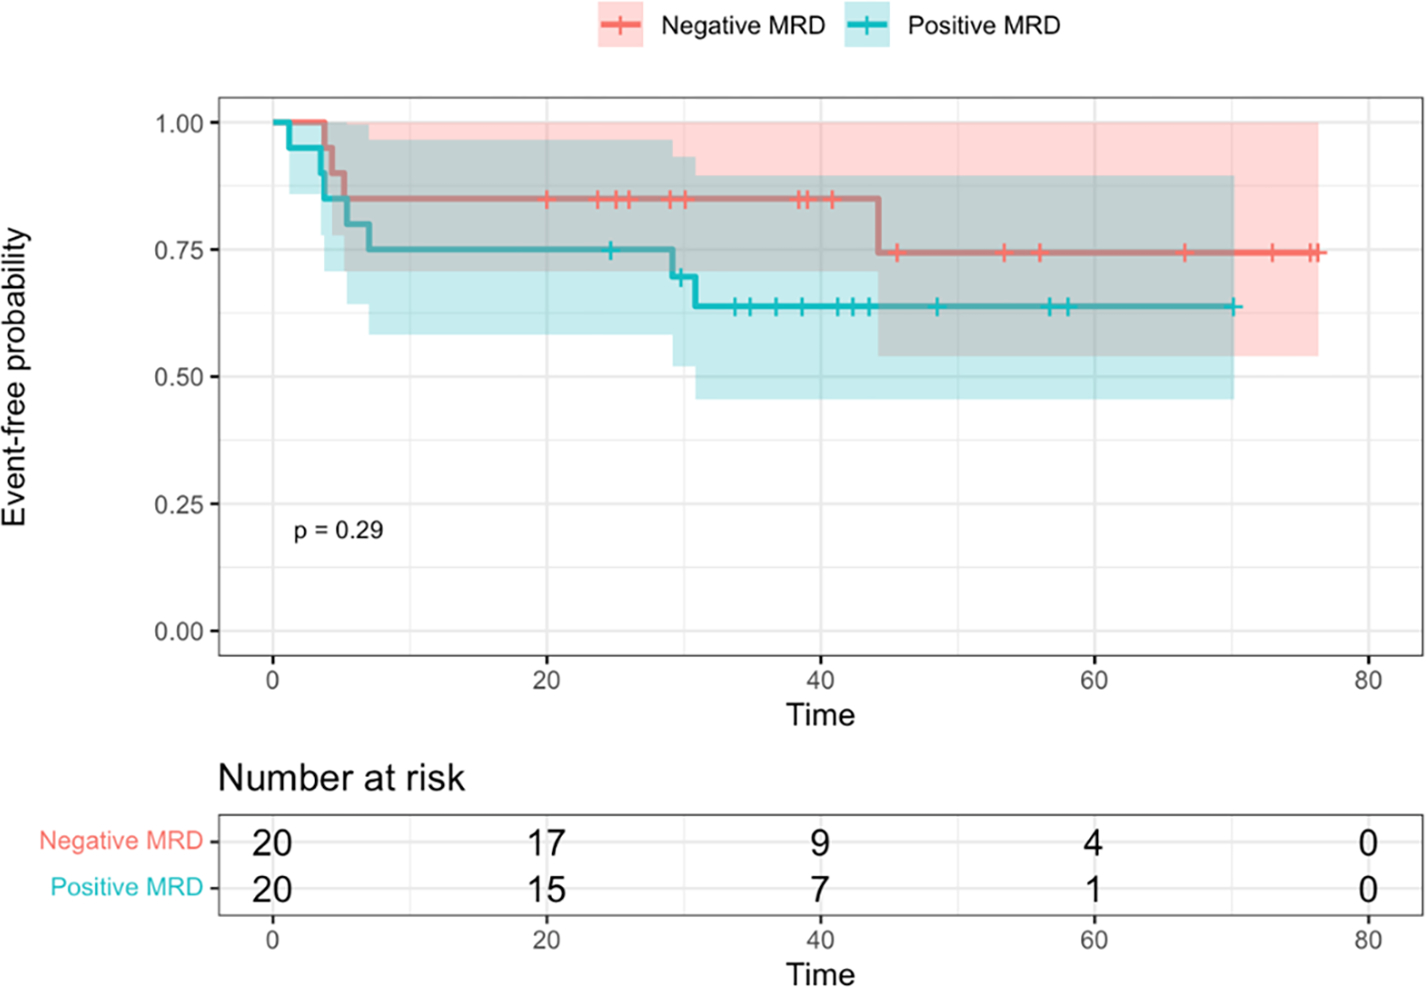
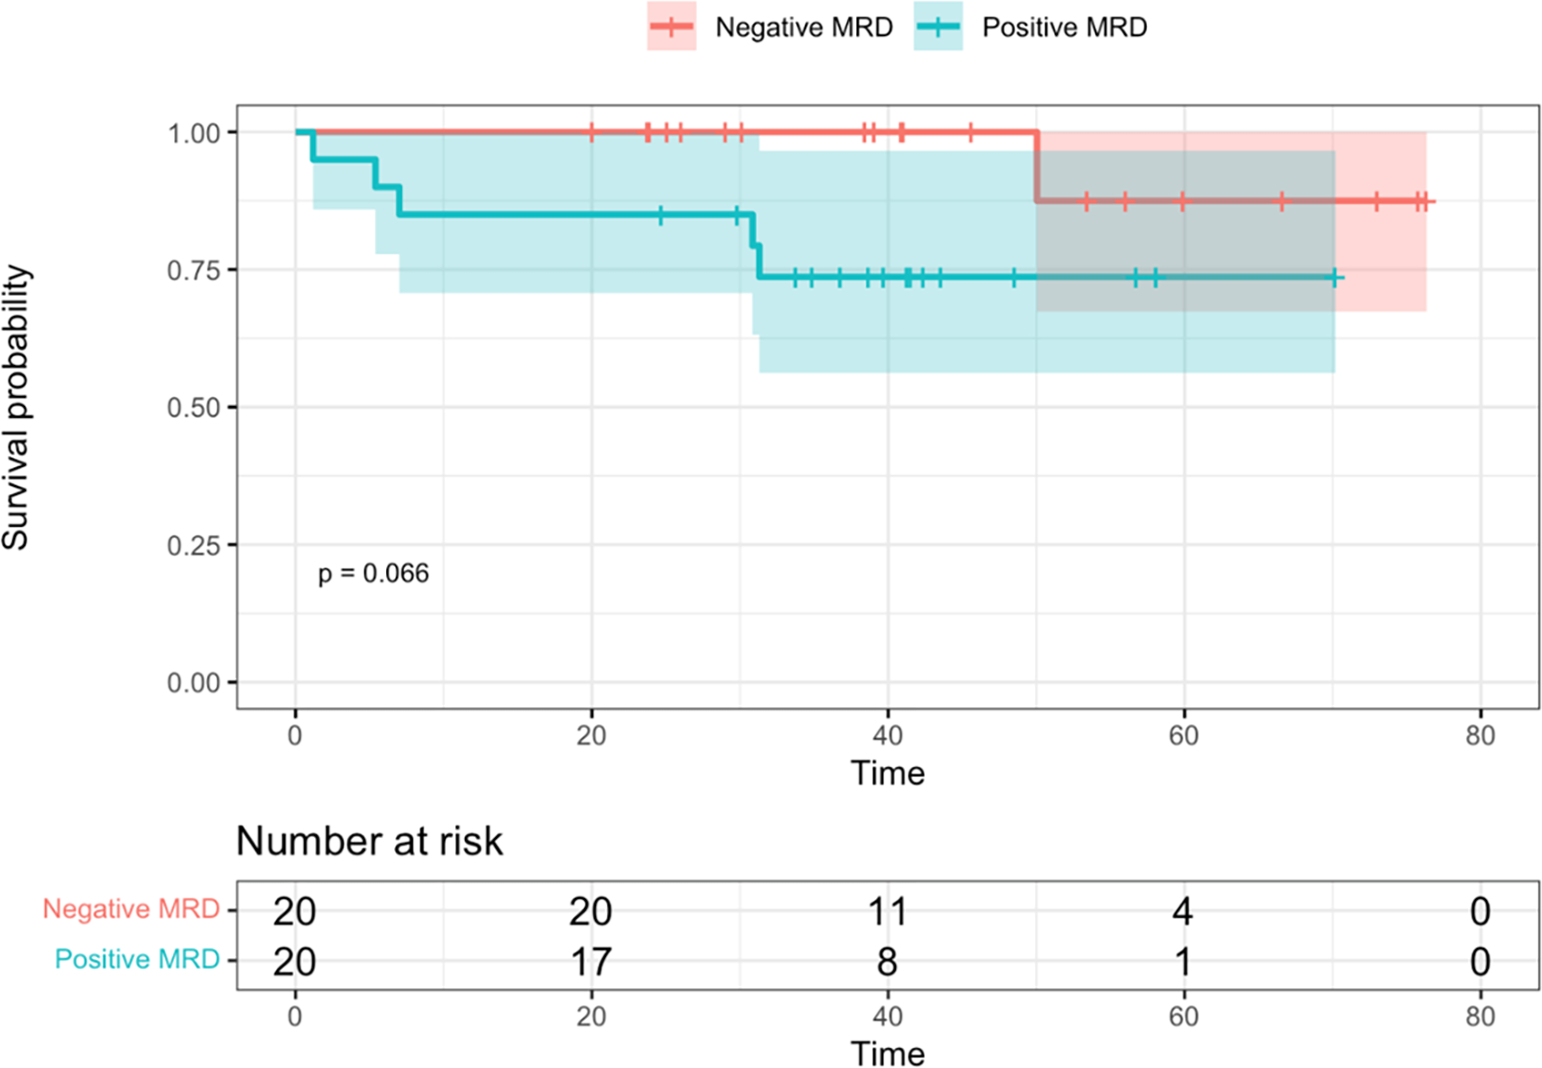
A. Event-free survival. B. Overall survival. Time is shown in months.
Discussion
The patient population at our tertiary pediatric referral center is significantly enriched for H/L ethnicity (approximately 70%), reflecting our catchment area and our safety-net hospital status. In this study, we have leveraged this patient population to identify novel genetic associations (including novel genetic drivers and secondary genetic alterations) that may further explain the disparity in outcomes in pediatric B-ALL observed among patients of H/L ethnicity.5,7–9,11 Novel targeted therapeutic approaches are in development for this high-risk subtype,27,35,36 and our findings may help provide pre-clinical evidence for their direction.
The association of IKZF1PLUS B-ALL with H/L ethnicity identified in our cohort is a novel finding and could additionally account for the ethnic disparity in ALL outcomes. IKZF1PLUS B-ALL is a relatively newly described category defined as IKZF1 deletions co-occurring with deletions in CDKN2A, CDKN2B, PAX5, or PAR1 in the absence of ERG deletion (ERG deletion being a sensitive and specific surrogate for DUX4 rearrangement). IKZF1PLUS carries a very poor prognosis, particularly for patients who are MRD positive at EOI.32
Similarly, a higher prevalence of IKZF1 deletion plus concomitant VPREB1 deletion in H/L patients (11.1% vs. 6%), while not statistically significant in our cohort, it does raise consideration for this combination of genetic features contributing to the worse prognosis observed in H/L B-ALL patients overall. The association we found expands on the data reported by Mangum et al22 of an association between unfavorable outcome and combined VPREB1 (focal 22q11.22) deletion and IKZF1 alterations in pediatric B-ALL. Our relatively small cohort size (N=273, all B-ALL subtypes) could explain the lack of statistical significance compared to that identified by Mangum et al (n=1310, predominantly high-risk disease).
A particular strength of the current study is comprehensive analysis of secondary (non-driver) genetic alterations identified through clinical testing by our institutional OncoKids® DNA and RNA NGS panel29 paired with CMA (OncoScan) copy number assessment and conventional cytogenetics.28 Our data corroborate existing reports that somatic CDKN2A/2B deletions in B-ALL are associated with relapse and overall inferior prognosis irrespective of patient age.37–39 The kinase inhibitors encoded by the CDKN2A/2B, tumor suppressors that regulate cell cycle, are mutated across many cancer types40 and may be amenable to pharmacologic modification in the future.41 Additionally, our study identified KRAS mutation as enriched in B-ALL of patients of H/L ethnicity compared to those of non-H/L ethnicity. Like CDKN2A/2B deletions, KRAS mutations are the most common oncogenic alterations across cancer types, and are recognized as frequent alterations in subsets of B-ALL. Ras pathway abnormalities are reported in 6% of B-ALL42 and are emerging as targets of immunotherapeutic approaches.43
Ethnic differences are known to underlie pathophysiology, subclassification and prognosis in pediatric B-ALL across genetic ancestries.10 Indeed, Lee et al aggregated the results of cooperative group trials from around the world to show significant associations between DUX4 and ZNF384 rearrangements and East Asian ancestry, CRLF2 rearrangement and Native American ancestry, and T-cell phenotype (T-ALL) with African ancestry.10 However, that large study was not proportionally enriched for H/L ethnicity (21.4% Hispanic patients, drawn from COG, St. Jude and Guatemalan cohorts), and despite a large absolute number of Hispanic patients (n=520), the authors note that their Hispanic study population is particularly diverse with genetic subpopulations, similar to the genetic subpopulations observed among Native Americans,44 precluding specific genetic associations.10 Nevertheless, Hispanic patients in that study showed the most inferior EFS, OS and cumulative incidence of relapse among all ethnic groups in the cohort.10
Limitations of our study include its retrospective nature and a relatively small cohort size. In addition, ethnicity data consisted of self-reported race; we did not have access to genetic sequencing data from which to infer ethnicity. As noted in Lee et al, H/L populations are highly diverse compared to some others.10,44 Another limitation is the relatively short clinical follow-up interval, particularly for patients diagnosed in the latter part of the study period (2020) among whom any late relapses are not captured in the current study.
In summary, we report a novel association of the IKZF1PLUS profile in pediatric B-ALL patients of Hispanic/Latino ethnicity, as well as confirmatory associations with enrichment of IGH::CRLF2 rearrangement and IKFZ1 with or without IGH::CRLF2 rearrangement, raising consideration for novel therapeutic strategies in this high-risk group.
Supplementary Material
Supplementary Table 2. Genetic characteristics of IKZF1PLUS patients
H/L = Hispanic/Latino.
Supplementary Table 1. Multivariate regression model with age and presenting white blood cell count (WBC), components of the NCI risk classification
A. Overall cohort. B. Hispanic patients. C. Non-Hispanic patients.
Acknowledgements
This study was supported by an Interdisciplinary Research (IR) Grant through the Children’s Hospital Los Angeles (CHLA) Department of Pathology and Laboratory Medicine (PLM) Translational Research Fund. An abstract of the data was presented by M.W. on Monday, August 14, 2023 in an oral platform session at the Cancer Genomics Consortium (CGC) 14th Annual Meeting in St. Louis, MO. M.W. was a fellow in the USC/CHLA Summer Oncology Research Fellowship (SORF) Program, supported in part by a National Cancer Institute R25 grant CA225513, the Norris Comprehensive Cancer Center in Los Angeles, Children’s Hospital Los Angeles, Concern Foundation for Cancer Research, and Tri Delta.
Footnotes
Conflict of Interest Statement
The authors have no relevant conflicts of interest.
References
- 1.B-lymphoblastic leukemia/lymphoma, NOS. In: National Cancer Institute (NCI) Surveillance EaERPS, ed2023. [Google Scholar]
- 2.Cancer Stat Facts: Leukemia — Acute Lymphocytic Leukemia (ALL). https://seer.cancer.gov/statfacts/html/alyl.html. Accessed July 17, 2023.
- 3.Ribera JM, Oriol A. Acute lymphoblastic leukemia in adolescents and young adults. Hematol Oncol Clin North Am. 2009;23(5):1033–1042, vi. [DOI] [PubMed] [Google Scholar]
- 4.Hunger SP, Lu X, Devidas M, et al. Improved survival for children and adolescents with acute lymphoblastic leukemia between 1990 and 2005: a report from the children’s oncology group. J Clin Oncol. 2012;30(14):1663–1669. [DOI] [PMC free article] [PubMed] [Google Scholar]
- 5.American Cancer Society. Cancer Facts and Figures for Hispanics/Latinos 2018–20. chrome-extension://efaidnbmnnnibpcajpcglclefindmkaj/ https://www.cancer.org/content/dam/cancer-org/research/cancer-facts-and-statistics/cancer-facts-and-figures-for-hispanics-and-latinos/cancer-facts-and-figures-for-hispanics-and-latinos-2018-2020.pdf. Accessed: August 21, 2023.
- 6.Giddings BM, Whitehead TP, Metayer C, Miller MD. Childhood leukemia incidence in California: High and rising in the Hispanic population. Cancer. 2016;122(18):2867–2875. [DOI] [PMC free article] [PubMed] [Google Scholar]
- 7.McNeil DE, Coté TR, Clegg L, Mauer A. SEER update of incidence and trends in pediatric malignancies: acute lymphoblastic leukemia. Med Pediatr Oncol. 2002;39(6):554–557; discussion 552–553. [DOI] [PubMed] [Google Scholar]
- 8.Kahn JM, Keegan TH, Tao L, Abrahão R, Bleyer A, Viny AD. Racial disparities in the survival of American children, adolescents, and young adults with acute lymphoblastic leukemia, acute myelogenous leukemia, and Hodgkin lymphoma. Cancer. 2016;122(17):2723–2730. [DOI] [PMC free article] [PubMed] [Google Scholar]
- 9.Kehm RD, Spector LG, Poynter JN, Vock DM, Altekruse SF, Osypuk TL. Does socioeconomic status account for racial and ethnic disparities in childhood cancer survival? Cancer. 2018;124(20):4090–4097. [DOI] [PMC free article] [PubMed] [Google Scholar]
- 10.Lee SHR, Antillon-Klussmann F, Pei D, et al. Association of Genetic Ancestry With the Molecular Subtypes and Prognosis of Childhood Acute Lymphoblastic Leukemia. JAMA oncology. 2022;8(3):354–363. [DOI] [PMC free article] [PubMed] [Google Scholar]
- 11.Bhatia S, Landier W, Shangguan M, et al. Nonadherence to oral mercaptopurine and risk of relapse in Hispanic and non-Hispanic white children with acute lymphoblastic leukemia: a report from the children’s oncology group. J Clin Oncol. 2012;30(17):2094–2101. [DOI] [PMC free article] [PubMed] [Google Scholar]
- 12.Bhojwani D, Yang JJ, Pui CH. Biology of childhood acute lymphoblastic leukemia. Pediatr Clin North Am. 2015;62(1):47–60. [DOI] [PMC free article] [PubMed] [Google Scholar]
- 13.Alaggio R, Amador C, Anagnostopoulos I, et al. The 5th edition of the World Health Organization Classification of Haematolymphoid Tumours: Lymphoid Neoplasms. Leukemia. 2022;36(7):1720–1748. [DOI] [PMC free article] [PubMed] [Google Scholar]
- 14.Arber DA, Orazi A, Hasserjian RP, et al. International Consensus Classification of Myeloid Neoplasms and Acute Leukemias: integrating morphologic, clinical, and genomic data. Blood. 2022;140(11):1200–1228. [DOI] [PMC free article] [PubMed] [Google Scholar]
- 15.Roberts KG, Mullighan CG. The Biology of B-Progenitor Acute Lymphoblastic Leukemia. Cold Spring Harb Perspect Med. 2020;10(7). [DOI] [PMC free article] [PubMed] [Google Scholar]
- 16.Mullighan CG. How advanced are we in targeting novel subtypes of ALL? Best Pract Res Clin Haematol. 2019;32(4):101095. [DOI] [PMC free article] [PubMed] [Google Scholar]
- 17.Pui CH, Campana D. New definition of remission in childhood acute lymphoblastic leukemia. Leukemia. 2000;14(5):783–785. [DOI] [PubMed] [Google Scholar]
- 18.Ampatzidou M, Papadhimitriou SI, Paterakis G, et al. ETV6/RUNX1-positive childhood acute lymphoblastic leukemia (ALL): The spectrum of clonal heterogeneity and its impact on prognosis. Cancer Genet. 2018;224–225:1–11. [DOI] [PubMed] [Google Scholar]
- 19.Kimura S, Mullighan CG. Molecular markers in ALL: Clinical implications. Best Pract Res Clin Haematol. 2020;33(3):101193. [DOI] [PMC free article] [PubMed] [Google Scholar]
- 20.Iacobucci I, Kimura S, Mullighan CG. Biologic and Therapeutic Implications of Genomic Alterations in Acute Lymphoblastic Leukemia. J Clin Med. 2021;10(17). [DOI] [PMC free article] [PubMed] [Google Scholar]
- 21.Iacobucci I, Roberts KG. Genetic Alterations and Therapeutic Targeting of Philadelphia-Like Acute Lymphoblastic Leukemia. Genes (Basel). 2021;12(5). [DOI] [PMC free article] [PubMed] [Google Scholar]
- 22.Mangum DS, Meyer JA, Mason CC, et al. Association of Combined Focal 22q11.22 Deletion and IKZF1 Alterations With Outcomes in Childhood Acute Lymphoblastic Leukemia. JAMA oncology. 2021;7(10):1521–1528. [DOI] [PMC free article] [PubMed] [Google Scholar]
- 23.Den Boer ML, van Slegtenhorst M, De Menezes RX, et al. A subtype of childhood acute lymphoblastic leukaemia with poor treatment outcome: a genome-wide classification study. Lancet Oncol. 2009;10(2):125–134. [DOI] [PMC free article] [PubMed] [Google Scholar]
- 24.Othman MAK, Đurišić M, Samardzija G, et al. Complex karyotype with cryptic FUS gene rearrangement and deletion of NR3C1 and VPREB1 genes in childhood B-cell acute lymphoblastic leukemia: A case report. Oncol Lett. 2020;19(4):2957–2962. [DOI] [PMC free article] [PubMed] [Google Scholar]
- 25.Raca G, Abdel-Azim H, Yue F, et al. Increased Incidence of IKZF1 deletions and IGH-CRLF2 translocations in B-ALL of Hispanic/Latino children-a novel health disparity. Leukemia. 2021;35(8):2399–2402. [DOI] [PMC free article] [PubMed] [Google Scholar]
- 26.Angiolillo AL, Schore RJ, Kairalla JA, et al. Excellent Outcomes With Reduced Frequency of Vincristine and Dexamethasone Pulses in Standard-Risk B-Lymphoblastic Leukemia: Results From Children’s Oncology Group AALL0932. J Clin Oncol. 2021;39(13):1437–1447. [DOI] [PMC free article] [PubMed] [Google Scholar]
- 27.Salzer WL, Burke MJ, Devidas M, et al. Impact of Intrathecal Triple Therapy Versus Intrathecal Methotrexate on Disease-Free Survival for High-Risk B-Lymphoblastic Leukemia: Children’s Oncology Group Study AALL1131. J Clin Oncol. 2020;38(23):2628–2638. [DOI] [PMC free article] [PubMed] [Google Scholar]
- 28.Hiemenz MC, Oberley MJ, Doan A, et al. A multimodal genomics approach to diagnostic evaluation of pediatric hematologic malignancies. Cancer Genet. 2021;254–255:25–33. [DOI] [PubMed] [Google Scholar]
- 29.Hiemenz MC, Ostrow DG, Busse TM, et al. OncoKids: A Comprehensive Next-Generation Sequencing Panel for Pediatric Malignancies. J Mol Diagn. 2018;20(6):765–776. [DOI] [PubMed] [Google Scholar]
- 30.FIRTH D Bias reduction of maximum likelihood estimates. Biometrika. 1993;80(1):27–38. [Google Scholar]
- 31.Benjamini Y, Hochberg Y. Controlling The False Discovery Rate - A Practical And Powerful Approach To Multiple Testing. J Royal Statist Soc, Series B. 1995;57:289–300. [Google Scholar]
- 32.Stanulla M, Dagdan E, Zaliova M, et al. IKZF1(plus) Defines a New Minimal Residual Disease-Dependent Very-Poor Prognostic Profile in Pediatric B-Cell Precursor Acute Lymphoblastic Leukemia. J Clin Oncol. 2018;36(12):1240–1249. [DOI] [PubMed] [Google Scholar]
- 33.Kicinski M, Arfeuille C, Grardel N, et al. The prognostic value of IKZF1(plus) in B-cell progenitor acute lymphoblastic leukemia: Results from the EORTC 58951 trial. Pediatr Blood Cancer. 2023;70(6):e30313. [DOI] [PubMed] [Google Scholar]
- 34.Palmi C, Bresolin S, Junk S, et al. Definition and Prognostic Value of Ph-like and IKZF1plus Status in Children With Down Syndrome and B-cell Precursor Acute Lymphoblastic Leukemia. Hemasphere. 2023;7(6):e892. [DOI] [PMC free article] [PubMed] [Google Scholar]
- 35.Qin H, Cho M, Haso W, et al. Eradication of B-ALL using chimeric antigen receptor-expressing T cells targeting the TSLPR oncoprotein. Blood. 2015;126(5):629–639. [DOI] [PMC free article] [PubMed] [Google Scholar]
- 36.Harvey RC, Tasian SK. Clinical diagnostics and treatment strategies for Philadelphia chromosome-like acute lymphoblastic leukemia. Blood Adv. 2020;4(1):218–228. [DOI] [PMC free article] [PubMed] [Google Scholar]
- 37.Ampatzidou M, Papadhimitriou SI, Paisiou A, et al. The Prognostic Effect of CDKN2A/2B Gene Deletions in Pediatric Acute Lymphoblastic Leukemia (ALL): Independent Prognostic Significance in BFM-Based Protocols. Diagnostics (Basel, Switzerland). 2023;13(9). [DOI] [PMC free article] [PubMed] [Google Scholar]
- 38.Kathiravan M, Singh M, Bhatia P, et al. Deletion of CDKN2A/B is associated with inferior relapse free survival in pediatric B cell acute lymphoblastic leukemia. Leuk Lymphoma. 2019;60(2):433–441. [DOI] [PubMed] [Google Scholar]
- 39.Zhang W, Kuang P, Liu T. Prognostic significance of CDKN2A/B deletions in acute lymphoblastic leukaemia: a meta-analysis. Ann Med. 2019;51(1):28–40. [DOI] [PMC free article] [PubMed] [Google Scholar]
- 40.CDKN2A cyclin dependent kinase inhibitor 2A [ Homo sapiens (human) ]. NIH National Library of Medicine - National Center for Biotechnology Information (NCBI). [Google Scholar]
- 41.Kato S, Okamura R, Adashek JJ, et al. Targeting G1/S phase cell-cycle genomic alterations and accompanying co-alterations with individualized CDK4/6 inhibitor-based regimens. JCI insight. 2021;6(1). [DOI] [PMC free article] [PubMed] [Google Scholar]
- 42.Reshmi SC, Harvey RC, Roberts KG, et al. Targetable kinase gene fusions in high-risk B-ALL: a study from the Children’s Oncology Group. Blood. 2017;129(25):3352–3361. [DOI] [PMC free article] [PubMed] [Google Scholar]
- 43.Huang L, Guo Z, Wang F, Fu L. KRAS mutation: from undruggable to druggable in cancer. Signal Transduction and Targeted Therapy. 2021;6(1):386. [DOI] [PMC free article] [PubMed] [Google Scholar]
- 44.Wang S, Lewis CM, Jakobsson M, et al. Genetic variation and population structure in native Americans. PLoS Genet. 2007;3(11):e185. [DOI] [PMC free article] [PubMed] [Google Scholar]
Associated Data
This section collects any data citations, data availability statements, or supplementary materials included in this article.
Supplementary Materials
Supplementary Table 2. Genetic characteristics of IKZF1PLUS patients
H/L = Hispanic/Latino.
Supplementary Table 1. Multivariate regression model with age and presenting white blood cell count (WBC), components of the NCI risk classification
A. Overall cohort. B. Hispanic patients. C. Non-Hispanic patients.


