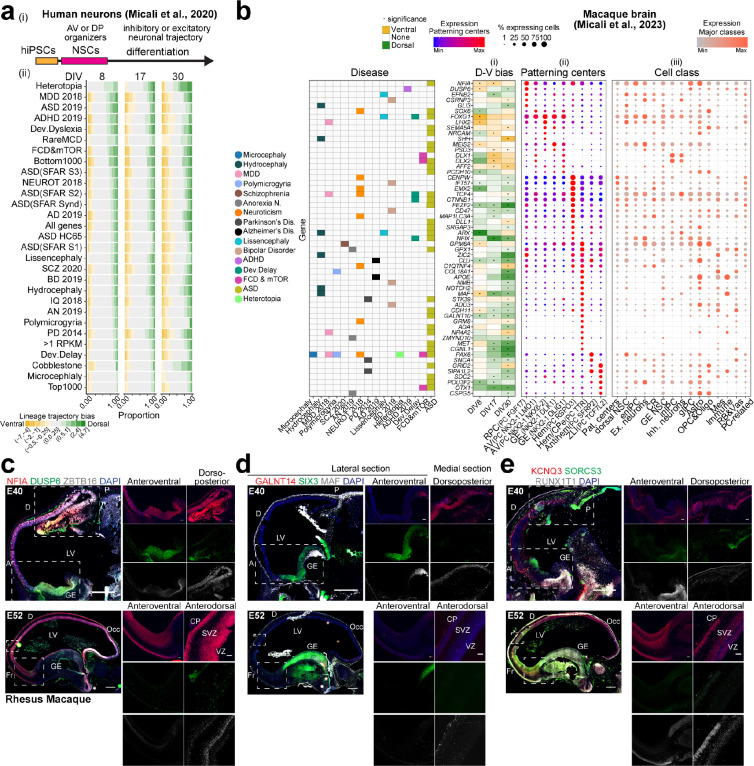
Fig. 2. Expression of risk genes in brain organizers.
a) (i) Neuronal differentiation protocol. (ii) Proportion of disease-associated genes with dorsal or ventral bias across differentiation of the 6 hNSC lines 40. Fold change between dorsal and ventral expression binned in categories. All genes, RPKM>1, top and bottom 1000 categories as in Fig. 1. b) (i) PC markers with dorsal or ventral expression bias in the 6 hNSC lines at DIV 8–30 and (ii-iii) gene expression in (ii) PC clusters and (iii) other cell subtypes from the macaque dataset 37. Filtered PC markers with significant dorsoventral bias and disease association (left panel) are displayed. c-e) RNAscope of macaque sagittal fetal brains. Scale bar: 500 μm (panoramic), 100 μm (zoom-in).

