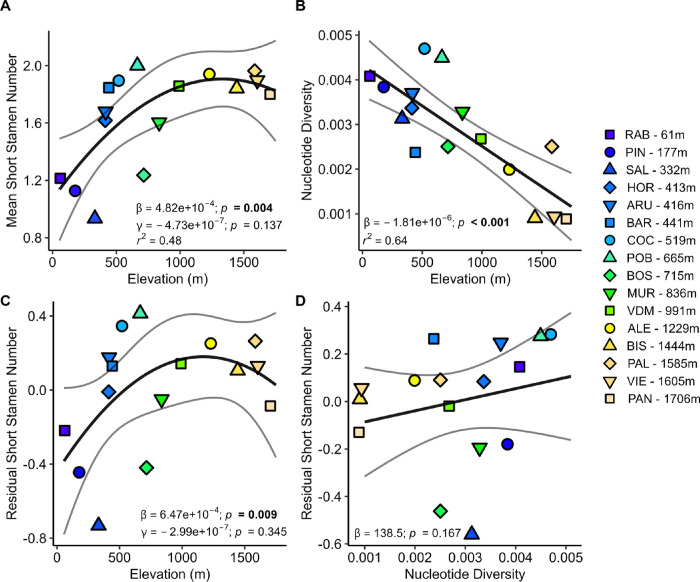
Figure 2: Effective population size does not explain retention of short stamens at high elevation.
A) Mean short stamen number shows a quadratic elevational cline. B) Elevation strongly predicts population mean pairwise nucleotide diversity, our measure of effective population size. C) The residuals of the model of short stamen number regressed on nucleotide diversity then regressed on elevation and D) the residuals of the model of short stamen number regressed on quadratic elevation then regressed on nucleotide diversity. In C and D, statistics from the full model (r2 = 0.50; Table S3) are displayed on the figures. In all panels, the color of each point represents the population elevation, black lines are the regression, and grey lines are 95% confidence intervals.

