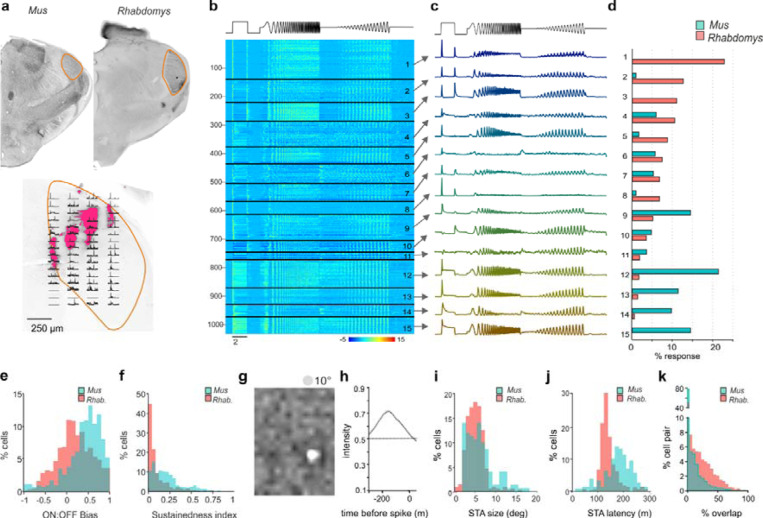
Figure 1. dLGN response diversity in Mus and Rhabdomys.
a) Above: coronal sections from Mus and Rhabdomys with dLGN highlighted with orange edging. Below: Histological reconstruction of recording sites in Rhabdomys dLGN. Fluorescence shows dii markings remaining after electrode insertion. Peristimulus time histograms (PSTHs) representing multiunit light-evoked activity recorded at each recording site overlayed (2s light step with 1s pre and post stimulus). All data are scaled according to their maximum firing rate. b) Heat map showing normalised PSTHs of dLGN neurons as a function of response cluster (labelled to right), organised as a function of number of Rhabdomys responses. Stimulus profile denoted above. c) Mean response profile of normalised responses from each cluster (combined across species). Stimulus profile denoted above. d) Bar graphs showing proportion of responses within each cluster, for each species (Mus: cyan, Rhabdomys: red). e) Histogram of ON:OFF bias in Mus (cyan) and Rhabdomys (red). f) Histogram of sustainedness index in Mus (cyan) and Rhabdomys (red). g&h) Example spatial (g) and temporal (h) spike triggered averages recorded in response to binary noise stimulus. i) Histogram of receptive field sizes in Mus (cyan) and Rhabdomys (red); Kolmogorov-Smirnov test P=0.036. j) Histogram of receptive field latency (time of peak absolute response) in Mus (cyan) and Rhabdomys (red); Kolmogorov-Smirnov test: P<0.001. k) Histogram of receptive field overlap between pairs of neurons recorded in Mus (cyan) and Rhabdomys (red); Kolmogorov-Smirnov test: P<0.001.

