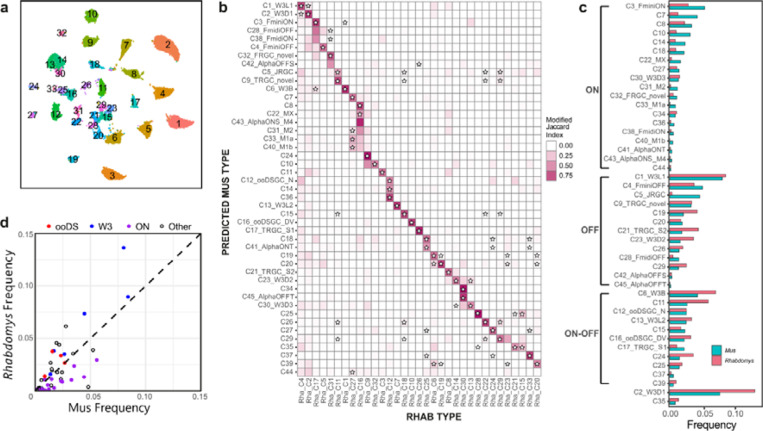
Figure 7. Proportions of RGC types in Rhabdomys and Mus.
a) Rhabdomys RGCs were clustered separately and displayed using UMAP. Cells are coloured by cluster identity. b) Confusion matrix indicating the transcriptional correspondence between Rhabdomys RGC cluster identity (columns) and Mus RGC type identity (rows). Cells are coloured based on the modified Jaccard Index (colourbar, right), as in panel 6b. Stars indicate pairs of Rhabdomys clusters and Mus types that belong to the same orthotype in 24. This figure shows results of a classifier trained on Rhabdomys data. Correspondence was similar when the classifier was trained on Mus data. c) Bar graph showing the relative frequency of each Mus RGC type in both the species. Types are grouped by response polarity – ON, OFF or ON-OFF – based on results in 21,27–29. Percentages for biological replicates are shown in Supplementary Table 3. d) Scatter plot comparing relative frequency of RGC types between Rhabdomys and Mus. Response polarity is as shown in c. All 6 types of the W3 subclass21,31 are more abundant in Rhabdomys than Mus.

