Abstract
Once fertilized, mouse zygotes rapidly proceed to zygotic genome activation (ZGA), during which long terminal repeats (LTRs) of murine endogenous retroviruses with leucine tRNA primer (MERVL) are activated by a conserved homeodomain-containing transcription factor, DUX. However, Dux-knockout embryos produce fertile mice, suggesting that ZGA is redundantly driven by an unknown factor(s). Here, we present multiple lines of evidence that the multicopy homeobox gene, Obox4, encodes a transcription factor that is highly expressed in mouse two-cell embryos and redundantly drives ZGA. Genome-wide profiling revealed that OBOX4 specifically binds and activates MERVL LTRs as well as a subset of murine endogenous retroviruses with lysine tRNA primer (MERVK) LTRs. Depletion of Obox4 is tolerated by embryogenesis, whereas concomitant Obox4/Dux depletion markedly compromises embryonic development. Our study identified OBOX4 as a transcription factor that provides genetic redundancy to preimplantation development.
Research organism: Mouse
Introduction
The mechanism by which zygotes acquire totipotency is a major question in developmental biology. Following fertilization, the zygote must build a de novo conceptus with a transcriptionally quiescent genome. The genome rapidly undergoes zygotic genome activation (ZGA), during which epigenetic reprogramming and expression of nascent transcripts enforce the replacement of parental infrastructures by their zygotic counterparts (Lee et al., 2014). Completion of metazoan ZGA results in blastomeres, a collection of cells that are totipotent enough to reflect their potential to individually produce both embryos and extraembryonic appendages (Tarkowski, 1959a; Tarkowski, 1959b). Totipotency lasts until the first cell fate decision takes place, following which it is remolded into pluripotency in cells destined for the embryonic lineage (Suwińska et al., 2008), to which embryonic stem cells (ESCs) and induced pluripotent stem cells (iPSCs) correspond. In placental mammals, ZGA is characterized by the massive reactivation of transposable elements (TEs) and epigenome remodeling, predominantly implemented by a collection of ZGA genes that have adapted long terminal repeats (LTRs) of endogenous retroviruses (ERVs) as stage-specific cis-regulatory elements (Svoboda et al., 2004).
Homeodomains are DNA-binding amino acid motifs encoded by a class of conserved genomic sequences termed homeoboxes (McGinnis et al., 1984b; Carrasco et al., 1984; McGinnis et al., 1984a). Homeodomains are prevalent transcription factors that regulate development because of their ability to bind chromatin in a sequence-specific manner (Scott and Weiner, 1984; Gehring and Hiromi, 1986; Gehring, 1987). Among all homeobox-containing genes, Paired-like (PRD-like) homeobox class genes are particularly associated with ZGA (Lewin et al., 2021). Studies have shown that the PRD-like homeobox gene, double homeobox (Dux), plays an important role in preimplantation embryogenesis (Töhönen et al., 2015; Madissoon et al., 2016). Dux is conserved throughout placentalia and is highly expressed during ZGA. In humans and mice, DUX specifically binds and activates endogenous retroviruses with leucine tRNA primer (ERVL) LTR-derived promoters, resulting in the expression of downstream ZGA genes (De Iaco et al., 2017; Hendrickson et al., 2017; Whiddon et al., 2017). Dux expression induces a two-cell-embryo-like (2C-like) state in mouse embryonic stem cells (mESCs) (De Iaco et al., 2017; Hendrickson et al., 2017; Whiddon et al., 2017), whereas Dux-knockout (KO) undermines mouse blastocyst formation (De Iaco et al., 2017). However, subsequent studies have revealed that mouse embryogenesis is compatible with the loss of Dux, suggesting a redundant pathway of ZGA that is controlled by uncharacterized transcription factor(s) (Chen and Zhang, 2019; Guo et al., 2019; De Iaco et al., 2020; Bosnakovski et al., 2021).
In this study, we sought to identify the redundant transcription factor that drives ZGA in the absence of Dux. We discovered that the multicopy homeobox gene, oocyte-specific homeobox 4 (Obox4), promotes Dux-less ZGA. Obox4 is abundantly expressed in mouse 2C-embryos, 2C-like mESCs, and totipotent blastomere-like cells (TBLCs) (Shen et al., 2021). Mechanistically, OBOX4 promotes ZGA by binding to the LTRs of murine endogenous retroviruses with leucine tRNA primer (MERVL) and murine endogenous retroviruses with lysine tRNA primer (MERVK), and thereby affecting the deposition of active epigenetic modifications. Concomitant, but not respective, depletion of Obox4 and Dux severely compromises ZGA and preimplantation development. Taken together, our findings substantiate a preimplantation development model, in which the ZGA is redundantly promoted by Dux and Obox4.
Results
Expression profiling identifies transcription factor candidates
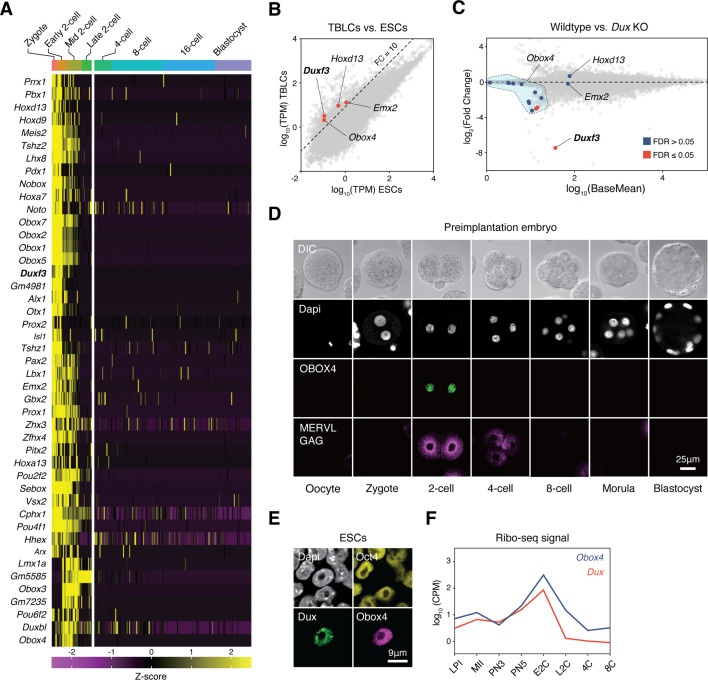
Genetic redundancy is commonly observed among genes that share sequence homology (Wagner, 1996). Because Dux is a homeobox gene, we speculated that its redundant factors are homeobox genes. We examined the expression profiles of all mouse homeobox genes during preimplantation embryogenesis using published single-cell RNA-seq (scRNA-seq) data (Deng et al., 2014). Clustering analysis defined a collection of 45 homeobox genes, whose transcript levels reached a maximum before the late 2C stage (Figure 1A). We then sought to identify bona fide ZGA factors from this collection by looking for genes whose transcripts were of zygotic origin, instead of ones that were parentally inherited. TBLCs have recently been established as an in vitro model of 2C-embryos, which are derived from splicing-inhibited mESCs, and hence, are free of parentally inherited transcripts (Shen et al., 2021). Analysis of published RNA sequencing (RNA-seq) data showed that the expression of four homeobox genes, Duxf3, Emx2, Hoxd13, and Obox4, was 10 times higher in TBLCs than in mESCs (Figure 1B). We examined whether the expression of these genes was affected in the Dux knockout embryos. Using published RNA-seq data (Chen and Zhang, 2019; De Iaco et al., 2020), we found that only the expression of the multicopy gene Obox4 was partially affected in Dux knockout embryos (Figure 1C).
Figure 1. OBOX4 is expressed during zygotic genome activation (ZGA).
(A) Mouse homeobox genes that are specifically expressed during ZGA. The genes were identified by means of statistically determined k-means clustering based on their expression in preimplantation embryos. Dux is shown in a bold italic font. (B) Scatterplot showing per-gene normalized read counts in mouse totipotent totipotent blastomere-like cells (TBLCs) versus mouse embryonic stem cells (mESCs). Genes with more than tenfold normalized read counts (FC = 10) have been highlighted. Dux is shown in a bold italic font. (C) MA plot displaying gene expression in Dux knockout 2C-embryos versus WT 2C-embryos. Loss of Dux partially downregulates the multicopy homeobox gene Obox4. (D) Immunofluorescence staining of OBOX4 and MERVL GAG at different preimplantation embryo stages. (E) Immunofluorescence staining of DUX, OBOX4, and OCT4 in 2C-like mESCs. (F) Translation profile of DUX and OBOX4 during preimplantation characterized by Ribo-seq signal.
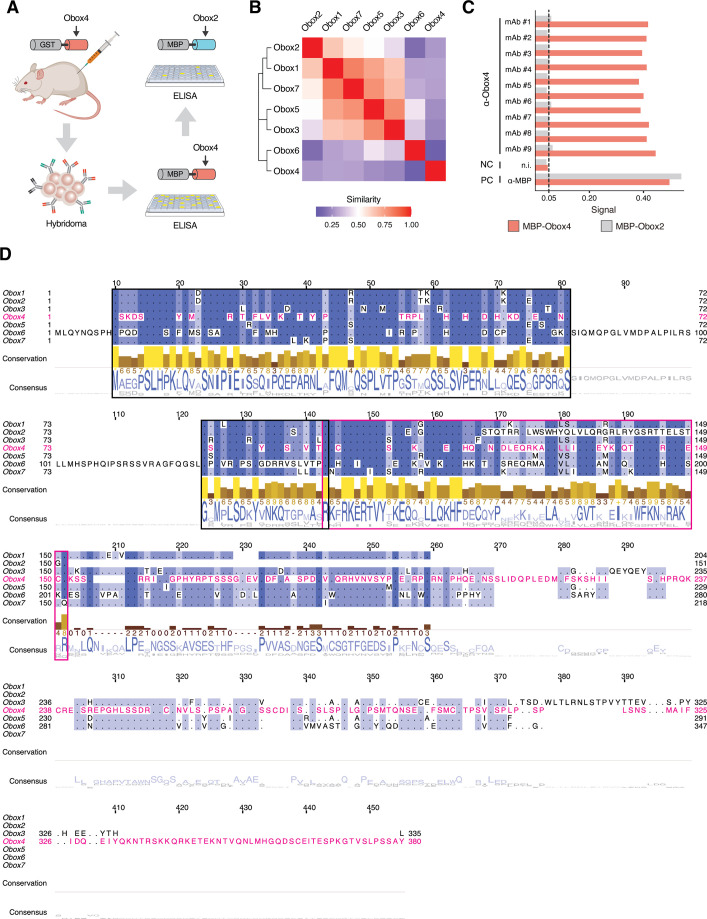
Figure 1—figure supplement 1. Production of anti-OBOX4 monoclonal antibodies.
Obox4 activates 2C-genes and TEs in mESCs
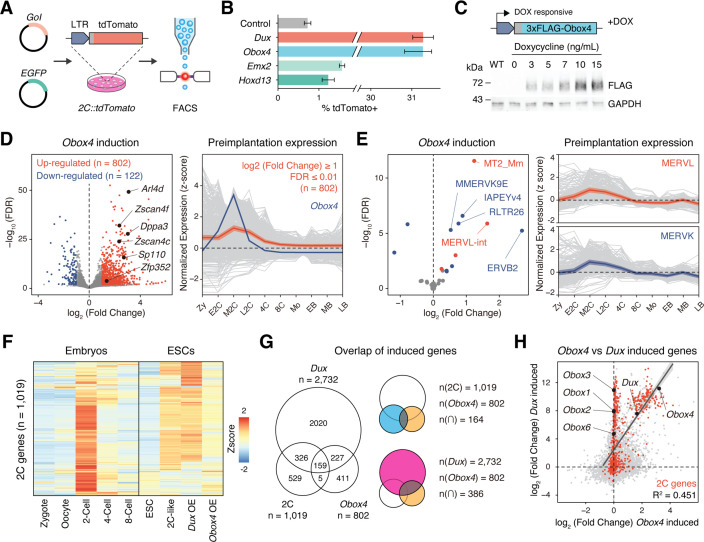
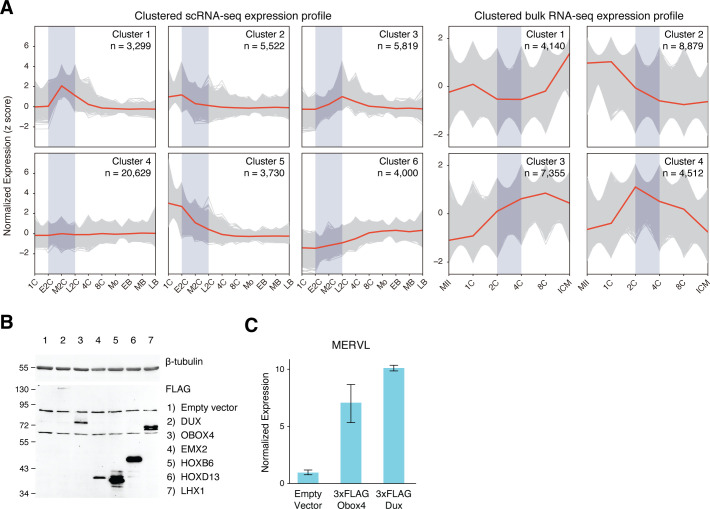
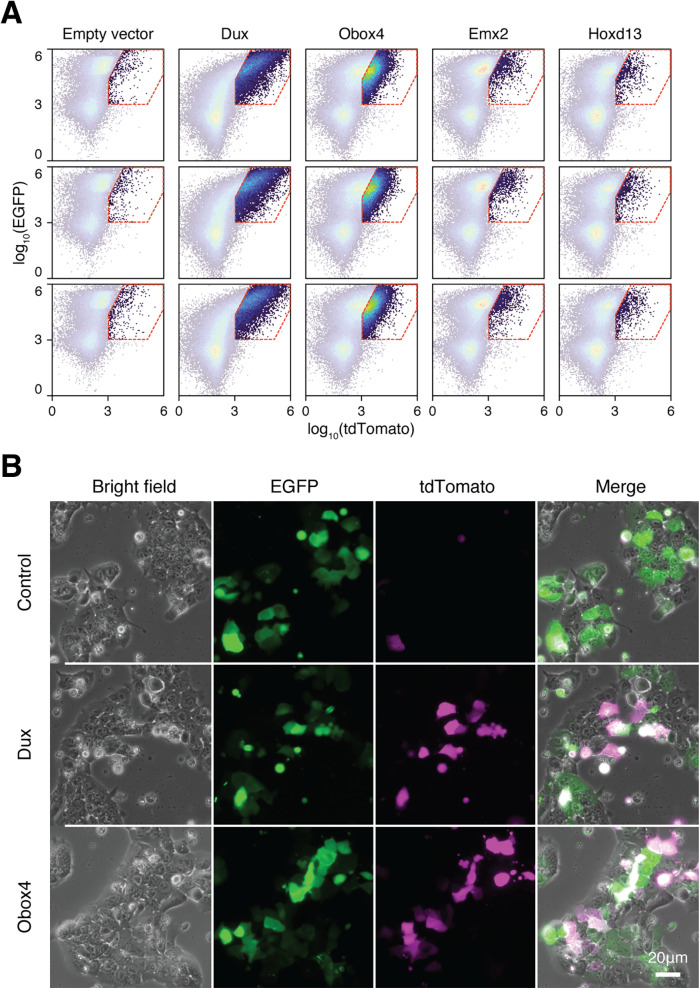
Before examining whether the candidates were crucial for embryogenesis, we first confirmed the presence of endogenous OBOX4 protein as the Obox4 loci are marked as pseudogenes in the current genome annotation GRCm39 (Yates et al., 2020). We generated mouse anti-OBOX4 monoclonal antibodies (Figure 1—figure supplement 1). Immunofluorescence staining using these antibodies confirmed that endogenous OBOX4 was expressed in zygotes and highly abundant in 2C-embryos and 2C-like mESCs (Figure 1D and E), which is consistent with translatome profiles captured by Ribo-seq that detects OBOX4 translation at the 2C stage (Xiong et al., 2022; Figure 1F). Mouse ZGA is characterized by the surging activity of genes that specifically express at the 2C stage (2C-gene), many of which have co-opted MT2_Mm, the LTR of MERVL, as stage-specific promoters (Macfarlan et al., 2011). We then sought to examine whether the candidates had potential to promote ZGA by activating MERVL and 2C-genes (Figure 2—figure supplement 1A; Supplementary file 1). We constructed a 2C::tdTomato reporter mESC line with transgenic tdTomato red fluorescence protein driven by the MERVL 5'-LTR (Macfarlan et al., 2012; Figure 2A). Candidate genes were cloned and overexpressed in the reporter cell line (Figure 2—figure supplement 2B and C). Interestingly, ectopic expression of Obox4 markedly induced tdTomato expression, similar to that induced by Dux (Figure 2B, Figure 2—figure supplement 2A and B). To characterize the impact of Obox4 expression on 2C-genes, we established an mESC stable line bearing an inducible Obox4 transgene (Figure 2C). Differentially expressed gene analysis revealed that Obox4 induction led to transcriptome changes in mESCs, characterized by upregulation of 2C-genes and TEs that were highly expressed in early-to-middle 2C-embryos (Wu et al., 2016; Figure 2D and E), naturally occurring 2C-like mESCs (Zhu et al., 2021), and Dux-induced 2C-like mESCs (Hendrickson et al., 2017; Figure 2F; Supplementary file 2). A substantial fraction (159/164) of Obox4-induced 2C-genes were also induced by Dux (Figure 2G). While the induction effect of Obox4 is milder compared with Dux when considering the number and fold-upregulation of 2C-genes, transcriptomic perturbances introduced by Dux and Obox4 are highly correlated (Figure 2H). Interestingly, Dux and Obox4 were mutually inductive, where one promoted expression of the other. These results suggest that Obox4 is an inducer of 2C-like genes and potentially a redundant factor of Dux.
Figure 2. Obox4 and Dux induce 2C-gene expression in mouse embryonic stem cells (mESCs).
(A) Diagram of the 2C::tdTomato reporter assay. mESCs bearing the tdTomato expression cassette under the control of the MERVL long terminal repeat (LTR) promoter showed red fluorescence upon entering the 2C-like state. The expression of the transcription factor increased the 2C-like population, as detected using FACS. An EGFP expression plasmid was co-transfected with a gene of interest to normalize the transfection efficiency. (B) Boxplot showing normalized 2C-like cell percentage in 2C::tdTomato reporter mESCs overexpressing candidate pioneer factors. Dux and Obox4 potently induced a 2C-like state. n = 3 biological replicates. Error bars indicate standard deviations. (C) Upper panel: schematic of Obox4-inducible cell line construction. Lower panel: western blot showing OBOX4 level upon induction by different concentrations of doxycycline. Expression of OBOX4 was carried out in a dose-dependent manner. (D) Left panel: volcano plot of differentially expressed genes (DEGs) in mESCs with Obox4 induction for 48 hr. Representative 2C-genes are labeled with gene symbols. Right panel: expression profile of genes upregulated by Obox4 during embryogenesis. n = 3 biological replicates. (E) Left panel: volcano plot of differentially expressed transposable elements in mESCs with Obox4 induction for 48 hr. MERVL and MERVK elements were highlighted. Right panel: expression profile of MERVL and MERVK elements during preimplantation embryogenesis. n = 3 biological replicates. (F) Heatmaps of the expression of 2C-genes in preimplantation embryos, naturally occurred 2C-like mESCs, and induced 2C-like mESCs. (G) Venn diagram showing overlap of 2C-genes with genes induced by ectopic expression of Dux and Obox4 in mESCs. (H) Scatterplot showing per-gene expression changes in Dux-induced versus Obox4-induced mESCs. 2C-genes are highlighted in red.
Figure 2—figure supplement 1. k-means clustering of reimplantation gene expression and MERVL induction by ectopic Obox4 and Dux expression.
Figure 2—figure supplement 2. Ectopic expression of Obox4 and Dux activates MERVL reporter.
Obox4 binds to 2C-gene promoters and LTR elements in mESCs
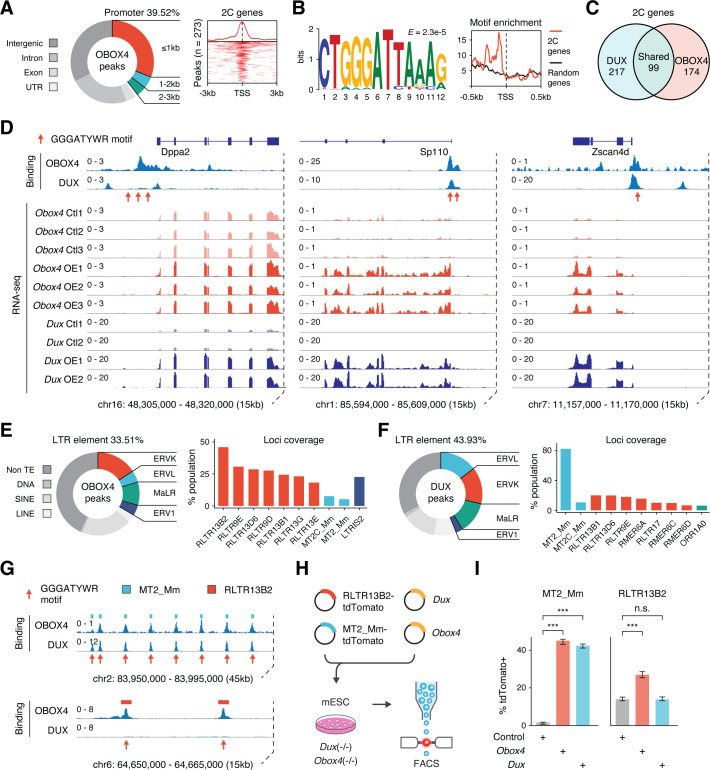
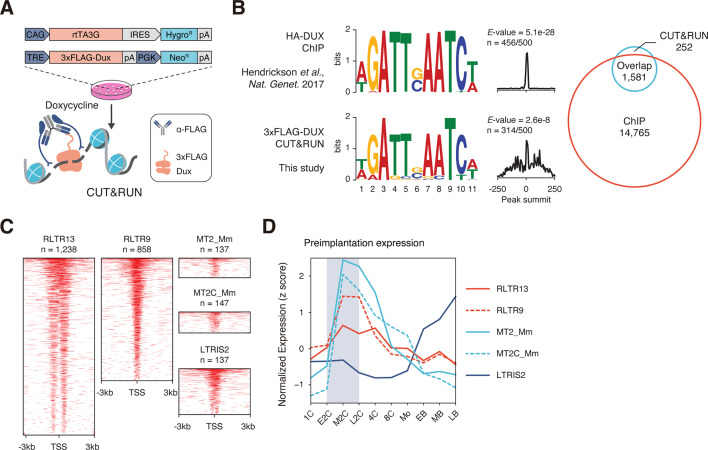
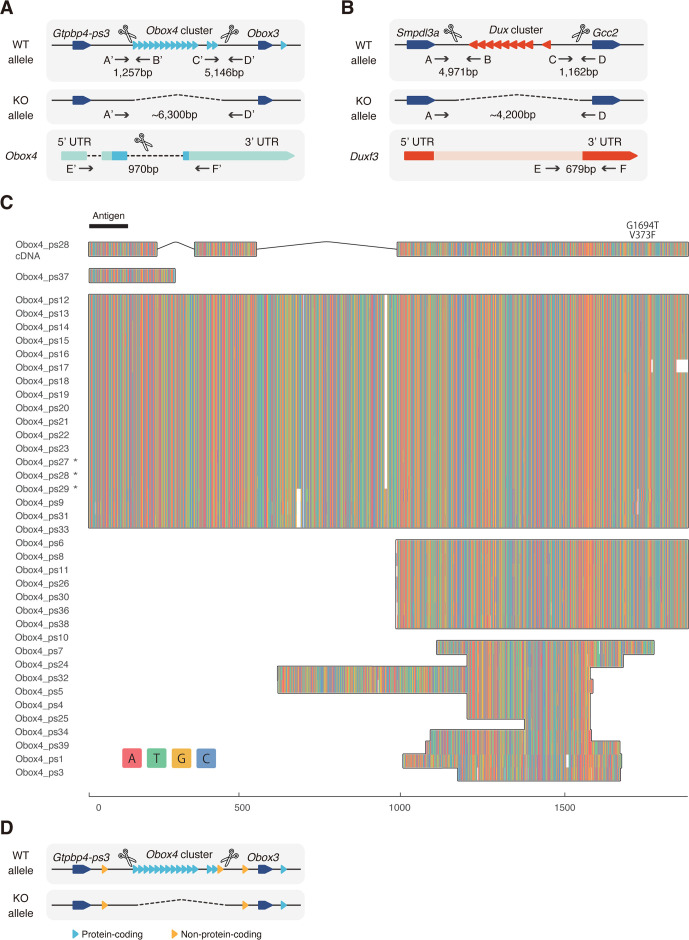
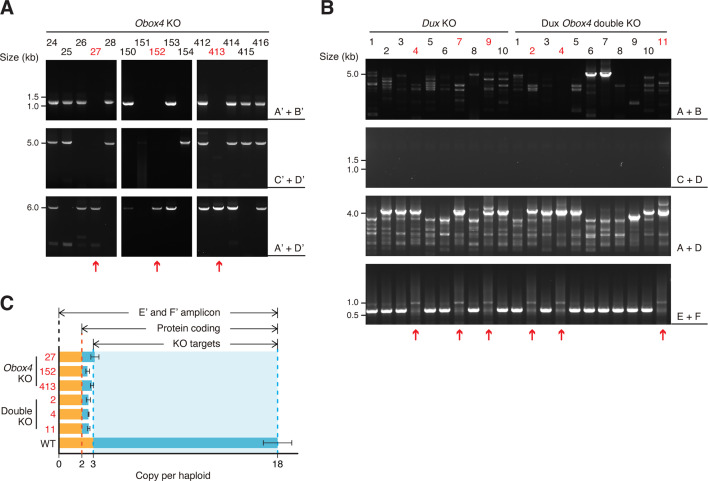
Obox4 contains a homeobox, activates 2C-genes and TEs, and upregulates Dux-induced genes, which prompted us to examine whether OBOX4 is a transcription factor that activates 2C-gene-associated loci through direct binding with cis-regulatory elements. Cleavage under targets and release using nuclease (CUT&RUN) leverages antibody-targeted cleavage of proximal DNA to identify the binding sites of DNA-associated proteins (Skene and Henikoff, 2017). To examine this technique, we performed CUT&RUN against triple FLAG-tagged DUX (3×FLAG-DUX) expressed in mESCs using a high-affinity anti-FLAG antibody (Sasaki et al., 2012) and confirmed that the DUX binding pattern revealed by CUT&RUN recapitulated the published HA-tagged DUX ChIP data (Hendrickson et al., 2017; Figure 3—figure supplement 1A and B). We then proceeded with characterizing the genomic footprint of OBOX4 by performing CUT&RUN against 3×FLAG-OBOX4 expressed in mESCs and discovered ~24,000 peaks, among which 39.5% were located in the gene promoter regions that covered 26.8% (273/1019) of the 2C-genes (Figure 3A). De novo motif discovery using the top 500 CUT&RUN signal peaks predicted CTGGGATYWRMR as the top OBOX4 binding motif, which is enriched in the promoter regions of 2C-genes (Figure 3B). Collectively, OBOX4 and DUX targeted 48.1% (490/1019) of the 2C-genes with a considerable overlap (36.3% for OBOX4 and 31.3% for DUX), which covered many important ZGA genes, including Dppa2, Sp110, and Zscan4d (Figure 3C and D; Supplementary file 3). The overlap was substantiated by the observation that MERVL LTR MT2_Mm was among the top 10 LTR targets of both OBOX4 and DUX, based on loci coverage (Figure 3E and F; Supplementary file 4). Notably, while DUX strongly prefers MT2_Mm, OBOX4 binding was biased toward MERVK LTRs, namely RLTR9 and RLTR13 elements (Figure 3G), which also demonstrated a 2C-specific expression profile (Figure 3—figure supplement 1C and D). To examine whether these bindings were functional in the absence of Dux, we generated Obox4/Dux single and double knockout mESC lines, in which 14 of 15 protein-coding Obox4 copies were removed from the genome (Figure 3—figure supplements 2 and 3). tdTomato reporters driven by MT2_Mm and RLTR13B2 were co-transfected with Dux and Obox4 into Obox4/Dux double knockout mESCs (Figure 3H). Analysis of the tdTomato-positive population showed that Obox4 activated both RLTR13B2 and MT2_Mm, whereas Dux only activated MT2_Mm (Figure 3I). These observations demonstrated that OBOX4 binds and activates a subset of DUX targets in mESCs and redundantly drives their expression in the absence of DUX.
Figure 3. OBOX4 binds and activates 2C-specific long terminal repeat (LTR) elements.
(A) Left panel: pie chart displaying proportions of annotated genomic regions of the OBOX4 binding sites. Right panel: heatmap showing the OBOX4 binding site distribution near 2C-gene promoters. (B) Left panel: the predicted OBOX4 binding motif using the top 500 cleavage under targets and release using nuclease (CUT&RUN) peaks. Right panel: histograph showing the distribution of the predicted OBOX4 binding motif near 2C and random gene promoters. (C) Venn diagram showing the distinct and overlapping 2C-genes targeted by DUX and OBOX4. (D) Representative genomic track showing DUX and OBOX4 binding sites at the Dppa2, Sp110, and Zscan4d loci and their expression levels in Obox4 and Dux-induced mouse embryonic stem cells (mESCs). Read counts were CPM normalized. The OBOX4 binding sites overlapped with those of DUX. Dppa2, Sp110, and Zscan4d expression was upregulated upon Obox4 and Dux induction. (E) Left panel: pie- hart displaying proportions of annotated transposable elements (TEs) of the OBOX4 binding sites. Right panel: bar plot showing the top 10 OBOX4 covered LTR elements. (F) Left panel: pie chart displaying proportions of annotated TEs of the DUX binding sites. Right panel: bar plot showing the top 10 DUX covered LTR elements. (G) Representative genomic track showing DUX and OBOX4 binding sites at MT2_Mm and RLTR13B2. Read counts were CPM normalized. The OBOX4 binding sites overlapped with those of DUX at MT2_Mm loci, while RLTR13B2 was uniquely bound by OBOX4. (H) Schematic design of the LTR::tdTomato reporter assay. Plasmids bearing a tdTomato ORF downstream of MT2_Mm or RLTR13B2 were co-transfected with Dux or Obox4 expression plasmids. Activation of LTR elements resulted in an increased red fluorescence-positive mESC population, which was measured using FACS. EGFP expression plasmid was co-transfected into the culture, following which the green fluorescence-positive population was measured, to normalize the transfection efficiency. (I) Bar plots showing the percentage of red fluorescence-positive mESCs upon expression of Dux or Obox4. Both Dux and Obox4 activated MT2_Mm, whereas only Obox4 activated RLTR13B2.
Figure 3—figure supplement 1. CUT&RUN captures DNA binding profiles of DUX and OBOX4.
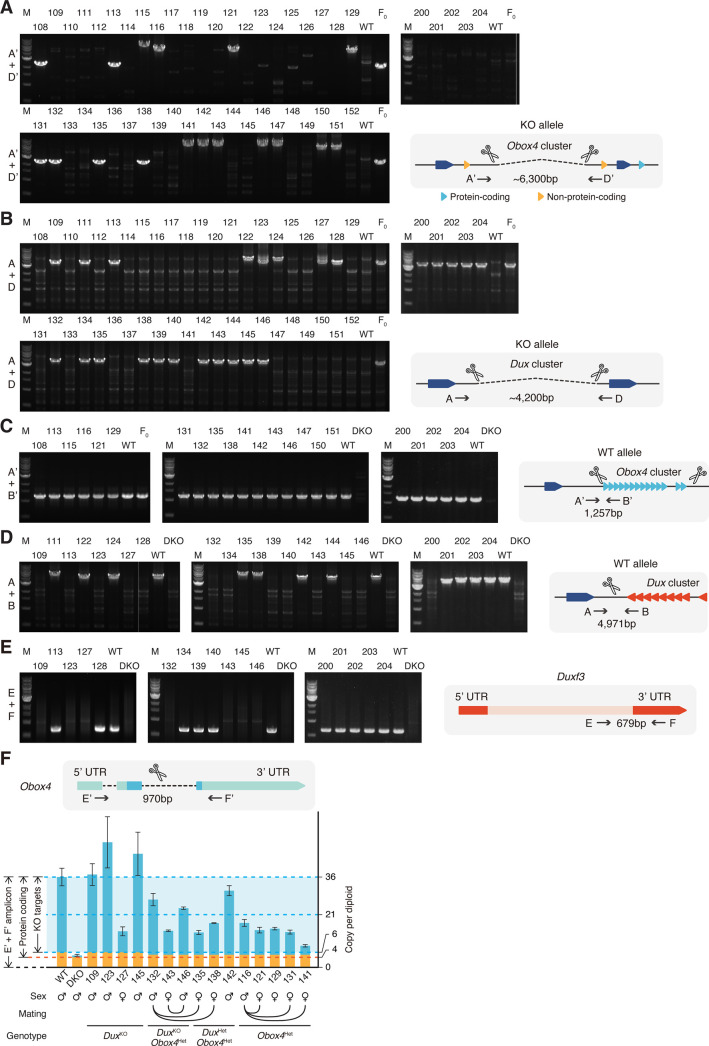
Figure 3—figure supplement 2. Knockout strategy of Obox4 and Dux clusters.
Figure 3—figure supplement 3. Validation of Obox4 and Dux knockout mouse embryonic stem cell lines.
Concomitant loss of Obox4 and Dux impairs preimplantation development
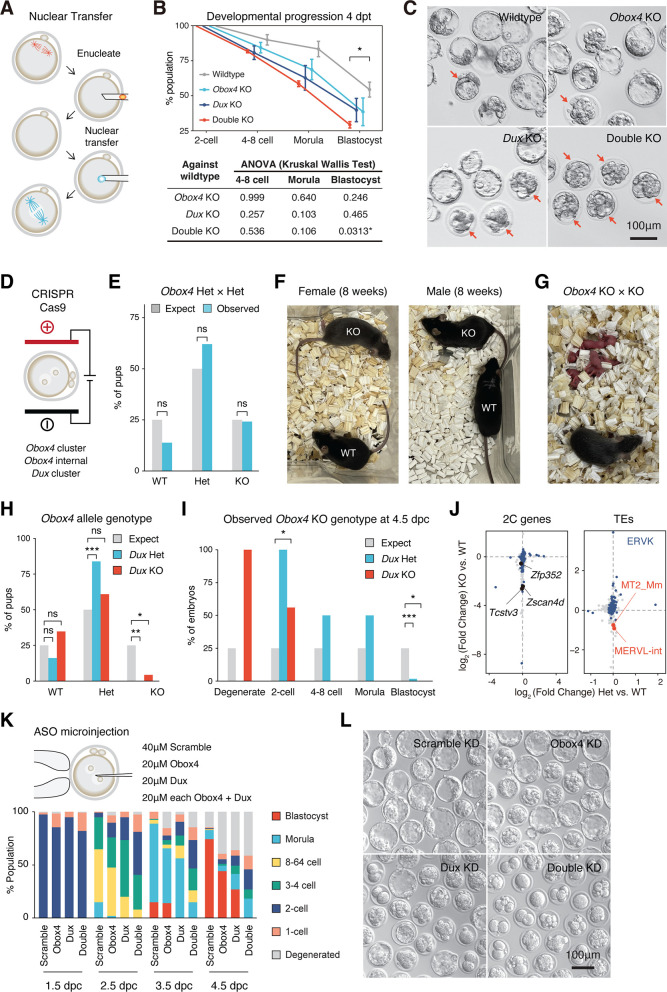
We then sought to determine whether Obox4 is functionally required for preimplantation development, particularly in the absence of Dux. Transient depletion of DUX has previously confused the field in that it caused an embryonic phenotype while subsequent Dux knockout females were shown to be fertile (De Iaco et al., 2017; Chen and Zhang, 2019; Guo et al., 2019; De Iaco et al., 2020; Bosnakovski et al., 2021). Therefore, it is critical to examine the functional requirement of OBOX4 and DUX in genetic knockout models. Somatic cell nuclear transfer (SCNT) is a technique to create embryos by transferring nuclei of somatic cells into enucleated oocytes (Figure 4A), which recapitulates ZGA (Markoulaki et al., 2008). When the knockout mESCs were subjected to SCNT as nuclear donors, 54.4% of WT mESC-derived embryos developed to the blastocyst stage 4 days post nuclear transfer (dpt). Obox4 and Dux single knockout donors led to reduced blastocyst formation rate at 38.5 and 39.7%, respectively, whereas double knockout resulted in an additive effect that led to a significantly lower blastocyst rate of 29.3% (Figure 4B). Notably, all blastocysts derived from double knockout mESCs were of low quality, judging from severe morphological abnormalities (Figure 4C).
Figure 4. Concomitant loss of OBOX4 and DUX severely hinders zygotic genome activation (ZGA).
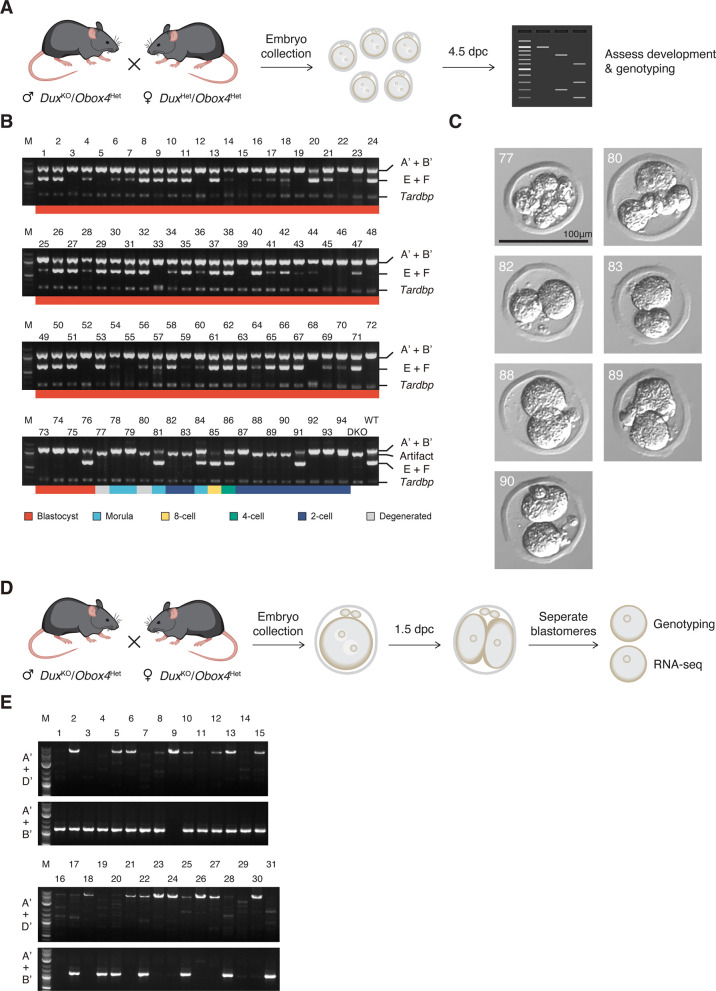
(A) Schematic representation of the somatic cell nuclear transfer (SCNT) experiment. The nuclei of knockout mouse embryonic stem cells (mESCs) were transferred into enucleated oocytes to generate zygotes with knockout genotype. (B) Upper panel: percent SCNT embryos developed to different stages at 4 days post nuclear transfer (dpt). Lower panel: p-value of non-parametric ANOVA among different genotypes and stages compared to wildtype SCNT embryos. Three independent experiments were conducted, with 150–200 embryos per condition. (C) Representative picture of SCNT embryos at 4 dpt. Morphologically abnormal blastocysts are highlighted. Blastocysts generated by double knockout mESCs were severely defective. (D) Schematic representation of CRISPR-Cas9-mediated Dux and Obox4 knockout mouse production. In vitro fertilized mouse zygotes were electroporated with pre-assembled CRISPR-Cas9 complex targeting Dux and Obox4 loci. (E) Bar plot showing genotype percentage of the pups delivered by Obox4Het intercrosses. Four litters delivered 29 pups, litter size 7.25 ± 1.26. ns p-value=0.9146, chi-square goodness-of-fit test. (F) Representative photos of Obox4KO and WT adult mice analyzed in (E). (G) Photo of Obox4KO intercross litter with live pups. (H) Bar plot showing genotype of Obox4 allele in the pups delivered by crossing of DuxKO/Obox4Het × DuxKO/Obox4Het or DuxKO/Obox4Het × DuxHet/Obox4Het. Nine litters delivered 54 pups, Dux heterozygous and knockout allele were present in 31 and 23 pups, respectively. **p-value=0.001306; *p-value=0.02218; chi-square goodness-of-fit test. (I) Bar plot showing observed percentages of different preimplantation stage embryos bearing Obox4 KO allele with Dux heterozygous or knockout allele at 4.5 days post coitum (dpc). Among the total 94 embryos assessed, 2 degenerated, 10 two-cell arrest, 2 4–8-cell arrest, 4 morula arrest embryos were observed at 4.5 dpc, whereas 76 developed to blastocyst. ***p-value=3.564 × 10⁻⁵; for two-cell; * p-value=0.04348; for blastocyst *p-value=0.02549; chi-square goodness-of-fit test. (J) Scatterplot showing expression log2 fold changes of genes (left panel) and transposable elements (TEs) (right panel) in DuxKO/Obox4KO and DuxKO/Obox4Het versus DuxKO/Obox4WT 2C embryos. 2C-genes and ERVK elements targeted by OBOX4 are highlighted in blue. MT2_Mm and MERVL-int are labeled. In total, 79 and 5 2C-genes were downregulated in DuxKO/Obox4KO and DuxKO/Obox4Het 2C embryos, respectively. (K) Upper panel: schematic representation of Dux and Obox4 knockdown experiments in preimplantation embryos. Male pronuclei of zygotes were microinjected with antisense oligonucleotide (ASO) targeting Dux or Obox4 transcripts. Lower panel: the percentages of embryonic stages observed at 1.5 dpc, 2.5 dpc, 3.5 dpc, and 4.5 dpc. (L) Representative picture of KD embryos at 4.5 dpc. No blastocyst was observed among double ASO knockdown embryos.
Figure 4—figure supplement 1. Genotyping of Obox4 and Dux knockout alleles in the F1 mice.
Figure 4—figure supplement 2. Genotyping of Obox4 knockout allele in the F2 mice.
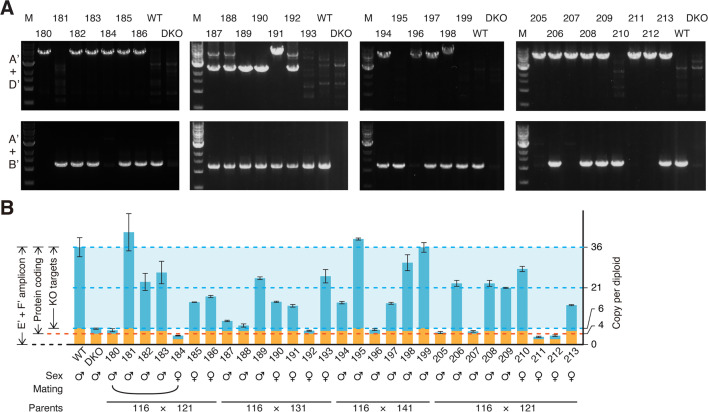
Figure 4—figure supplement 3. Genotyping of Obox4 and Dux knockout alleles in the F2 mice.
Figure 4—figure supplement 4. Genotyping of Obox4 and Dux knockout alleles in the embryos.
Figure 4—figure supplement 5. Obox4/Dux double knockdown embryos showed developmental defects.
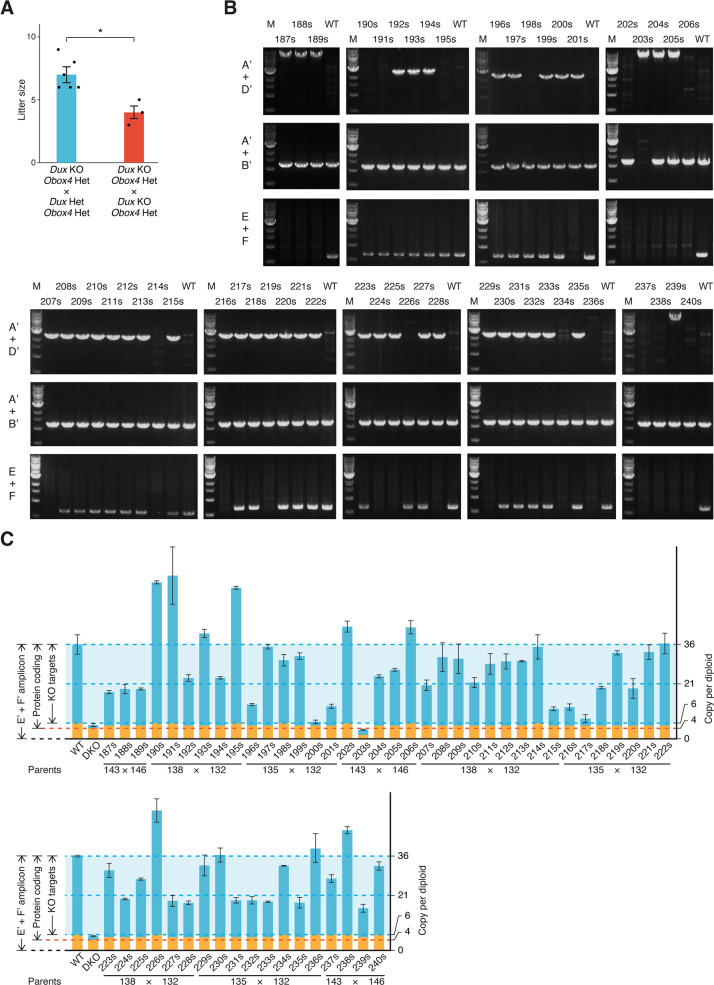
As an alternative genetic knockout model, we generated mice bearing Dux and Obox4 knockout alleles by direct CRISPR-Cas9 editing in embryos (Figure 4D, Figure 3—figure supplement 2A and B). Among 39 Obox4 copies, there are 15 copies that maintain an intact open-reading frame (ORF) for full-length OBOX4 (Figure 3—figure supplement 2C). While 14 of the 15 intact ORFs form a tightly packed cluster (Obox4 cluster), a solo ORF (Obox4-ps33) remains distant from the Obox4 cluster and is interspersed with Obox1/2/3, a collection of Obox family members that are critical for ZGA (Ji et al., 2023). To minimize collateral genetic toxicity and interference to the experimental result caused by the removal of other Obox members, only the Obox4 cluster was knocked out and the solo ORF was retained (Figure 3—figure supplement 2D, Figure 4—figure supplement 1). The observed Obox4KO frequency (7/29) in the progenies of Obox4Het × Obox4Het crossing is consistent with the expected 25% Mendelian ratio (Figure 4E, Figure 4—figure supplement 2; Supplementary file 5). That Obox4KO mice developed to adulthood without discernable abnormalities and are fertile when intercrossed suggest that development is compatible with loss of Obox4 (Figure 4F and G). We next attempted to produce Dux/Obox4 double knockout (DuxKO/Obox4KO) mice to examine whether concomitant loss of Dux and Obox4 compromises embryogenesis. We genotyped 54 pups from three litters of DuxKO/Obox4Het × DuxKO/Obox4Het and six litters of DuxKO/Obox4Het × DuxHet/Obox4Het mating pairs (Figure 4—figure supplement 3; Supplementary file 5). One Obox4KO/DuxKO pup was present, and the frequency of Obox4KO/DuxKO and Obox4KO/DuxHet were significantly lower than the expected 25% Mendelian ratio (Figure 4H). Development monitoring and genotyping of embryos produced by DuxKO/Obox4Het × DuxHet/Obox4Het mating pairs at 4.5 days post coitum (dpc) revealed that DuxKO/Obox4KO was under-represented in blastocysts while over-represented in two-cell arrest and degenerated embryos (Figure 4I, Figure 4—figure supplement 4A–C; Supplementary file 6). Despite repeated attempts, various crossing strategies failed to produce Obox4KO/DuxKO mating pairs that could be used to produce large number of Obox4KO/DuxKO embryos required for transcriptome analysis. As an alternative, we performed single blastomere genotyping and RNA-seq of 2C embryos produced by DuxKO/Obox4Het crossings (Figure 4—figure supplement 4D and E), which showed dysregulation of 2C-genes and TEs targeted by OBOX4 (Figure 4J; Supplementary file 7). The impaired development and transcriptome of DuxKO/Obox4KO embryos at the two-cell stage showed that ZGA was defective in these embryos.
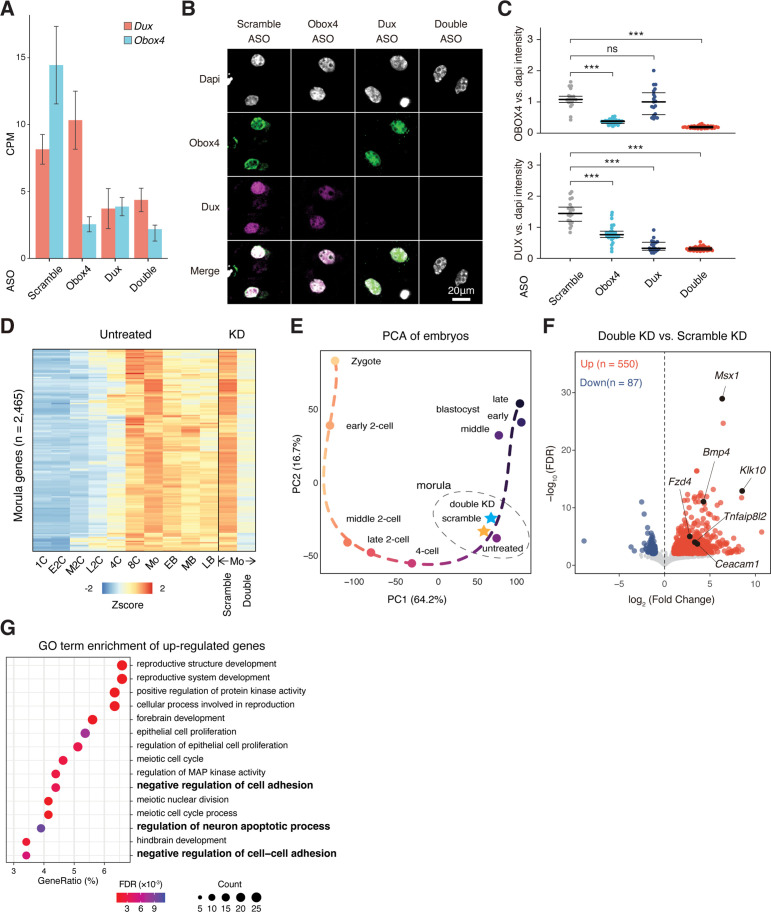
As large numbers of Obox4KO/DuxKO embryos are inaccessible due to technical limitations, we adopted an alternative approach to capture high-quality transcriptomes upon Dux/Obox4 depletion. Microinjection of antisense oligonucleotide (ASO) into male pronuclei of zygotes was performed to knockdown Obox4 and Dux (Figure 4K, Figure 4—figure supplement 5A–C). Monitoring development until 4.5 dpc showed that Obox4 single knockdown resulted in moderate developmental defects, with almost 50% of embryos reaching the blastocyst stage. Similarly, blastocyst formation was preserved in nearly 25% of Dux single knockdown embryos, which is consistent with previously reported Dux knockdown/knockout experiments (De Iaco et al., 2017; Chen and Zhang, 2019; Guo et al., 2019; De Iaco et al., 2020; Bosnakovski et al., 2021). The Obox4/Dux double knockdown (DKD) markedly compromised blastocyst formation, resulting in more than 80% of embryos degenerated or arrested before the 4C stage, and less than 20% manifested morula-like morphology (Figure 4K and L). The DKD embryos with morula-like morphology manifest a dysregulated transcriptome characterized by a failure of expressing morula specific genes and activation of apoptosis related pathways, suggesting that the development was dysfunctional instead of delayed (Figure 4—figure supplement 5D–G).
The consistency among constitutive knockout in SCNT embryos, living mice, and ASO-mediated transient depletion demonstrated that the expression of Obox4 and Dux is collectively important for preimplantation development, and that Obox4 is capable of promoting ZGA in a Dux-independent manner. Collectively, these data show that Obox4 promotes mouse preimplantation development in the absence of Dux.
OBOX4 promotes 2C-gene expression upon depletion of DUX
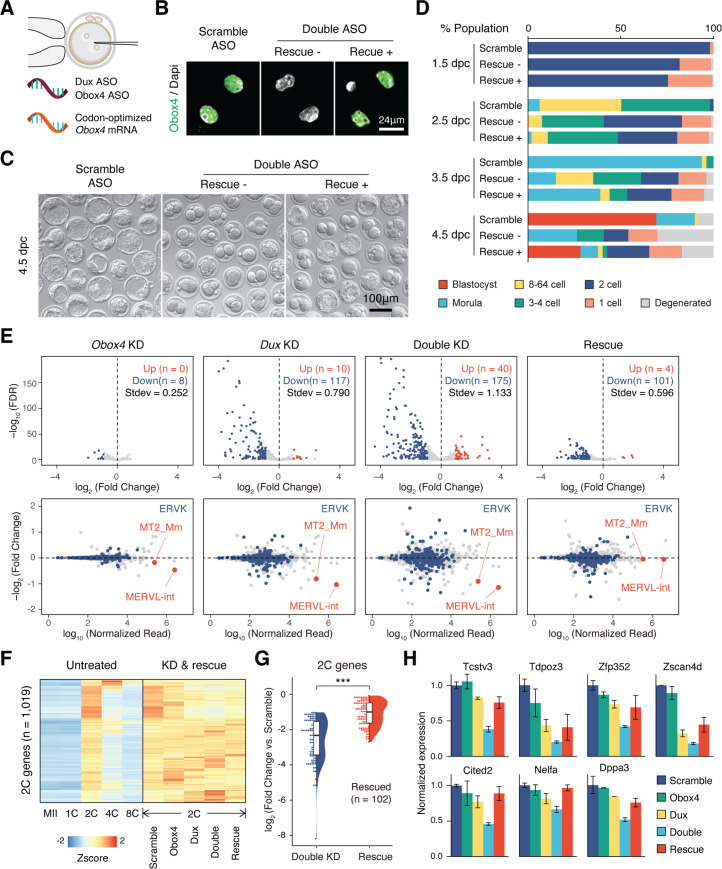
As Obox4 has been shown to activate 2C-genes and TEs in mESCs, and embryonic depletion of OBOX4 impairs 2C-genes and TEs activation, we asked whether the impairment can be ameliorated by restoration of OBOX4. First, we determined whether the presence of OBOX4 can rescue the developmental arrest of Obox4/Dux DKD embryos. Codon-optimized Obox4 mRNA without the ASO target motif was produced using in vitro transcription. The rescue experiment was performed by means of co-microinjection of Obox4 mRNA with Obox4/Dux DKD ASOs (Figure 5A). Restoration of OBOX4 in Obox4 mRNA-microinjected embryos was confirmed using immunofluorescence staining at the 2C stage (Figure 5B). As expected, development monitoring showed that Obox4/Dux DKD embryos failed blastocyst formation at 4.5 dpc, whereas among Obox4 mRNA-rescued embryos, blastocyst formation was retained at a similar level to that observed in the Dux single knockdown experiment (Figures 4K, L, 5C, D). RNA-seq of 2C-embryos revealed exacerbated dysregulation of 2C-genes and TEs by Obox4/Dux DKD compared to single knockdowns, and the dysregulated transcriptome of DKD was rescued by resupplying OBOX4, revealed by the number of up- and downregulated genes (Figure 5E and F). Differential expression analysis revealed that 58% (102/175) of the downregulated 2C-genes in DKD embryos were rescued, including 2C stage markers and important ZGA factors (Figure 5G and H). These results showed that OBOX4 redundantly activates 2C genes to promote ZGA under DUX depletion.
Figure 5. OBOX4 promotes zygotic genome activation (ZGA) in the absence of DUX.
(A) Schematic of the double knockdown rescue experiment. Male pronuclei of zygotes were injected with antisense oligonucleotide (ASO) targeting Obox4 and Dux transcripts as well as in vitro-transcribed codon-optimized Obox4 mRNA. (B) Immunofluorescence staining of OBOX4 in early two-cell embryos microinjected with scrambled ASO, double ASO (Obox4 and Dux), or double ASO with codon-optimized Obox4 mRNA. (C) Representative picture of knockdown and rescue embryos at 4.5 days post coitum (dpc). Codon-optimized Obox4 mRNA injection rescued blastocyst formation in ASO knockdown embryos. (D) The percentages of embryonic stages observed at 1.5 dpc, 2.5 dpc, 3.5 dpc, and 4.5 dpc. The plot represents the sum of three independent experiments, with 80–100 embryos per condition. (E) Upper panel: volcano plot showing the results of differentially expressed gene (DEG) analysis of 2C-genes in knockdown and rescue embryos compared to that in scramble ASO-injected embryos. Standard deviations of log2(fold-change) were used to represent the degree of transcriptome dysregulation. Stdev, standard deviation. Lower panel: MA plot of differential expression of transposable elements (TEs) in knockdown and recue embryos compared to that in scramble ASO-injected embryos. MERVK elements and MERVL are highlighted. n = 3 biological replicates. (F) Heatmaps of the expression of 2C-genes in preimplantation embryos, knockdown 2C-embryos, and rescue 2C-embryos. (G) Rain plot displaying the expression change distribution of rescued 2C-genes in double knockdown and recue 2C-embryos. (H) Bar plots showing the expression of representative 2C-genes in knockdown and recue embryos; n = 3 biological replicates.
Obox4/Dux redundancy is distinct among the Obox family
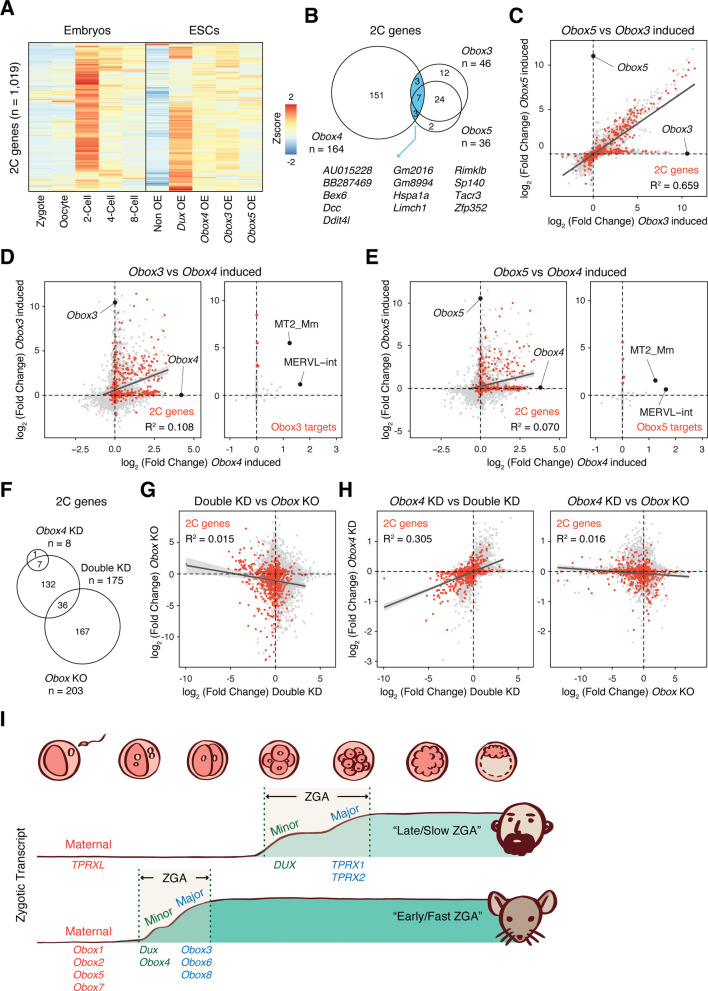
Recently, Ji et al., 2023 demonstrated that OBOX family proteins are important regulators of ZGA in a DUX-independent manner . Interestingly, they showed that maternal (Obox1/2/5/7) and zygotic (Obox3/4) Obox members seem to be redundant as loss of either is compatible with embryogenesis. This prompted us to ask whether Obox4 targets are distinctive from that of other Obox family members. Comparative analysis revealed distinctive patterns of Dux/Obox3/Obox4/Obox5-induced transcriptomes in mESCs (Figure 6A). While 2C-genes induced by Obox3 and Obox5 overlap substantially, the majority of them were not induced by Obox4 (Figure 6B). The expression changes of Obox3/Obox5 induced 2C-genes are highly correlated, characterized by coefficient of determination R2 (Figure 6C), whereas the Obox4-induced transcriptome poorly correlated with those of Obox3 and Obox5 (Figure 6D and E; Supplementary file 8). Except for MERVL, TEs induced by Obox3 and Obox5 were not induced by Obox4 (Figure 6D and E; Supplementary file 8). Similarly, transcriptomes are poorly correlated between Dux/Obox4 DKD and Obox maternal/zygotic knockout (mzKO) 2C embryos, with downregulation of distinct groups of 2C-genes (Figure 6F and G). The transcriptome of Obox4 knockdown embryos showed a higher correlation with Dux/Obox4 DKD embryos than Obox mzKO embryos (Figure 6G and H; Supplementary file 9), suggesting that the functional redundancy to Dux is a distinct feature of Obox4 among the Obox family.
Figure 6. OBOX4-mediated DUX redundancy is distinct among the OBOX family.
(A) Heatmaps of the expression of 2C-genes in preimplantation embryos, non-induced mouse embryonic stem cells (mESCs), and Dux/Obox4/Obox3/Obox5-induced mESCs. (B) Venn diagram showing overlap of 2C-genes induced by ectopic expression of Obox3, Obox4, and Obox5 in mESCs. (C) Scatterplot showing per-gene expression changes in Obox3 versus Obox5-induced mESCs. 2C-genes are highlighted in red. (D) Scatterplot showing per-gene (left panel) and per-transposable element (right panel) expression changes in Obox3 and induced versus Obox4-induced mESCs. 2C-genes and Obox3-induced transposable elements (TEs) are highlighted in red. (E) Scatterplot showing per-gene (left panel) and per-transposable element (right panel) expression changes in Obox5 and induced versus Obox4-induced mESCs. 2C-genes and Obox3-induced TEs are highlighted in red. (F) Venn diagram showing overlap of 2C-genes downregulated upon Obox4 knockdown, Dux/Obox4 double knockdown, and Obox maternal-zygotic knockout. (G) Scatterplot showing per-gene expression changes in Obox maternal-zygotic knockout versus Dux/Obox4 double knockdown 2C embryos. 2C-genes are highlighted in red. (H) Scatterplot showing per-gene expression changes in Obox4 knockdown versus Dux/Obox4 double knockdown (left panel) and Obox maternal-zygotic knockout (right panel) 2C embryos. 2C-genes are highlighted in red. (I) Schematic model of different zygotic genome activation (ZGA) strategy employed by human and mouse. Obox family members with redundant functions are expressed in high dose at peri-ZGA stages to ensure rapid ZGA. Obox4 evolved as a divergent Obox family member that provides functional redundancy to Dux.
Discussion
Starting with a transcriptionally inert genome, the eutherian ZGA engages in massive yet coordinated expression of genes driven by TE LTRs. In mice, it has been reported that the transcription factor DUX accesses and opens condensed chromatin of the MERVL LTR loci, which results in the activation of downstream ZGA genes (De Iaco et al., 2017; Hendrickson et al., 2017; Whiddon et al., 2017). However, the establishment of fertile Dux knockout mice suggests that ZGA is redundantly driven by other transcription factor(s) (Chen and Zhang, 2019; Guo et al., 2019; De Iaco et al., 2020; Bosnakovski et al., 2021). Obox transcripts were first discovered in gonads (Rajkovic et al., 2002) and were later found to be highly abundant in mouse 2C-embryos (Ge, 2017). Despite being important regulators of ZGA (Ji et al., 2023), the biological significance of distinct Obox genes remains elusive. The Obox family has 67 members clustered in the sub-telomeric region of mouse chromosome 7 and is further divided into six subfamilies: Obox1, Obox2, Obox3, Obox4, Obox5, and Obox6, with Obox4 constituting nearly 60% (39 of 67) of the family population (Zhong and Holland, 2011a; Wilming et al., 2015). The role of Obox4 is particularly mysterious as it remains to be determined whether Obox4 is a functional protein-coding gene. In the present study, we found that Obox4 is a bona fide multicopy protein-coding gene that encodes a homeodomain-containing protein that potently induces ZGA gene expression. Using multiple genetic knockout models, we showed that concomitant depletion of Dux and Obox4 was hardly compatible with embryogenesis as Dux/Obox4 double knockout mESCs subjected to SCNT failed to produce pups, and Dux/Obox4 double knockout mouse was produced at a sub-Mendelian ratio. Consistently, Obox4/Dux DKD markedly compromised preimplantation development, but single knockdown of either gene was tolerated. DKD embryos exhibited severely dysregulated transcriptomes, characterized by MERVL and ZGA gene activation defects. We also characterized the molecular mechanisms underlying the biological significance of Obox4 as well as its relevance to Dux. OBOX4 directly binds to MERVL (the target of DUX) and MERVK loci and activates specific MERVL and MERVK elements in a Dux-independent manner. In summary, our results highlight that OBOX4 is a transcription factor that is functionally redundant to DUX during ZGA.
Despite the narrow time window, ZGA takes place as a stepped program. A wave of mild and promiscuous transcription of ‘minor ZGA’ is commenced first, followed by ‘major ZGA’ characterized by transcriptional bursting of a more defined set of genes (Tadros and Lipshitz, 2009). While major ZGA in large mammals usually launches multiple cell cycles after minor ZGA, it is worth noting that mouse ZGA adopts an unique ‘early genome activator’ strategy where the timing of minor and major ZGA converges at the early two-cell stage (Svoboda, 2018). Overlapping minor and major ZGA right after fertilization allows prompt initiation of the zygotic program and accelerated preimplantation development – a potentially favorable reproductive advantage in rodents. Multiple shared features of Dux and Obox4 imply that these genes have adapted to this particular developmental scheme to serve redundantly as key ZGA factors. Qualitatively, the functional redundancy between DUX and OBOX4 buffers sporadic mutations or defects that could arise during ZGA. Their lack of introns enables the earliest possible translation under ZGA-associated splicing deficiency (Shen et al., 2021). Quantitatively, both genes are tandemly arrayed in clusters, which assures rapid accumulation of their transcripts. Taken together, it seems that mouse ZGA may represent an evolutionary innovation where the first embryonic program shows surprising plasticity, likely supported by the expression of multiple Obox family members throughout peri-ZGA stages (Figure 6I). Indeed, concomitant loss of Dux and nearly all Obox4 copies only partially compromises the ZGA transcriptome, demonstrating that mouse ZGA is so strongly canalized that even such a potent perturbance in genes makes very little difference to the phenotype.
Unlike Dux, which is structurally and functionally conserved throughout placentalia (Leidenroth and Hewitt, 2010), the ancestral locus of the Obox family appears to have undergone mouse-specific duplication and generated a gene cluster that is collectively syntenic to the Tprx2 locus in other mammals (Maeso et al., 2016). Despite the distal homology between Obox4 and Tprx2, it has been recently reported that human TPRX2 is expressed in eight-cell embryos (Madissoon et al., 2016). Interestingly, TPRX2 was shown to cause defective ZGA upon embryonic depletion and bind important ZGA genes in hESCs (Zou et al., 2022), suggesting that the Tprx2 locus might have undergone functionally convergent evolution despite its divergent genetic context. However, due to the distinction of minor and major ZGA timing across species, whether TPRX2 plays a similar role in humans to Obox4 in mice regarding the redundancy to Dux (DUX4 in humans) warrants careful examination. Nevertheless, considering that LTR domestication is functionally convergent in preimplantation development (Guo et al., 2024), it might be helpful to speculate that homeobox gene-mediated LTR activation is a common principle of ZGA. Meanwhile, because the repressive epigenetic landscape is barely established during minor ZGA, this may allow transcription factors like DUX and OBOX to potently shape the zygotic transcriptome by activating LTR elements. However, ZGA gene induction and epigenetic reprogramming can only partially recapitulate the 2C transcriptome in mESCs (Posfai et al., 2021; Hu et al., 2023), suggesting that ZGA is a collective outcome of specific parental, zygotic, and epigenetic factors that may or may not be present in pluripotent stem cells. Indeed, OBOX4 is equally potent as DUX at activating a 2C::tdTomato reporter but less potent at inducing 2C-genes in mESCs, which may suggest that the repressive epigenetic landscape is less permissive to OBOX4 than to DUX. Thus, attempts to model ZGA in vitro need to be carefully formulated to address these fundamental distinctions between embryos and cultured cells.
Materials and methods
Key resources
The sequences of primers, ASOs, and sgRNAs used in this study are provided in Supplementary files 11 and 12. A complete list of the key reagents and biological samples is provided in Supplementary file 13.
Mice
Male/female BDF1 and female BALB/c mice were purchased from Japan SLC Inc. The mice were fed regular chow and housed in a controlled room under a 14 hr/10 hr light/dark cycle at 22°C. All animal experiments were approved by the Animal Care and Use Committee of Keio University and the Animal Experimentation Committee at the RIKEN Tsukuba Institute and conducted in compliance with the Keio University Code of Research Ethics (License #11045-4) and the RIKEN’s guiding principles (T2023-Jitsu015).
Cell culture
All mouse mESC lines were cultured in Dulbecco’s Modified Eagle Medium (DMEM) (Cat# 08488-55, Nacalai Tesque) supplemented with 10% fetal bovine serum (lot# S10581S1820, Biowest), 1× GlutaMAX (Cat# 35050061, Gibco), 1× penicillin-streptomycin (Cat# 15140163, Gibco), 1× non-essential amino acids (Cat# 11140050, Gibco), 1× sodium pyruvate (Cat# S8636, Merck), 50 μM 2-mercaptoethanol (Cat# 21985023, Gibco), 1 μM CHIR99021 (Cat# 034-23103, Wako), 3 μM PD0325901 (Cat# 168-25293, Wako), and mouse leukemia inhibitory factor produced in-house. The culture medium was supplemented with iMatrix-511 silk (recombinant human laminin-511 E8 fragment) (Cat# 892021, Matrixome) at a concentration of 125 ng.cm–2 culture vessel area, before seeding mESCs into it. The cells were cultured in a humidified atmosphere containing 5% CO2 at 37°C, with the media changed every 48 hr.
TBLCs were generated by culturing mESCs in an ordinary medium supplemented with 2.5 nM PLaB (Cat# 16538, Cayman Chemicals). Cells were sub-cultured every 2–4 days, at a seeding density of 1 × 105 cm–2 culture vessel area. After five rounds of sub-culture, the cells were deemed TBLCs.
SP2/O-Ag14 myeloma and primary clones of hybridomas were cultured in GIT medium (Cat# 63725715, Wako) supplemented with recombinant human interleukin-6 (IL-6) (Cat# 20006, PeproTech). Cells were cultured in a humidified atmosphere containing 5% CO2 at 37°C and sub-cultured every day at a seeding density of 3×10⁵ mL–1. For monoclonal antibody production, hybridomas were cultured in a hybridoma serum-free medium supplemented with IL-6. The cells were cultured in a humidified atmosphere containing 5% CO2 at 37°C until they were over-confluent.
Cell transfection
Plasmid transfections were performed using the jetOPTIMUS DNA Transfection Reagent (Cat# 101000025, Polyplus), according to the manufacturer’s instructions. Briefly, mESCs were seeded at a cell density of 8 × 104 cm–2 culture vessel area. After 20 min, the jetOPTIMUS reagent and plasmids were diluted in jetOPTIMUS buffer, incubated for 10 min at room temperature, and then applied to the cell culture. After 48 hr, the cells were collected for downstream experiments.
cDNA synthesis and cloning
Total RNA was extracted from TBLCs using ISOGEN (Cat# 311-02501, Nippon Gene), according to the manufacturer’s instructions. Briefly, 500 μL ISOGEN was added to 1.5 × 10⁶ freshly harvested TBLCs. After 5 min of incubation at room temperature, 100 μL of chloroform (Cat# 03802606, Wako) was added to the cells and mixed by means of vigorous shaking. After 2 min of incubation at room temperature, the samples were centrifuged at 12,000 × g for 15 min at 4°C. The upper aqueous phase was then transferred to a new tube and mixed with 240 μL isopropanol (Cat# 15-2320, Merck) to precipitate the RNA. After 5 min of incubation at room temperature, the samples were centrifuged at 12,000 × g for 15 min at 4°C. The supernatant was then discarded, following which the RNA pellets were washed with 70% ethanol (Cat# 057-00456, Wako). The RNA pellets were then air-dried and dissolved in RNase-free water. The RNA solution was subjected to DNase treatment using TURBO DNA-free kit (Cat# AM1907, Thermo Fisher), according to the manufacturer’s instructions, to remove genomic DNA carryover. RNA (1 μg) was reverse transcribed to cDNA using the Transcriptor First Strand cDNA Synthesis Kit (Cat# 04379012001, Roche), according to the manufacturer’s instructions. PrimeSTAR Max DNA Polymerase (Cat# R045A, TaKaRa) and ProFlex PCR System (Cat# 4484073, Thermo Fisher) were used to amplify the sequence of interest from the cDNA. NEBuilder HiFi DNA Assembly Kit (Cat# E2621L, NEB) was used to clone the sequence of interest into plasmid backbone.
Immunofluorescence
For embryos, middle-2C-embryos were collected at 1.5 dpc. The zona pellucida was removed by treating the embryos with acidic Tyrode’s solution (Cat# MR-0040-D, Merck). The embryos were fixed in 4% paraformaldehyde (Cat# 09154-14, Nacalai Tesque) in phosphate-buffered saline (PBS) for 10 min. Following three washes in PBS, fixed embryos were permeabilized with 0.1% Triton X-100 (Cat# 1610407, Bio-Rad) in PBS for 20 min at room temperature. Following three washes in PBS, permeabilized embryos were blocked in 2% bovine serum albumin (BSA; Cat# 011-27055, Wako) in PBS for 20 min at room temperature. The blocked embryos were incubated with primary antibodies diluted in 2% BSA in PBS at 4°C overnight. Following three washes in PBS, the embryos were incubated with 2% BSA in PBS containing 1:200 diluted 4′,6-diamidino-2-phenylindole (DAPI) (Cat# 19178-91, Nacalai Tesque) and 1:500 diluted Alexa Fluor-conjugated anti-mouse IgG1 secondary antibody (Cat# A-21127, Thermo Fisher) or Alexa Fluor-conjugated anti-mouse IgG2a secondary antibody (Cat# A-21131, Thermo Fisher) for 1 hr at room temperature. Following three washes in PBS, the embryos were transferred into liquid paraffin-covered PBS drops on a glass-bottom dish (Cat# D11130H, Matsunami).
For culturing, cells seeded on glass-bottom chamber slides (Cat# SCS-N02, Matsunami) were fixed with 4% paraformaldehyde in PBS for 10 min. After three washes in PBS, the fixed cells were permeabilized with 0.1% Triton X-100 in PBS for 15 min at room temperature. Following three washes in PBS, permeabilized cells were incubated with primary antibodies diluted with 2% skim milk in PBS for 30 min at room temperature. Following three washes in PBS, the cells were incubated with 2% BSA in PBS containing 1:500 diluted Alexa Fluor-conjugated secondary antibody and 1:200 diluted DAPI for 1 hr at room temperature. Following three washes in PBS, the chamber was removed and the slides were mounted with ProLong Glass Antifade Mountant (Cat# P36982, Thermo Fisher). Fluorescence images were taken using a confocal laser scanning microscope (Cat# FV3000, Olympus).
Western blot
Freshly harvested cells were resuspended in PBS (Cat# 14249-95, Nacalai Tesque) and lysed by means of sonication. Whole-cell lysates were mixed with sample buffer containing reducing reagent (Cat# 09499-14, Nacalai Tesque) and boiled at 95°C for 5 min. Protein samples were loaded on a 10% tris-glycine gel, run in AllView PAGE Buffer (Cat# DS520, BioDynamics Laboratory), and then transferred to nitrocellulose membranes (Cat# 10600003, Cytiva) using a Power Blotter System (Cat# PB0012, Thermo Fisher). The membranes were blocked with PBST containing 2% skim milk (Cat# 4902720131292, Morinaga) at room temperature for 15 min. The membranes were incubated with primary antibodies in PBST containing 2% skim milk at room temperature for 30 min. After three washes with PBST, the membranes were incubated with secondary antibodies in PBST containing 2% skim milk at room temperature for 15 min with shaking. After three washes with PBST, the membranes were incubated with ECL reagents (Cat# RPN2232, Cytiva) and exposed to an X-ray film (Cat# 28906839, Cytiva) or detected using a digital chemiluminescence imager (Cat# 17001402JA, Bio-Rad).
qPCR
qPCR was performed using TB Green Fast qPCR Mix (Cat# RR430A, TaKaRa) according to the manufacturer’s instructions. The qPCR reactions were carried out and the signals were detected using a real-time PCR system (Cat# TP950, TaKaRa). For RT-qPCR, first-strand cDNA of mESCs total RNA was produced as described in the section ‘cDNA synthesis and cloning’. Primers targeting MERVL Gag consensus sequence were used to detect MERVL transcript. Primers targeting β-actin mRNA were used as internal control in all qPCR assays performed in this study.
smFISH
smFISH probes targeting MERVL were designed and synthesized by LGC Biosearch Technologies as previously described (Sakashita et al., 2023). smFISH followed by immunofluorescence staining was performed according to the manufacturer’s instructions. Briefly, Quasar 570-labeled probes were hybridized against MERVL RNA at 37°C for 16 hr, followed by immunofluorescence staining described in the section ‘Immunofluorescence’, without blocking step to prevent RNase contamination. The slides were mounted with ProLong Glass Antifade Mountant (Cat# P36982, Thermo Fisher). Fluorescence images were taken using a confocal laser scanning microscope (Cat# FV3000, Olympus).
Flow cytometry
The cells were digested with 0.25% trypsin-EDTA (Cat# 25200072, Gibco) at 37°C for 5 min, and then resuspended in FluoroBrite DMEM (Cat# A1896701, Gibco). The cell suspension was filtered through a 35 μM cell strainer (Cat# 352235, Falcon). The samples were analyzed using a cell sorter (Cat# SH800Z, Sony). Data analysis was performed using the Sony SH800Z cell sorter software.
Generation of transgenic mESC lines
The 2C::tdTomato reporter cell line was generated by transfection of EB3 mESCs (Cat# AES0139, RIKEN BRC Cell Bank) with a linearized 2C::tdTomato reporter plasmid (Cat# 40281, Addgene). After 48 hr, the cells were subjected to 500 μg.mL–1 hygromycin (Cat# 08906151, Wako) for 7 days. The selected cells were then seeded at a density of 2 × 102 cm–2 in culture medium containing 250 μg.mL–1 hygromycin. Single-cell clones were picked and expanded after 7 days.
A tetracycycline-controlled transcription activation system and a piggyBac transposon system were used as previously described (Takeuchi et al., 2022) to generate an Obox4-inducible cell line. Briefly, pPB-TRE-3×FLAG-Obox4, pPB-CAG-rtTA3G-IRES-Hygro, and pCMV-HyPBase-PGK-Puro plasmids were co-transfected into EB3 mESCs. After 48 hr, the cells were subjected to selection with 500 μg.mL–1 hygromycin and 500 μg.mL–1 G418 (Cat# 07805961, Wako) for 7 days. The selected cells were then seeded at a density of 2 × 102 cm–2 in a culture medium containing 250 μg.mL–1 hygromycin and 250 μg.mL–1 G418. Single-cell clones were picked and expanded after 7 days.
Generation of monoclonal antibodies
The anti-OBOX4, anti-DUX, and anti-GAG monoclonal antibodies were produced as previously described (Guo et al., 2021; Supplementary file 11a). Briefly, BALB/c mice were immunized by means of intraperitoneal injection of glutathione S-transferase-fused protein-of-interest (PoI). The mice were routinely immunized until their sera tested positive for the PoI-fused maltose binding protein (MPB), after which two boosting immunizations were performed. Following boosting, splenocytes from immunized mice were fused with SP2/O myeloma and cultured in hypoxanthine-aminopterin-thymidine medium for 10 days to select for hybridomas. Hybridomas were subsequently screened using ELISA against PoI-fused MBP. The positive polyclonal hybridomas were monoclonalized and expanded. For anti-OBOX4 hybridomas, additional screening using OBOX2-fused MBP was conducted. The sequence of OBOX4 was significantly divergent from those of the other OBOX members, and the monoclonal antibodies were negative for cross-reactivity with OBOX2 (Supplementary file 11b and c). The N-terminal 100 amino acids of OBOX4 and OBOX2 were used for immunization and cross-reactivity examination, respectively (Supplementary file 11d). The culture supernatants of monoclonal hybridomas were sterilized by passing them through a 0.22 μM pore size filter (Cat# 430769, Corning) and used directly as an antibody solution in other assays.
Generation of knockout mouse lines
Single-guide RNAs (sgRNAs) designed on flanking and inside of the Obox4 cluster were synthesized using a Precision gRNA Synthesis Kit (Cat# A29377, Thermo Fisher) according to the manufacturer’s instructions. 150 ng.mL–1 sgRNA and 125 ng.μL–1 Alt-R S.p. Cas9 Nuclease (Cat# 1081058, Integrated DNA Technologies) diluted with HEPES-buffered KSOM were electroporated into BDF1×B6 in vitro fertilized embryos with an electroporator (Cat# NEPA21, NEPA GENE). Treated embryos were cultured in KSOM for 18 hr, and embryos that reached the two-cell stage were transferred into the oviducts of pseudopregnant ICR female mice on day 0.5. Pups were retrieved on day 19.5 and genotyped with specific PCR primers.
Generation of knockout mESC lines
Plasmids encoding Cas9 and sgRNA flanking and inside of the Obox4 cluster were constructed to perform knockout experiment. The Obox4 knockout cell line was generated by means of co-transfection of EB3 mESCs with the pX330-Puro-Obox4KO-3, pX330-Puro-Obox4KO-4, pX330-Puro-Obox4KO-6, and pX330-Puro-Obox4KO-7 plasmids. After 18 hr, the cells were subjected to selection with 1 μg.mL–1 puromycin (Cat# 16023151, Wako) for 54 hr. The selected cells were then seeded at a very low density in culture medium without antibiotics. Single-cell clones were picked and expanded after 7 days and then subjected to genotyping.
Following a previously published protocol (Chen and Zhang, 2019), plasmids encoding Cas9 and sgRNAs flanking the Dux cluster were constructed to perform knockout experiment. The Dux knockout cell line and the Obox4/Dux double knockout cell line were generated by means of co-transfection of EB3 mESCs and Obox4 knockout cell lines with pX330-DuxKO-A and pX330-DuxKO-B plasmids. After 48 hr, the cells were seeded at a very low density. Single-cell clones were picked and expanded after 7 days and then subjected to genotyping.
While monoallelic Obox4 deletion was detected in 49.1% (335/682) of the CRISPR-Cas9-edited clones, biallelic deletion was only detected in 0.44% (3/682) of the population, suggesting that removal of Obox4 allele was associated with severe genetic toxicity. In contrast, 36.7% (47/128) monoallelic and 4.7% (6/128) biallelic deletions were detected in Dux knockout clones.
Genotyping and copy number examination
For mouse and culture cell, mouse right hindlimb toe or tail tip, or 1 × 10⁶ culture cells were incubated in 400 µL ProK solution containing 20 mM Tris–HCl pH 7.9, 1 mM EDTA, 1% w/v sodium dodecyl sulfate (SDS), 150 mM NaCl, 20 mM trisodium citrate, and 80 µg recombinant proteinase K (Cat# 161-28701, Wako) at 55°C for 2 hr with vigorous shaking. The solution was extracted with 2 volumes of phenol/chloroform/isoamyl alcohol (25:24:1) (Cat# 311-90151, Nippon Gene) twice. DNA in the aqueous phase was precipitated by adding 0.1 volume of 3 M sodium acetate and 2 volumes of 99.5% ethanol (Cat# 057-00456, Wako), snap freeze in liquid nitrogen, and centrifuged at 15,000 × g for 12 min at 4°C. After discarding supernatant, the DNA pellets were washed by 200 µL 70% ethanol, air dried at room temperature, and dissolved in 220 µL TE solution (Tris–HCl pH 7.9, 1 mM EDTA) supplemented with 1 µg RNase A (Cat# 131-01461, Nippon Gene). The solution was incubated at 37°C for 1 hr, then phenol/chloroform/isoamyl alcohol extracted and ethanol precipitated again as described above, to obtain highly purified genomic DNA. The DNA was dissolved in 200 µL TE solution.
For single blastomeres and abnormal embryos, whole-genome amplifications were performed on individual embryos using REPLI-g Advanced DNA Single Cell Kit (Cat# 150363, QIAGEN) according to the manufacturer’s instructions. For blastocysts, crude genomic DNA from single blastocysts was prepared according to the method described by Sakurai et al., 2014 with some modifications. Briefly, single blastocysts in 0.5 µL KSOM medium were transferred to the bottom of 0.1 mL PCR tubes, followed by the addition of 10 µL blastocyst lysis buffer containing 120 μg.mL–1 recombinant proteinase K, 100 mM Tris–HCl pH 7.9, 100 mM KCl, 0.45% NP-40, and 10 μg.mL–1 yeast tRNA (Cat# AM7119, Thermo Fisher). After brief vortex and pulse spin, the tubes were incubated at 55°C for 10 min followed by 95°C for 10 min.
For PCR-based genotyping, 10 ng purified genomic DNA, 10 ng whole-genome amplified DNA, or 2 µL of blastocyst lysate were used as template and amplified with target-specific primers by KOD One PCR Master Mix (Cat# KMM-101, TOYOBO) according to the manufacturer’s instructions. Primers targeting mouse Tardbp were used as internal control when whole-genome amplification product or blastocyst lysate were used as multiplex PCR template. For copy number examination, 5 ng genomic DNA template was amplified as described in the ‘qPCR’ section.
In vitro transcription
The Obox4 coding sequence was codon-optimized using GeneArt Instant Designer (Thermo Fisher) to remove the ASO target motif and improve translation efficiency. Codon-optimized DNA was synthesized using Prime Gene Synthesis Services (Thermo Fisher). Codon-optimized Obox4 mRNA was transcribed in vitro using the mMESSAGE mMACHINE T7 Transcription Kit (Cat# AM1344, Thermo Fisher) and then polyadenylated using a poly(A) tailing kit (Cat# AM1350, Thermo Fisher) according to the manufacturer’s instructions. The polyadenylated mRNA was purified using the RNeasy Mini Kit (Cat# 74004, QIAGEN), according to the manufacturer’s instructions, and dissolved in RNase-free water at a concentration of 100 ng.μL–1.
Pronuclear injection of mouse embryos
Eight-week-old BDF1 female mice were injected with 150 µL of CARD HyperOva (Cat# KYD-010-EX, Kyudo Co, Ltd). After 48 hr, the female mice were injected with 5 IU human chorionic gonadotropin (hCG) (Cat# GONATROPIN, ASKA Animal Health Co Ltd) and mated with BDF1 male mice. After 22 hr, the PN3 zygotes were collected. Cumulus cells were removed by briefly culturing the zygotes in potassium simplex optimization medium (KSOM) (Cat# MR-101-D, Merck) supplemented with 0.3 µg.µL–1 hyaluronidase (Cat# H4272, Merck). Embryos were cultured in KSOM medium drops covered with liquid paraffin (Cat# 26137-85, Nacalai Tesque) in a humidified atmosphere with 5% CO2 at 37°C. After 4 hr, PBS containing either 40 µM scramble ASO, 20 µM anti-Dux ASO, 20 µM anti-Obox4 ASO, 40 µM equimolar anti-Dux/anti-Obox4 ASO mixture, or 40 µM equimolar anti-Dux/anti-Obox4 ASO mixture with 100 ng.μL–1 codon-optimized Obox4 mRNA was microinjected into the male pronuclei of zygotes using a microinjector (Cat# 5252000013, Eppendorf). For developmental monitoring, embryos were cultured for 4 days after microinjection and assessed for developmental stage at 18 hr, 42 hr, 66 hr, and 90 hr after microinjection, which corresponded to 1.5 dpc, 2.5 dpc, 3.5 dpc, and 4.5 dpc, respectively.
Somatic cell nuclear transfer
SCNT was performed as described previously (Inoue et al., 2020) using wild-type and knockout mESC lines as nuclear donor cells. They were cultured at a high density until they reached confluency for about 4–6 days before SCNT. BDF1 female mice were superovulated by the injection of 7.5 IU of equine chorionic gonadotropin (eCG, ZENOAQ) and 7.5 IU of hCG (ASKA Pharmaceutical Co, Ltd) at a 48 hr interval. At 15 hr after hCG injection, cumulus–oocyte complexes were collected from the oviducts. After removal of cumulus cells by 0.1% bovine testicular hyaluronidase (Cat# 385931, Calbiochem), oocytes were enucleated in HEPES-buffered KSOM containing 7.5 μg.mL–1 cytochalasin B. After culture in KSOM for at least 1 hr, the enucleated oocytes were injected with donor mESCs using a Piezo-driven micromanipulator (Cat# PMM-150FU, Primetech). After culture in KSOM for about 1 hr, the injected oocytes were cultured in Ca2+-free KSOM containing 2.5 mM SrCl2, 5 μM latrunculin A (LatA) (Cat# L5163, Merck) with 50 nM trichostatin A (TSA) (Cat# T8552, Merck) for 1 hr. Then, they were cultured in KSOM containing 5 µM LatA and 50 nM TSA for 7 hr. After washing, the SCNT embryos were cultured in KSOM under 5% CO2 in air at 37°C for 96 hr. The embryos that reached two cells at 24 hr after activation were considered successfully cloned with cell cycle-matched mESCs (G0/G1 phase).
scRNA-seq analysis
Raw scRNA-seq data was obtained from the dataset of Deng et al. (GSE45719). Quality control and adapter trimming were done using fastp (Chen et al., 2018) v0.23.2. Quality-controlled reads were aligned to the GRCm38.p6 reference genome using STAR (Dobin et al., 2013) v2.7.9a, with default arguments. Reads were counted against GRCm38.p6 comprehensive gene annotation (Frankish et al., 2021) and mm10 repeats from the University of California, Santa Cruz (UCSC) RepeatMasker using Subread (Liao et al., 2014) v2.0.1 featureCounts function, and multi-mapping reads were discarded for non-TE features and counted fractionally for TEs. Seurat (Hao et al., 2021) v4.1.0 was used to process the read counts of scRNA-seq. Cells with >7.5% mitochondrial reads or <14,000 annotated features were discarded. Expression levels were log-normalized. The expression profiles of homeobox genes listed in HomeoDB2 (Zhong and Holland, 2011b) were clustered into 11 k-means after z-score transformation.
Ribo-seq analysis
Raw Ribo-seq data was obtained from the dataset of Xiong et al. (GSE165782). Reads were quality-controlled, aligned, and counted as described above. Reads aligned to all protein coding Obox4 loci were added up to represent translation level of OBOX4.
Bulk RNA-seq
For embryos, 30 middle-2C-embryos were collected 20 hr after microinjection in each independent biological replicate. The zona pellucida was removed by treating embryos with acidic Tyrode’s solution. Libraries were constructed using the SMART-Seq Stranded Kit (Cat# 634442, TaKaRa) and indexed using the SMARTer RNA Unique Dual Index Kit (Cat# 634451, TaKaRa) according to the manufacturer’s instructions.
For cell culture, total RNA was prepared using the RNeasy Kit according to the manufacturer’s instructions. The RNA solution was subjected to DNase treatment to remove genomic DNA carryover. Using 1 µg total RNA per sample, libraries were constructed with the NEBNext Ultra II Directional RNA Library Prep Kit for Illumina (Cat# E7760L, NEB) and indexed with NEBNext Multiplex Oligos for Illumina (Cat# E6440S, NEB) according to the manufacturer’s instructions.
The libraries were quantified with a 2100 Bioanalyzer (Cat# G2939BA, Agilent) using a High Sensitivity DNA Kit (Cat# 5067-4626, Agilent). Quantified libraries were pooled and sequenced using an Illumina NovaSeq 6000 System in 150 bp paired-end mode (Illumina). Base calling and de-multiplexing were performed using the bcl2fastq2 (Illumina) v2.20. De-multiplexed reads were quality-controlled, aligned, and counted as described above. DESeq2 (Love et al., 2014) v1.32.0 was used to perform differential expression analysis. Raw RNA-seq reads for TBLCs were downloaded from the dataset of Shen et al. (GSE168728). Raw RNA-seq reads of Dux knockout embryos were downloaded from the datasets of Chen and Zhang and De Iaco et al. (GSE121746 and GSE141321, respectively). Raw RNA-seq reads of preimplantation embryos were downloaded from the datasets of Wu et al. (GSE66390). Raw RNA-seq reads of 2C-like mESCs were downloaded from the datasets of Zhu et al. (GSE159623). The published data were analyzed using the same method.
CUT&RUN-seq
Cultured cells (1 × 10⁵) freshly prepared by trypsin-EDTA digestion were used to perform CUT&RUN with the CUT&RUN Assay Kit (Cat# 86652, Cell Signaling Technology) according to the manufacturer’s instructions. Enriched DNA was subjected to library construction using the NEBNext Ultra II DNA Library Prep Kit for Illumina (Cat# E7645L, NEB), with the adapter ligation step performed at 50°C instead of 65°C, to prevent the denaturation of small DNA inserts. The libraries were indexed using NEBNext Multiplex Oligos for Illumina, according to the manufacturer’s instructions.
The libraries were quantified, pooled, sequenced, de-multiplexed, and quality controlled as described above. Processed reads were aligned to the GRCm38.p6 reference genome using Bowtie2 (Langmead and Salzberg, 2012) v2.4.1, with default settings. Peaks were called in each biological replicate using the MACS3 (Zhang et al., 2008) v3.0.0a6 callpeak function (-f BAMPE). Alignment tracks were first generated using deepTools (Ramírez et al., 2016) v3.5.1 bamCoverage function (--binSize 10 --normalizeUsing CPM --smoothLength 30), and then normalized by subtracting the signal from non-immune IgG and wild-type mESCs using the deepTools bamCompare function (--scaleFactorsMethod None --operation subtract --binSize 10 --smoothLength 30). ChIPseeker (Yu et al., 2015) v1.28.3 was used to annotate the peaks. The MEME suite (Bailey et al., 2009) v5.4.1 was used to identify the binding motifs. Heatmaps were generated using deepTools computeMatrix and plotHeatmap functions. Visualization of genomic tracks was performed using trackplot (Pohl and Beato, 2014) v1.3.10. Raw ChIP-seq reads of DUXs in mESCs were downloaded from Hendrickson et al. (GSE85632). The published data were analyzed using the same method.
Quantification and statistical analysis
Descriptive and comparative statistics were employed in the article as described in the figure legends, with the number of replicates indicated. For single-hypothesis testing, significance is defined as a p-value<0.05 indicated with asterisk (*p-value<0.05, **p-value<0.01, ***p-value<0.001). Error bar represents the standard deviation (SD) of the mean of the replicates. Significant change in gene expression is denoted by greater than onefold difference and less than 0.01 false discovery rate.
Acknowledgements
We thank all the members of the Siomi Laboratory for their discussions and comments on this work. We thank Takehiko Yokomizo (Department of Biochemistry, Juntendo University) for providing the anti-DYKDDDDK monoclonal antibody (clone 2H8). We also thank Daisuke Motooka (Research Institute for Microbial Diseases, Osaka University) for generating the sequencing data. We are grateful to Azusa Inoue (Center for Integrative Medical Sciences, RIKEN), Katsuhiko Hayashi (Department of Genome Biology, Osaka University), and Therese Solberg (WPI-Bio2Q, Keio University) for their comments on this article. This work was supported by the MEXT Grant-in-Aid for Scientific Research in Innovative Areas (19H05753 to HS and 19H05758 to AO), AMED project to elucidate and control mechanisms of aging and longevity (1005442 to HS), JSPS Grant-in-Aid for Scientific Research KAKENHI (20K21507 to KM and 22H02534 to KI), Mochida Memorial Foundation Research Grant to KM, Sumitomo Foundation Research Grant to KM, Keio University Doctorate Student Grant-in-Aid Program to YG, and the JST Doctoral Program Student Support Fellowship to YG.
Funding Statement
The funders had no role in study design, data collection and interpretation, or the decision to submit the work for publication.
Contributor Information
Atsuo Ogura, Email: ogura@rtc.riken.go.jp.
Haruhiko Siomi, Email: awa403@keio.jp.
Falong Lu, Institute of Genetics and Developmental Biology, Chinese Academy of Sciences, China.
Lori Sussel, University of Colorado Anschutz Medical Campus, United States.
Funding Information
This paper was supported by the following grants:
Ministry of Education, Culture, Sports, Science and Technology Grant-in-Aid for Scientific Research in Innovative Areas 19H05753 to Haruhiko Siomi.
Japan Agency for Medical Research and Development Project to Elucidate and Control Mechanisms of Aging and Longevity to Haruhiko Siomi.
Ministry of Education, Culture, Sports, Science and Technology Grant-in-Aid for Scientific Research in Innovative Areas 19H05758 to Atsuo Ogura.
Japan Society for the Promotion of Science Grant-in-Aid for Scientific Research KAKENHI 20K21507 to Kensaku Murano.
Japan Society for the Promotion of Science Grant-in-Aid for Scientific Research KAKENHI 22H02534 to Kimiko Inoue.
Mochida Memorial Foundation for Medical and Pharmaceutical Research to Kensaku Murano.
Sumitomo Foundation to Kensaku Murano.
Keio University Student Grant-in-Aid Program to Youjia Guo.
Japan Science and Technology Agency Doctoral Program Student Support Fellowship to Youjia Guo.
Additional information
Competing interests
No competing interests declared.
Author contributions
Conceptualization, Resources, Data curation, Software, Formal analysis, Funding acquisition, Validation, Investigation, Visualization, Methodology, Writing - original draft, Project administration, Writing - review and editing.
Conceptualization, Data curation, Software, Formal analysis, Validation, Investigation, Visualization, Methodology, Project administration, Writing - review and editing.
Data curation, Validation, Investigation, Visualization, Methodology, Project administration, Writing - review and editing.
Resources, Data curation, Supervision, Investigation, Methodology, Project administration, Writing - review and editing.
Investigation.
Investigation.
Investigation, Writing - review and editing.
Resources.
Investigation.
Investigation.
Investigation.
Resources, Data curation, Supervision, Funding acquisition, Validation, Investigation, Methodology, Project administration, Writing - review and editing.
Conceptualization, Resources, Supervision, Funding acquisition, Project administration, Writing - review and editing.
Ethics
All animal experiments were approved by the Animal Care and Use Committee of Keio University and the Animal Experimentation Committee at the RIKEN Tsukuba Institute and conducted in compliance with the Keio University Code of Research Ethics and the RIKEN's guiding principles. (License #11045-4) and the RIKEN's guiding principles (T2023-Jitsu015).
Additional files
Data availability
The RNA-seq and CUT&RUN-seq data generated in this study have been deposited at NCBI Gene Expression Omnibus (GEO) database under the accession code GSE196671.
The following dataset was generated:
Guo Y, Kitano T, Siomi H. 2023. Obox4 secures zygotic genome activation upon loss of Dux. NCBI Gene Expression Omnibus. GSE196671
The following previously published datasets were used:
Deng Q, Ramsköld D, Reinius B, Sandberg R. 2014. Single-cell RNA-Seq reveals dynamic, random monoallelic gene expression in mammalian cells. NCBI Gene Expression Omnibus. GSE45719
Xiong Z, Xu K, Lin Z, Kong F, Wang Q, Quan Y, Li L, Xie W. 2022. Ultrasensitive Ribo-seq reveals translational landscapes during mammalian oocyte-to-embryo transition and pre-implantation development. NCBI Gene Expression Omnibus. GSE165782
Shen H, Yang M, Li S Du P. 2021. Mouse totipotent stem cells captured and maintained through spliceosomal repression. NCBI Gene Expression Omnibus. GSE168728
Chen Z, Zhang Y. 2019. Loss of DUX causes minor defects in zygotic genome activation and is compatible with mouse development. NCBI Gene Expression Omnibus. GSE121746
Grun D, De Iaco A. 2019. RNAseq of DUX KO mouse 2-cell embryos. NCBI Gene Expression Omnibus. GSE141321
Peter GH. 2017. Conserved roles for murine mDUX and human DUX4 in activating cleavage stage genes and MERVL/HERVL retrotransposons. NCBI Gene Expression Omnibus. GSE85632
References
- Bailey TL, Boden M, Buske FA, Frith M, Grant CE, Clementi L, Ren J, Li WW, Noble WS. MEME SUITE: tools for motif discovery and searching. Nucleic Acids Research. 2009;37:W202–W208. doi: 10.1093/nar/gkp335. [DOI] [PMC free article] [PubMed] [Google Scholar]
- Bosnakovski D, Gearhart MD, Ho Choi S, Kyba M. Dux facilitates post-implantation development, but is not essential for zygotic genome activation†. Biology of Reproduction. 2021;104:83–93. doi: 10.1093/biolre/ioaa179. [DOI] [PMC free article] [PubMed] [Google Scholar]
- Carrasco AE, McGinnis W, Gehring WJ, De Robertis EM. Cloning of an X. laevis gene expressed during early embryogenesis coding for a peptide region homologous to Drosophila homeotic genes. Cell. 1984;37:409–414. doi: 10.1016/0092-8674(84)90371-4. [DOI] [PubMed] [Google Scholar]
- Chen S, Zhou Y, Chen Y, Gu J. fastp: an ultra-fast all-in-one FASTQ preprocessor. Bioinformatics. 2018;34:i884–i890. doi: 10.1093/bioinformatics/bty560. [DOI] [PMC free article] [PubMed] [Google Scholar]
- Chen Z, Zhang Y. Loss of DUX causes minor defects in zygotic genome activation and is compatible with mouse development. Nature Genetics. 2019;51:947–951. doi: 10.1038/s41588-019-0418-7. [DOI] [PMC free article] [PubMed] [Google Scholar]
- De Iaco A, Planet E, Coluccio A, Verp S, Duc J, Trono D. DUX-family transcription factors regulate zygotic genome activation in placental mammals. Nature Genetics. 2017;49:941–945. doi: 10.1038/ng.3858. [DOI] [PMC free article] [PubMed] [Google Scholar]
- De Iaco A, Verp S, Offner S, Grun D, Trono D. DUX is a non-essential synchronizer of zygotic genome activation. Development. 2020;147:dev177725. doi: 10.1242/dev.177725. [DOI] [PMC free article] [PubMed] [Google Scholar]
- Deng Q, Ramsköld D, Reinius B, Sandberg R. Single-cell RNA-seq reveals dynamic, random monoallelic gene expression in mammalian cells. Science. 2014;343:193–196. doi: 10.1126/science.1245316. [DOI] [PubMed] [Google Scholar]
- Dobin A, Davis CA, Schlesinger F, Drenkow J, Zaleski C, Jha S, Batut P, Chaisson M, Gingeras TR. STAR: ultrafast universal RNA-seq aligner. Bioinformatics. 2013;29:15–21. doi: 10.1093/bioinformatics/bts635. [DOI] [PMC free article] [PubMed] [Google Scholar]
- Frankish A, Diekhans M, Jungreis I, Lagarde J, Loveland JE, Mudge JM, Sisu C, Wright JC, Armstrong J, Barnes I, Berry A, Bignell A, Boix C, Carbonell Sala S, Cunningham F, Di Domenico T, Donaldson S, Fiddes IT, García Girón C, Gonzalez JM, Grego T, Hardy M, Hourlier T, Howe KL, Hunt T, Izuogu OG, Johnson R, Martin FJ, Martínez L, Mohanan S, Muir P, Navarro FCP, Parker A, Pei B, Pozo F, Riera FC, Ruffier M, Schmitt BM, Stapleton E, Suner M-M, Sycheva I, Uszczynska-Ratajczak B, Wolf MY, Xu J, Yang YT, Yates A, Zerbino D, Zhang Y, Choudhary JS, Gerstein M, Guigó R, Hubbard TJP, Kellis M, Paten B, Tress ML, Flicek P. GENCODE 2021. Nucleic Acids Research. 2021;49:D916–D923. doi: 10.1093/nar/gkaa1087. [DOI] [PMC free article] [PubMed] [Google Scholar]
- Ge SX. Exploratory bioinformatics investigation reveals importance of “junk” DNA in early embryo development. BMC Genomics. 2017;18:200. doi: 10.1186/s12864-017-3566-0. [DOI] [PMC free article] [PubMed] [Google Scholar]
- Gehring WJ, Hiromi Y. Homeotic genes and the homeobox. Annual Review of Genetics. 1986;20:147–173. doi: 10.1146/annurev.ge.20.120186.001051. [DOI] [PubMed] [Google Scholar]
- Gehring WJ. Homeo boxes in the study of development. Science. 1987;236:1245–1252. doi: 10.1126/science.2884726. [DOI] [PubMed] [Google Scholar]
- Guo M, Zhang Y, Zhou J, Bi Y, Xu J, Xu C, Kou X, Zhao Y, Li Y, Tu Z, Liu K, Lin J, Yang P, Gao S, Wang Y. Precise temporal regulation of Dux is important for embryo development. Cell Research. 2019;29:956–959. doi: 10.1038/s41422-019-0238-4. [DOI] [PMC free article] [PubMed] [Google Scholar]
- Guo Y, Kawaguchi A, Takeshita M, Sekiya T, Hirohama M, Yamashita A, Siomi H, Murano K. Potent mouse monoclonal antibodies that block SARS-CoV-2 infection. The Journal of Biological Chemistry. 2021;296:100346. doi: 10.1016/j.jbc.2021.100346. [DOI] [PMC free article] [PubMed] [Google Scholar]
- Guo Y, Li TD, Modzelewski AJ, Siomi H. Retrotransposon renaissance in early embryos. Trends in Genetics. 2024;40:39–51. doi: 10.1016/j.tig.2023.10.010. [DOI] [PubMed] [Google Scholar]
- Hao Y, Hao S, Andersen-Nissen E, Mauck WM, Zheng S, Butler A, Lee MJ, Wilk AJ, Darby C, Zager M, Hoffman P, Stoeckius M, Papalexi E, Mimitou EP, Jain J, Srivastava A, Stuart T, Fleming LM, Yeung B, Rogers AJ, McElrath JM, Blish CA, Gottardo R, Smibert P, Satija R. Integrated analysis of multimodal single-cell data. Cell. 2021;184:3573–3587. doi: 10.1016/j.cell.2021.04.048. [DOI] [PMC free article] [PubMed] [Google Scholar]
- Hendrickson PG, Doráis JA, Grow EJ, Whiddon JL, Lim J-W, Wike CL, Weaver BD, Pflueger C, Emery BR, Wilcox AL, Nix DA, Peterson CM, Tapscott SJ, Carrell DT, Cairns BR. Conserved roles of mouse DUX and human DUX4 in activating cleavage-stage genes and MERVL/HERVL retrotransposons. Nature Genetics. 2017;49:925–934. doi: 10.1038/ng.3844. [DOI] [PMC free article] [PubMed] [Google Scholar]
- Hu Y, Yang Y, Tan P, Zhang Y, Han M, Yu J, Zhang X, Jia Z, Wang D, Yao K, Pang H, Hu Z, Li Y, Ma T, Liu K, Ding S. Induction of mouse totipotent stem cells by a defined chemical cocktail. Nature. 2023;617:792–797. doi: 10.1038/s41586-022-04967-9. [DOI] [PubMed] [Google Scholar]
- Inoue K, Ogonuki N, Kamimura S, Inoue H, Matoba S, Hirose M, Honda A, Miura K, Hada M, Hasegawa A, Watanabe N, Dodo Y, Mochida K, Ogura A. Loss of H3K27me3 imprinting in the Sfmbt2 miRNA cluster causes enlargement of cloned mouse placentas. Nature Communications. 2020;11:2150. doi: 10.1038/s41467-020-16044-8. [DOI] [PMC free article] [PubMed] [Google Scholar]
- Ji S, Chen F, Stein P, Wang J, Zhou Z, Wang L, Zhao Q, Lin Z, Liu B, Xu K, Lai F, Xiong Z, Hu X, Kong T, Kong F, Huang B, Wang Q, Xu Q, Fan Q, Liu L, Williams CJ, Schultz RM, Xie W. OBOX regulates mouse zygotic genome activation and early development. Nature. 2023;620:1047–1053. doi: 10.1038/s41586-023-06428-3. [DOI] [PMC free article] [PubMed] [Google Scholar]
- Langmead B, Salzberg SL. Fast gapped-read alignment with Bowtie 2. Nature Methods. 2012;9:357–359. doi: 10.1038/nmeth.1923. [DOI] [PMC free article] [PubMed] [Google Scholar]
- Lee MT, Bonneau AR, Giraldez AJ. Zygotic genome activation during the maternal-to-zygotic transition. Annual Review of Cell and Developmental Biology. 2014;30:581–613. doi: 10.1146/annurev-cellbio-100913-013027. [DOI] [PMC free article] [PubMed] [Google Scholar]
- Leidenroth A, Hewitt JE. A family history of DUX4: phylogenetic analysis of DUXA, B, C and Duxbl reveals the ancestral DUX gene. BMC Evolutionary Biology. 2010;10:1–13. doi: 10.1186/1471-2148-10-364. [DOI] [PMC free article] [PubMed] [Google Scholar]
- Lewin TD, Royall AH, Holland PWH. Dynamic molecular evolution of mammalian homeobox genes: duplication, loss, divergence and gene conversion sculpt PRDClass repertoires. Journal of Molecular Evolution. 2021;89:396–414. doi: 10.1007/s00239-021-10012-6. [DOI] [PMC free article] [PubMed] [Google Scholar]
- Liao Y, Smyth GK, Shi W. featureCounts: an efficient general purpose program for assigning sequence reads to genomic features. Bioinformatics. 2014;30:923–930. doi: 10.1093/bioinformatics/btt656. [DOI] [PubMed] [Google Scholar]
- Love MI, Huber W, Anders S. Moderated estimation of fold change and dispersion for RNA-seq data with DESeq2. Genome Biology. 2014;15:550. doi: 10.1186/s13059-014-0550-8. [DOI] [PMC free article] [PubMed] [Google Scholar]
- Macfarlan TS, Gifford WD, Agarwal S, Driscoll S, Lettieri K, Wang J, Andrews SE, Franco L, Rosenfeld MG, Ren B, Pfaff SL. Endogenous retroviruses and neighboring genes are coordinately repressed by LSD1/KDM1A. Genes & Development. 2011;25:594–607. doi: 10.1101/gad.2008511. [DOI] [PMC free article] [PubMed] [Google Scholar]
- Macfarlan TS, Gifford WD, Driscoll S, Lettieri K, Rowe HM, Bonanomi D, Firth A, Singer O, Trono D, Pfaff SL. Embryonic stem cell potency fluctuates with endogenous retrovirus activity. Nature. 2012;487:57–63. doi: 10.1038/nature11244. [DOI] [PMC free article] [PubMed] [Google Scholar]
- Madissoon E, Jouhilahti EM, Vesterlund L, Töhönen V, Krjutškov K, Petropoulos S, Einarsdottir E, Linnarsson S, Lanner F, Månsson R, Hovatta O, Bürglin TR, Katayama S, Kere J. Characterization and target genes of nine human PRD-like homeobox domain genes expressed exclusively in early embryos. Scientific Reports. 2016;6:28995. doi: 10.1038/srep28995. [DOI] [PMC free article] [PubMed] [Google Scholar]
- Maeso I, Dunwell TL, Wyatt CDR, Marlétaz F, Vető B, Bernal JA, Quah S, Irimia M, Holland PWH. Evolutionary origin and functional divergence of totipotent cell homeobox genes in eutherian mammals. BMC Biology. 2016;14:45. doi: 10.1186/s12915-016-0267-0. [DOI] [PMC free article] [PubMed] [Google Scholar]
- Markoulaki S, Meissner A, Jaenisch R. Somatic cell nuclear transfer and derivation of embryonic stem cells in the mouse. Methods. 2008;45:101–114. doi: 10.1016/j.ymeth.2008.04.002. [DOI] [PubMed] [Google Scholar]
- McGinnis W, Hart CP, Gehring WJ, Ruddle FH. Molecular cloning and chromosome mapping of a mouse DNA sequence homologous to homeotic genes of Drosophila. Cell. 1984a;38:675–680. doi: 10.1016/0092-8674(84)90262-9. [DOI] [PubMed] [Google Scholar]
- McGinnis W, Levine MS, Hafen E, Kuroiwa A, Gehring WJ. A conserved DNA sequence in homoeotic genes of the Drosophila Antennapedia and bithorax complexes. Nature. 1984b;308:428–433. doi: 10.1038/308428a0. [DOI] [PubMed] [Google Scholar]
- Pohl A, Beato M. bwtool: a tool for bigWig files. Bioinformatics. 2014;30:1618–1619. doi: 10.1093/bioinformatics/btu056. [DOI] [PMC free article] [PubMed] [Google Scholar]
- Posfai E, Schell JP, Janiszewski A, Rovic I, Murray A, Bradshaw B, Yamakawa T, Pardon T, El Bakkali M, Talon I, De Geest N, Kumar P, To SK, Petropoulos S, Jurisicova A, Pasque V, Lanner F, Rossant J. Evaluating totipotency using criteria of increasing stringency. Nature Cell Biology. 2021;23:49–60. doi: 10.1038/s41556-020-00609-2. [DOI] [PubMed] [Google Scholar]
- Rajkovic A, Yan C, Yan W, Klysik M, Matzuk MM. Obox, a family of homeobox genes preferentially expressed in germ cells. Genomics. 2002;79:711–717. doi: 10.1006/geno.2002.6759. [DOI] [PubMed] [Google Scholar]
- Ramírez F, Ryan DP, Grüning B, Bhardwaj V, Kilpert F, Richter AS, Heyne S, Dündar F, Manke T. deepTools2: a next generation web server for deep-sequencing data analysis. Nucleic Acids Research. 2016;44:W160–W165. doi: 10.1093/nar/gkw257. [DOI] [PMC free article] [PubMed] [Google Scholar]
- Sakashita A, Kitano T, Ishizu H, Guo Y, Masuda H, Ariura M, Murano K, Siomi H. Transcription of MERVL retrotransposons is required for preimplantation embryo development. Nature Genetics. 2023;55:484–495. doi: 10.1038/s41588-023-01324-y. [DOI] [PMC free article] [PubMed] [Google Scholar]
- Sakurai T, Watanabe S, Kamiyoshi A, Sato M, Shindo T. A single blastocyst assay optimized for detecting CRISPR/Cas9 system-induced indel mutations in mice. BMC Biotechnology. 2014;14:1–11. doi: 10.1186/1472-6750-14-69. [DOI] [PMC free article] [PubMed] [Google Scholar]
- Sasaki F, Okuno T, Saeki K, Min L, Onohara N, Kato H, Shimizu T, Yokomizo T. A high-affinity monoclonal antibody against the FLAG tag useful for G-protein-coupled receptor study. Analytical Biochemistry. 2012;425:157–165. doi: 10.1016/j.ab.2012.03.014. [DOI] [PubMed] [Google Scholar]
- Scott MP, Weiner AJ. Structural relationships among genes that control development: sequence homology between the Antennapedia, Ultrabithorax, and fushi tarazu loci of Drosophila. PNAS. 1984;81:4115–4119. doi: 10.1073/pnas.81.13.4115. [DOI] [PMC free article] [PubMed] [Google Scholar]
- Shen H, Yang M, Li S, Zhang J, Peng B, Wang C, Chang Z, Ong J, Du P. Mouse totipotent stem cells captured and maintained through spliceosomal repression. Cell. 2021;184:2843–2859. doi: 10.1016/j.cell.2021.04.020. [DOI] [PubMed] [Google Scholar]
- Skene PJ, Henikoff S. An efficient targeted nuclease strategy for high-resolution mapping of DNA binding sites. eLife. 2017;6:e21856. doi: 10.7554/eLife.21856. [DOI] [PMC free article] [PubMed] [Google Scholar]
- Suwińska A, Czołowska R, Ozdzeński W, Tarkowski AK. Blastomeres of the mouse embryo lose totipotency after the fifth cleavage division: expression of Cdx2 and Oct4 and developmental potential of inner and outer blastomeres of 16- and 32-cell embryos. Developmental Biology. 2008;322:133–144. doi: 10.1016/j.ydbio.2008.07.019. [DOI] [PubMed] [Google Scholar]
- Svoboda P, Stein P, Anger M, Bernstein E, Hannon GJ, Schultz RM. RNAi and expression of retrotransposons MuERV-L and IAP in preimplantation mouse embryos. Developmental Biology. 2004;269:276–285. doi: 10.1016/j.ydbio.2004.01.028. [DOI] [PubMed] [Google Scholar]
- Svoboda P. Mammalian zygotic genome activation. Seminars in Cell & Developmental Biology. 2018;84:118–126. doi: 10.1016/j.semcdb.2017.12.006. [DOI] [PubMed] [Google Scholar]
- Tadros W, Lipshitz HD. The maternal-to-zygotic transition: a play in two acts. Development. 2009;136:3033–3042. doi: 10.1242/dev.033183. [DOI] [PubMed] [Google Scholar]
- Takeuchi C, Murano K, Ishikawa M, Okano H, Iwasaki YW. Generation of stable Drosophila ovarian somatic cell lines using the piggyBac system. Methods in Molecular Biology. 2022;2509:143–153. doi: 10.1007/978-1-0716-2380-0_9. [DOI] [PubMed] [Google Scholar]
- Tarkowski AK. Experiments on the development of isolated blastomers of mouse eggs. Nature. 1959a;184:1286–1287. doi: 10.1038/1841286a0. [DOI] [PubMed] [Google Scholar]
- Tarkowski AK. Experimental studies on regulation in the development of isolated blastomeres of mouse eggs; Badania eksperymentalne nad rozwojem izolowanych blastomerów jaj myszy. Acta Theriologica. 1959b;3:191–267. doi: 10.4098/AT.arch.59-11. [DOI] [Google Scholar]
- Töhönen V, Katayama S, Vesterlund L, Jouhilahti E-M, Sheikhi M, Madissoon E, Filippini-Cattaneo G, Jaconi M, Johnsson A, Bürglin TR, Linnarsson S, Hovatta O, Kere J. Novel PRD-like homeodomain transcription factors and retrotransposon elements in early human development. Nature Communications. 2015;6:8207. doi: 10.1038/ncomms9207. [DOI] [PMC free article] [PubMed] [Google Scholar]
- Wagner A. Genetic redundancy caused by gene duplications and its evolution in networks of transcriptional regulators. Biological Cybernetics. 1996;74:557–567. doi: 10.1007/BF00209427. [DOI] [PubMed] [Google Scholar]
- Whiddon JL, Langford AT, Wong CJ, Zhong JW, Tapscott SJ. Conservation and innovation in the DUX4-family gene network. Nature Genetics. 2017;49:935–940. doi: 10.1038/ng.3846. [DOI] [PMC free article] [PubMed] [Google Scholar]
- Wilming LG, Boychenko V, Harrow JL. Comprehensive comparative homeobox gene annotation in human and mouse. Database. 2015;2015:bav091. doi: 10.1093/database/bav091. [DOI] [PMC free article] [PubMed] [Google Scholar]
- Wu J, Huang B, Chen H, Yin Q, Liu Y, Xiang Y, Zhang B, Liu B, Wang Q, Xia W, Li W, Li Y, Ma J, Peng X, Zheng H, Ming J, Zhang W, Zhang J, Tian G, Xu F, Chang Z, Na J, Yang X, Xie W. The landscape of accessible chromatin in mammalian preimplantation embryos. Nature. 2016;534:652–657. doi: 10.1038/nature18606. [DOI] [PubMed] [Google Scholar]
- Xiong Z, Xu K, Lin Z, Kong F, Wang Q, Quan Y, Sha Q-Q, Li F, Zou Z, Liu L, Ji S, Chen Y, Zhang H, Fang J, Yu G, Liu B, Wang L, Wang H, Deng H, Yang X, Fan H-Y, Li L, Xie W. Ultrasensitive Ribo-seq reveals translational landscapes during mammalian oocyte-to-embryo transition and pre-implantation development. Nature Cell Biology. 2022;24:968–980. doi: 10.1038/s41556-022-00928-6. [DOI] [PubMed] [Google Scholar]
- Yates AD, Achuthan P, Akanni W, Allen J, Allen J, Alvarez-Jarreta J, Amode MR, Armean IM, Azov AG, Bennett R, Bhai J, Billis K, Boddu S, Marugán JC, Cummins C, Davidson C, Dodiya K, Fatima R, Gall A, Giron CG, Gil L, Grego T, Haggerty L, Haskell E, Hourlier T, Izuogu OG, Janacek SH, Juettemann T, Kay M, Lavidas I, Le T, Lemos D, Martinez JG, Maurel T, McDowall M, McMahon A, Mohanan S, Moore B, Nuhn M, Oheh DN, Parker A, Parton A, Patricio M, Sakthivel MP, Abdul Salam AI, Schmitt BM, Schuilenburg H, Sheppard D, Sycheva M, Szuba M, Taylor K, Thormann A, Threadgold G, Vullo A, Walts B, Winterbottom A, Zadissa A, Chakiachvili M, Flint B, Frankish A, Hunt SE, IIsley G, Kostadima M, Langridge N, Loveland JE, Martin FJ, Morales J, Mudge JM, Muffato M, Perry E, Ruffier M, Trevanion SJ, Cunningham F, Howe KL, Zerbino DR, Flicek P. Ensembl 2020. Nucleic Acids Research. 2020;48:D682–D688. doi: 10.1093/nar/gkz966. [DOI] [PMC free article] [PubMed] [Google Scholar]
- Yu G, Wang LG, He QY. ChIPseeker: an R/Bioconductor package for ChIP peak annotation, comparison and visualization. Bioinformatics. 2015;31:2382–2383. doi: 10.1093/bioinformatics/btv145. [DOI] [PubMed] [Google Scholar]
- Zhang Y, Liu T, Meyer CA, Eeckhoute J, Johnson DS, Bernstein BE, Nusbaum C, Myers RM, Brown M, Li W, Liu XS. Model-based analysis of ChIP-Seq (MACS) Genome Biology. 2008;9:1–9. doi: 10.1186/gb-2008-9-9-r137. [DOI] [PMC free article] [PubMed] [Google Scholar]
- Zhong Y, Holland PWH. The dynamics of vertebrate homeobox gene evolution: gain and loss of genes in mouse and human lineages. BMC Evolutionary Biology. 2011a;11:1–13. doi: 10.1186/1471-2148-11-169. [DOI] [PMC free article] [PubMed] [Google Scholar]
- Zhong YF, Holland PWH. HomeoDB2: functional expansion of a comparative homeobox gene database for evolutionary developmental biology. Evolution & Development. 2011b;13:567–568. doi: 10.1111/j.1525-142X.2011.00513.x. [DOI] [PMC free article] [PubMed] [Google Scholar]
- Zhu Y, Yu J, Gu J, Xue C, Zhang L, Chen J, Shen L. Relaxed 3D genome conformation facilitates the pluripotent to totipotent-like state transition in embryonic stem cells. Nucleic Acids Research. 2021;49:12167–12177. doi: 10.1093/nar/gkab1069. [DOI] [PMC free article] [PubMed] [Google Scholar]
- Zou Z, Zhang C, Wang Q, Hou Z, Xiong Z, Kong F, Wang Q, Song J, Liu B, Liu B, Wang L, Lai F, Fan Q, Tao W, Zhao S, Ma X, Li M, Wu K, Zhao H, Chen ZJ, Xie W. Translatome and transcriptome co-profiling reveals a role of TPRXs in human zygotic genome activation. Science. 2022;378:abo7923. doi: 10.1126/science.abo7923. [DOI] [PubMed] [Google Scholar]


