

Abstract
Background
MicroRNAs (miRNAs) are small RNA molecules that play a regulatory role in various biological processes by acting as intracellular mediators. They hold great potential as therapeutic agents for targeting human disease pathways; however, there is still much to be uncovered about their mechanism of gene regulation. Alopecia areata (AA) is a commonly occurring inflammatory condition characterized by the infiltration of T cells that specifically target the anagen‐stage hair follicle. The limited understanding of its precise cellular mechanism may be the reason behind the scarcity of effective treatments for AA.
Aim
The significance and function of hsa‐miR‐193a‐5p as a genetic marker for AA and its potential influence on the advancement of the disease.
Subjects and methods
A case‐control study comprised 77 individuals diagnosed with AA who were matched with 75 healthy controls. In order to measure the expression of miR‐200c‐3p in both groups, the real‐time PCR technique was utilized. The prediction of suitable genes for hsa‐miR‐193a‐5p, as well as the identification of pathways and gene‐gene interactions, were carried out using bioinformatic tools.
Results
The levels of hsa‐miR‐193a‐5p expression were notably elevated in AA patients in comparison to healthy controls. Our prediction suggests that the involvement of hsa‐miR‐193a‐5p in the development of AA is significant due to its influence on the inositol phosphorylation pathway and the Phosphatidylinositol signaling system, achieved through its direct impact on the IPPK gene.
Conclusion
For the first time, our study demonstrates the significant over‐expression of a new miRNA, hsa‐miR‐193a‐5p, in the blood of AA patients compared to controls, and highlights its impact on the IPPK gene and the inositol phosphorylation and Phosphatidylinositol signaling pathways, suggesting a potential therapeutic role for hsa‐miR‐193a‐5p in AA.
Keywords: alopecia areata, hsa‐miR‐193a‐5p, inositol, IPPK
1. INTRODUCTION
Alopecia areata (AA) is an autoimmune disease typically relapsing or remitting that preserves the hair follicle while causing temporary, non‐scarring hair loss. AA is a common type of hair loss considered as second‐most frequent non‐scarring alopecia, after male and female pattern alopecia. 1 About 2% of the general population will experience AA. AA is a complicated, polygenic condition, as demonstrated by genetic research conducted on people and mouse models. Numerous genetic susceptibility loci linked to signaling pathways crucial to the growth and cycling of hair follicles have been found. 2
Clinical patterns of hair loss in AA are usually very distinct. The most common pattern is a patchy lesion, usually on the scalp, that can progress to total loss of scalp hair only (alopecia totalis), and total loss of all body hair (alopecia universalis). 3 Although dermoscopy, trichoscopy, and histopathology can be useful, clinical signs are often used to diagnose AA. Skin biopsies show a lymphocytic infiltration in and around the hair follicle's bulb or lower portion during the anagen phase. One of the main hypothesized causes of AA is a disruption of the immune system of the hair follicle. 4 Although AA is a difficult condition to treat medically, new discoveries about the underlying molecular causes of the condition may soon lead to remission. 1
Small (21−25 nucleotide) noncoding RNA molecules known as microRNAs (miRNAs) play a role in post‐transcriptional regulation of gene expression through the translation repression or degradation of messenger RNAs. 5 MiRNAs are thought to control between 30% and 80% of human genes. One mRNA may be impacted by many miRNAs, and each miRNA has the ability to control up to 200 projected target genes. 6
MiRNAs may have a role in immune responses and autoimmune diseases, particularly those affecting the skin, according to the research. 7 MiRNAs are essential regulators of the Th17/T regulatory (Treg) cell balance, which is involved in the onset and course of autoimmune disease. 8 , 9 , 10
While research has shown that miRNAs are crucial in controlling inflammatory skin conditions including psoriasis and atopic dermatitis, little is known about how miRNAs function in AA. 11
Recent proposals for treating disorders linked to hair follicles and male pattern baldness have included gene‐based therapeutics targeting hair follicles, which include antisense oligonucleotides, small interfering RNAs, and miRNAs. 12 , 13
In our vast population, numerous and extensive research investigations have been conducted to comprehensively comprehend and elucidate the intricate and complex interplay between the underlying genetic factors and the multifarious dermatological conditions that afflict individuals. However, it is imperative to underscore that, to the best of our knowledge and in light of the existing body of literature, no study has hitherto endeavored to meticulously unravel and ascertain the underlying and elusive mechanisms through which miRNAs intricately and actively contribute to the pathogenesis and manifestation of AA, a highly enigmatic and perplexing autoimmune dermatological disorder. Hence, the need for further comprehensive and in‐depth exploration and inquiry is paramount to fully comprehending and delineating the multifaceted and intricate role that miRNAs play in the etiology and progression of AA. 14 , 15 , 16 , 17 , 18 , 19 , 20 , 21 , 22 , 23 , 24
1.1. Aim of the study
The primary purpose of our research is to thoroughly investigate and analyze the significance and function of the miRNA hsa‐miR‐193a‐5p within the context of AA, to establish it as a groundbreaking and innovative therapeutic and diagnostic approach. In addition, our research endeavors to determine the impact of miRNA hsa‐miR‐193a‐5p expression on the intricate pathway involved in AA, thereby further elucidating the complex relationship between this specific miRNA and the development and progression of this hair loss condition. By immersing ourselves in the exploration of this pathway, we hope to uncover essential insights and valuable knowledge that have the potential to significantly contribute to a more profound understanding of AA, eventually paving the way for the formulation and implementation of more effective treatment strategies.
2. SUBJECTS AND METHODS
2.1. Subjects
This investigation is classified as a case‐control study, highlighting the examination of 77 individuals diagnosed with AA in conjunction with 75 individuals serving as the control group, representing a sample size that is both sufficiently robust and representative. To ensure the ethical integrity of the study, the necessary approval was obtained from the esteemed Ethics Committee of Shaqra University, thereby affirming the adherence to stringent regulatory standards. The official agreement reference number, ERC_SU_202300031, serves as an unequivocal testament to the meticulousness and procedural diligence that underpinned the research endeavor. Additionally, it is of paramount importance to underscore the pivotal role of informed consent, which was diligently sought from each of the participants, who provided their explicit endorsement through the medium of written documentation.
The comprehensive nature of this study was manifest in the meticulous attention to detail that characterized the compilation of the medical histories of both the AA patients and the control group. Through a judiciously curated set of data points, encompassing demographic characteristics, records pertaining to the specific manifestation of AA, as well as the careful cataloging of medication use, the researchers sought to establish a foundation of knowledge that could be systematically analyzed and compared. This strategic approach facilitated the identification of potential correlations and insights that would subsequently inform the overarching objectives of the study, thus ensuring the achievement of robust outcomes and meaningful contributions to the field of research.
2.1.1. Inclusion criteria
Patients with a clinically verified diagnosis of AA (patchy or ophiasis), regardless of gender or age, and those who have not had therapy in the past 3 months are eligible.
2.1.2. Exclusion criteria
Alopecia totalis, alopecia universalis, and other causes of alopecia like telogen effluvium, tinea capitis, and trichotillomania. For the past 6 months, the patients had been taking vitamin D supplements or other vitamins. Patients with a documented vitamin D deficiency, pregnancy or nursing.
2.2. RNA extraction and RT‐PCR
Total plasma miRNAs were extracted utilizing the Direct‐zol™ RNA MiniPrep (Zymo Research) following the guidelines provided by the manufacturer. Each RNA specimen was measured utilizing a spectrophotometer (NanoDrop 1000, Thermo Scientific, Wilmington, Delaware). The extracted miRNAs were transformed into complementary DNA (cDNA) utilizing the miRCURY LNA RT kit (Qiagen). qRT‐PCR reactions were performed using the cDNA and the miRCURY LNA SYBR Green PCR Kit (Qiagen) (which contains primers for hsa‐miR‐193a‐5p and a housekeeping gene) employing a Bio‐Rad iCycler (Bio‐Rad Laboratories, Hercules, CA). Quantitative real‐time polymerase chain reactions were carried out in duplicate for all samples. qRT‐PCR data analysis: The relative gene expression level was determined using the 2−(ΔΔCt) equation.
2.3. Target genes analysis
To enhance our comprehension of the biological activity of the noteworthy, dysregulated miRNAs, we employed the TargetScan https://www.targetscan.org/vert_80/, miRDB https://mirdb.org/, MirTarBase 9.0 https://mirtarbase.cuhk.edu.cn/, and miRWalk http://mirwalk.umm.uni‐heidelberg.de/ databases to anticipate their potential target genes with a confidence interval (CIs) of 95%. To attain a comprehensive understanding of the biological functions of the differential miRNAs and their target genes, we analyzed the KEGG pathway and the GO process pathway utilizing the Shiny Go 0.77 website available at http://bioinformatics.sdstate.edu/go/. A summary of this study design is shown in Figure 1.
FIGURE 1.

A summary of this study design.
2.4. Statistical analysis
The data was analyzed using SPSS software version 17. To assess the accuracy of hsa‐miR‐193a‐5p, ROC curve analysis was employed. The selection of optimal cut‐off values was based on maximizing both sensitivity and specificity for prediction. The area under the curve (AUC) criteria was utilized to determine the accuracy. Hypothesis testing was conducted using two‐sided tests at a significance level of 0.05. Various statistical tests such as independent t‐tests, chi‐square tests, and One‐way ANOVA tests were employed to compare groups and explore relationships between the data.
3. RESULTS
3.1. Clinical and demographic information for patients and controls
The extensive (Table 1) provides a thorough presentation of the clinical and general data related to both the individuals diagnosed with AA as well as the controls. It is important to note that there is a noticeable disparity in the expression of hsa‐miR‐193a‐5p between the individuals with AA and controls, with the former group demonstrating a higher level of expression (p = 0.001) (Figure 2). This observation implies a potential association between this specific hsa‐miR‐193a‐5p and the occurrence of AA in these individuals, thereby indicating a potential role of hsa‐miR‐193a‐5p in the onset or advancement of AA.
TABLE 1.
Clinical and laboratory characteristics for AA patients and healthy controls.
| Variables |
AA patients (N = 77) |
Healthy controls (N = 75) |
p‐value |
|---|---|---|---|
| Age (mean ± SD) | 28.9 ± 4.5 | 30.3 ± 6.2 | 0.154 |
| Male (N/%) | 44 (57%) | 40 (53.3%) | 0.682 |
| Female (N/%) | 33 (43%) | 35 (46.7%) | 0.452 |
| AA type | |||
| ‐ Localized patchy | 38 (49%) | —‐ | NA |
| ‐ Multiples patchy | 30 (39%) | —‐ | NA |
| ‐ Ophiasis | 9 (12%) | —‐ | NA |
Abbreviations: %: percentage, SD, standard deviation; AA, alopecia areata; N, number; NA, not applied.
FIGURE 2.

The difference in hsa‐miR‐193a‐5p folding change (2‐∆∆ct) for AA patients and healthy controls.
3.2. The alternation at hsa‐miR‐193a‐5p expression in AA patients
The expression of hsa‐miR‐193a‐5p in disease identification demonstrates a remarkably high level of accuracy, as evidenced by the impressive AUC value of 0.80. This value serves as a testament to the robustness of the test, as it has a strong ability to distinguish between individuals with the disease and those without. The CIs associated with this prediction, ranging from 68% to 91%, further support the reliability of these findings, indicating a high level of certainty in the accuracy of the test. Additionally, the p‐value of 0.001 linked to this prediction provides additional evidence of the significance of the results, suggesting that the likelihood of obtaining such outcomes by chance alone is very low.
To achieve this exceptional level of diagnostic accuracy, a specific threshold value of 1.07 for hsa‐miR‐193a‐5p expression was utilized. This means that individuals surpassing this threshold were classified as having the disease, while those falling below it were classified as non‐affected. The sensitivity of this prediction, which measures the proportion of correctly identified true positive cases as determined by the test, was determined to be 80.3%. This indicates that the test successfully detected the presence of the disease in most cases, precisely 83.7% of cases. The presence of such a high sensitivity suggests that the test has a low rate of false negatives, therefore reducing the likelihood of overlooking instances of the disease (Figure 3).
FIGURE 3.

ROC curve analysis for hsa‐miR‐193a‐5p expression.
4. BIOINFORMATIC ANALYSIS RESULTS
4.1. Prediction with target genes for hsa‐miR‐193a‐5p
To conduct a thorough investigation into the potential target genes of the differentially expressed miRNAs, an analysis was performed utilizing the highly regarded miRWalk tool. This comprehensive analysis encompassed the utilization of a multitude of target prediction algorithms, including but not limited to TargetScan, mirDB, and MirTarBase. The primary objective of this analysis revolved around the classification and annotation of the hsa‐miR‐193a‐5p within three distinct genomic regions, namely the 3′UTR, 5′UTR, and CDS. The selection of these target genes was meticulously based on a set of specific criteria, which encompassed a high binding probability, low binding energy, and the presence of the esteemed Adenylate‐uridylate (AU)‐rich elements (AREs).
Moreover, the precise location of the miRNA attachment on the target gene, whether it be within the 3′UTR, 5′UTR, or CDS, was also thoughtfully considered during the comprehensive analysis. To ensure the utmost thoroughness in the evaluation of hsa‐miR‐193a‐5p, multiple target prediction tools were employed, namely miRWalk, TargetScan, mirDB, and MirTarBase. Consequently, based on the set of criteria and the comprehensive analysis conducted, two noteworthy genes, namely SLC7A1/ENSG00000139514 and SRSF10/ENSG00000188529, were successfully identified as potential targets of hsa‐miR‐193a‐5p within the 3′UTR region, signifying their significant association with this specific miRNA.
Furthermore, within the 5′UTR region, two more genes, namely TNFRSF19/ENSMUSG00000060548, and IPPK/ENSG00000127080, were discerned to be targeted by hsa‐miR‐193a‐5p, further solidifying the potential regulatory effect of this miRNA on gene expression within this genomic region. In addition to these findings, it was also determined that hsa‐miR‐193a‐5p exhibits a potential targeting capability within the coding sequence (CDS) region, as evidenced by the identification of one noteworthy gene, namely ZMYM4/ENSG00000146463, within this region. For a comprehensive and exhaustive list of all predicted target genes, one can refer to the invaluable resource provided in Table 2.
TABLE 2.
Predicted target genes for hsa‐miR‐193a‐5p by bioinformatics tools.
| Gene | Reference sequence ID | Binding probability | Binding energy | AU rich region fraction | Position | Binding site |
|---|---|---|---|---|---|---|
| SLC7A1 | NM_003045 | 1.00 | −12.408 | 0.32 | 3′UTR | 6518,6537 |
| SRSF10 | NM_006625 | 1.00 | −11.585 | 0.6 | 3′UTR | 1177,1198 |
| TNFRSF19 | NM_001204459 | 1.00 | −11.343 | 0.59 | 5′UTR | 285,308 |
| IPPK | NM_022755.6 | 1.00 | −11.322 | 0.27 | 5′UTR | 91,129 |
| ZMYM4 | NM_005095 | 1.00 | −10.708 | 0.46 | CDS | 4052,4076 |
Abbreviations: AU, Adenylate‐uridylate.; CDS, coding sequence; IPPK, inositol‐pentakisphosphate 2‐kinase; SLC7A1, solute carrier family seven member 1; SRSF10, serine and arginine rich splicing factor 10; TNFRSF19, TNF receptor superfamily member 19; UTR, untranslated region; ZMYM4, zinc finger MYM‐type containing 4.
Because the expression levels of genes can either be decreased (downregulated) or increased (upregulated) depending on the presence of various miRNAs and the interaction between these miRNAs, it becomes necessary to assess the appropriateness of certain genes concerning the hsa‐miR‐193a‐5p. To validate this, we employed another tool called shiny Go 0.77 software, which facilitated the analysis of miRNAs that are compatible with the chosen genes and miRNAs interaction with each other.
The results of the analysis have revealed that there are five specific miRNAs, namely hsa‐miR‐193a‐5p, hsa‐miR‐331‐3p, hsa‐miR‐4716‐5p, and hsa‐miR‐4668‐5p that exert a direct influence on the selected genes, which include SLC7A1, SRSF10, TNFRSF19, IPPK, and ZMYM4. It is worth noting that hsa‐miR‐193a‐5p exhibits a significantly higher fold enrichment of 71.7 (with a corresponding p‐value of 3.4E‐07), whereas the fold enrichments for hsa‐miR‐331‐3p, hsa‐miR‐4716‐5p, and hsa‐miR‐4668‐5p are 33.5, 24, and 11, respectively (Figure 4A).
FIGURE 4.
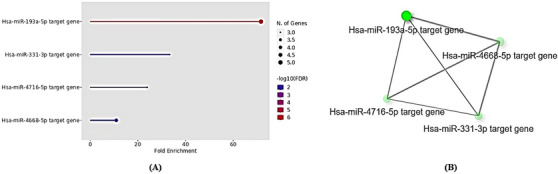
(A) A dot‐plot was performed using Shiny GO 0.77 resource to represent the most common miRNAs interact with the selected genes in this study. (B) The interactive plot also shows the relationship between miRNAs Darker nodes are more significantly and thicker edges represent more overlapped.
The interplay among five miRNAs illustrates that hsa‐miR‐193a‐5p assumes a pivotal role in regulating the expression of specific genes. This is evidenced by the larger size of the node (characterized by its green color) and the edges (denoted by its gray color), which are more pronounced in comparison to the other miRNAs. This observation underscores the significant contribution of hsa‐miR‐193a‐5p in modulating the expression of the targeted genes (Figure 4B).
4.2. Predicted pathways targeted of selected genes
The hypothesis of this study was formulated to comprehend the biological ramifications that arise from the various selected gene expressions, as well as to examine their potential influence on the development of AA. Furthermore, an investigation was undertaken to elucidate the precise role of hsa‐miR‐193a‐5p within these specific genes. To achieve this objective, a comprehensive analysis was conducted, encompassing a KEGG pathway analysis (Figure 5A,B), a GO biological process analysis (Figure 6A,B), and an enrichment analysis. The primary aim of these analyses was to ascertain the intricate mechanisms of transcriptional gene regulation.
FIGURE 5.

A dot‐plot was performed using Shiny GO 0.77 resource to represent the outcomes of KEGG pathway enrichment analyses carried out on and its validated pathways. (A) A hierarchical clustering tree summarizes the correlation among significant pathways targeted genes identified in this study. Pathways with many shared genes are clustered together. Bigger dots indicate more significant p‐values. (B) Fold enrichment showing the percentage of genes belonging to a particular pathway. Pathways have been filtered based on the FDR cut‐off the top 10 most significant pathways are shown here.
FIGURE 6.

A dot‐plot was performed using Shiny GO 0.77 resource to represent the outcomes of GO biological process enrichment analyses carried out on and its validated pathways. (A) A hierarchical clustering tree summarizes the correlation among significant pathways targeted genes identified in this study. Pathways with many shared genes are clustered together. Bigger dots indicate more significant p‐values. (B) Fold enrichment showing the percentage of genes belonging to a particular pathway. Pathways have been filtered based on the FDR cut‐off the top 10 most significant pathways are shown here.
KEGG pathway analysis revealed that the inositol phosphate metabolism pathway (hsa00562) exhibited a significantly higher fold enrichment value of 62.5 compared to all other pathways, with a p‐value of 4.4E‐02. It is noteworthy that the fold enrichments for the Phosphatidylinositol signaling system pathway (hsa04070), the Spliceosome pathway (hsa03040), and the miRNAs in cancer pathway (hsa05206) were 47, 34.5, and 28.3, respectively. Furthermore, our observations indicated that the IPPK gene participated in both the inositol phosphate metabolism pathway (hsa00562) and the Phosphatidylinositol signaling system pathway (hsa04070). Additionally, the SRSF10 gene was found to be involved in the Spliceosome pathway (hsa03040), while the SLC7A1 gene participated in the miRNAs in cancer pathway (hsa05206) (Figure 5A,B).
These results provide evidence of the impact of hsa‐miR‐193a‐5p on two pathways: inositol phosphate metabolism (hsa00562) and Phosphatidylinositol signaling system (hsa04070), exerting a direct influence on the IPPK gene.
A comprehensive GO process pathway analysis was conducted, revealing that the inositol phosphorylation pathway (GO:0052746) exhibited an exceptionally higher fold enrichment value of 1519.7 when compared to all the other pathways. This significant finding is further supported by a p‐value of 2.8E‐02. It is crucial to emphasize that several other pathways also displayed noteworthy fold enrichments. For instance, the L‐histidine transmembrane transport (GO:0089709), L‐arginine import across the plasma membrane (GO:0097638), L‐lysine transport (GO:1902022), L‐ornithine transmembrane transport (GO:1903352), Ornithine transport (GO:0015822), L‐arginine transport (GO:1902023), Pos. reg. of transcription of nucleolar large rRNA by RNA polymerase I (GO:1901838), Inositol metabolic proc (GO:0006020), and arginine transport (GO:0015809) all displayed fold enrichments. These fold enrichments were computed to be 759.9, 759.9, 759.9, 759.9, 651.3, 455.9, 414.5, 379.9, and 379.9 respectively, further highlighting their relevance and significance within the biological context (Figure 6A,B).
Genes that are associated with the process pathways of gene ontology (GO) include IPPK, which plays a crucial role in the phosphorylation of inositol. Another gene involved in these pathways is responsible for positively regulating the transcription of nucleolar large rRNA through RNA polymerase I. Moreover, there is a gene involved in the metabolic process of inositol. On the other hand, SLC7A1 is responsible for various transmembrane transport functions, such as the transportation of L‐histidine across the cell membrane, the import of L‐arginine through the plasma membrane, the transport of L‐lysine, the transmembrane transportation of L‐ornithine, as well as the transport of ornithine itself. Additionally, this gene is involved in the transportation of arginine and L‐arginine.
4.3. Functional annotation of differentially expressed genes
To explicate the specific role played by hsa‐miR‐193a‐5p in the biological processes impacted by the differentially expressed genes identified in this investigation, a comprehensive and thorough analysis of functional annotation networks was conducted. This comprehensive analysis aimed to shed light on the intricate connections between the various pathways under scrutiny (Figure 7).
FIGURE 7.

The interactive plot also shows the relationship between enriched gene ontology and enriched pathway using ShinyGO 0.77 software. Two pathways (nodes) are connected if they share 20% (default) or more genes. Darker nodes are more significantly enriched gene sets. Bigger nodes represent larger gene sets. Thicker edges represent more overlapped genes.
Upon undertaking a meticulous and rigorous examination of the network, it became evident that the pathways of gene expression exhibit a mutually influential relationship, particularly regarding the interaction between the inositol phosphorylation pathway and the Phosphatidylinositol signaling system pathway. These two pathways were found to possess darker nodes and a greater thickness of edges (Figure 7). Nodes with a darker color, indicate the presence of significantly enriched gene sets. Additionally, an interesting observation was made regarding the size of the nodes within the network, as it was found to directly correspond to the size of the gene sets, they represent. In other words, larger nodes symbolize larger gene sets within the network. Additionally, the thickness of the edges connecting the nodes reflects the degree of overlap between the associated genes (Table 3).
TABLE 3.
The network dot and edges size.
| A) Dot size | |
|---|---|
| Id | Dot size |
|
5.566369114 |
|
5.566369114 |
|
5.566369114 |
|
5.566369114 |
| B) Network edge | ||
|---|---|---|
| From | To | Width |
| Inositol phosphate metabolism | Phosphatidylinositol signaling system | 5 |
| Inositol phosphate metabolism | Spliceosome | 0.555555556 |
| Phosphatidylinositol signaling system | Spliceosome | 0.555555556 |
| Inositol phosphate metabolism | MicroRNAs in cancer | 0.555555556 |
| Phosphatidylinositol signaling system | MicroRNAs in cancer | 0.555555556 |
| Spliceosome | MicroRNAs in cancer | 0.555555556 |
Note: NB: Network Nodes and edge sizes and edges calculated by Shiny GO 0.77 software.
4.4. Prediction and selection of suitable pathway for hsa‐miR‐193a‐5p in AA patients
From the findings of our study, it was observed that there were higher levels of hsa‐miR‐193a‐5p in patients with alopecia when compared to the control group. This observation prompted us to delve deeper into the underlying mechanism responsible for the elevated expression of hsa‐miR‐200c‐3p. To gain a comprehensive understanding of this mechanism, we employed bioinformatic tools to conduct an extensive analysis. Our analysis led us to propose the existence of a unique pathway that is affected by hsa‐miR‐193a‐5p and contributes to the development of AA.
In line with this perspective, we further delved into the examination of the genes associated with hsa‐miR‐193a‐5p and made a noteworthy observation. Among the identified genes in the study, the IPPK gene appeared to be a more suitable candidate for further investigation. This conclusion was drawn based on several compelling reasons. Notably, the IPPK gene is known to be a key player in two important pathways, namely the inositol phosphorylation pathway (Figure 8) and the Phosphatidylinositol signaling system pathway (Figure 9).
FIGURE 8.

Inositol phosphate metabolism pathway genes are highlighted in red (271158 is IPPK gene).
FIGURE 9.

Phosphatidylinositol signaling system pathway genes are highlighted in red (271158 is IPPK gene).
It is worth noting that both the inositol phosphorylation pathway and the Phosphatidylinositol signaling system pathway exhibited significantly higher fold enrichment. This finding further strengthens the selection of these pathways for further analysis. To support our selection, we conducted a gene‐gene interaction analysis, which provided additional evidence for the relevance of these pathways. Specifically, the dot size and edge thickness displayed congruent and suitable results in relation to the resistance pathway.
5. DISCUSSION
In our research endeavor, we undertook a comprehensive and meticulous study to delve into the intricate and multifaceted function of the hsa‐miR‐193a‐5p, which we have identified as a promising diagnostic and therapeutic tool for AA. As we delved deeper into the intricacies of this intriguing molecule, our primary objective was to shed light on the intricate pathways and mechanisms that are intricately involved in the development and progression of AA. It is of paramount importance to emphasize that, to the best of our knowledge, our study stands as a pioneering effort within our specific population, as we endeavored to address this pressing issue meticulously and systematically for the very first time.
In the current investigation, it was observed that the expression level of hsa‐miR‐193a‐5p was significantly elevated in patients diagnosed with AA in comparison to individuals who were deemed healthy.
MiRNA molecules, although they are small and lack coding potential, play a significant role in the intricate regulation of gene expression. These molecules can bind to messenger RNA (mRNA) molecules and exert their influence by either enhancing or dampening the translation process. 25 In the context of AA, miRNAs have emerged as key players in its pathogenesis. 26 In a study conducted by Wang et al., the researchers successfully identified a subset of miRNAs that displayed differential expression in individuals affected by AA. These miRNAs were found to specifically target pathways associated with immune regulation, shedding light on their potential role in the development and progression of this hair disorder. 27
The specific miRNAs that play a role in the development of AA were identified by Mustafa and his research team. They observed that there is a notable increase in the expression of miRNAs‐203, 146a, and 155 in the affected tissue of individuals with AA. This finding suggests that these particular miRNAs are involved in the pathogenesis of this condition. 26
In a separate study conducted by Maher et al., the group of researchers meticulously examined and scrutinized the relationship between the miRNA34A and rs2666433 (A/G) variants, and their findings unveiled a significant association between these genetic factors and the risk as well as the severity of AA, thereby shedding light on the potential role these elements play in the development and progression of AA. 28 Another investigation conducted on the Egyptian population by Faisal et al revealed noteworthy findings concerning the expression of miRNA‐17‐92a‐1 and the rs4284505 variant, which were found to be significantly linked to AA. 29
The collective evidence from these various studies underscores the pivotal roles that miRNAs play in the development and severity of AA, thereby shedding further light on the critical significance of miRNAs as an emerging biomarker for AA.
Despite the significance and relevance attributed to miRNAs in the development of AA, it is noteworthy to mention that, thus far, no diligent research endeavors have been undertaken to comprehensively investigate and elucidate the intricate intricacies surrounding the role and impact of hsa‐miR‐193a‐5p in this context.
In the current investigation, we have effectively employed bioinformatics tools to provide evidence that hsa‐miR‐193a‐5p exhibits targeting capabilities toward a cluster of five genes, SLC7A1, SRSF10, TNFRSF19, IPPK, and ZMYM4. Numerous prior studies have extensively suggested that the influence of hsa‐miR‐193a‐5p on the expression of the SLC7A1 gene is of significant magnitude, thereby establishing itself as a pivotal player in the regulation of SLC7A1 gene expression. 30 , 31
It is noteworthy to mention that our findings are congruent with those of Fan et al. and his esteemed research team, who have also postulated that hsa‐miR‐193a‐5p possesses the ability to directly target the SRSF10 gene. Moreover, they have further speculated that the miR‐193‐5p/SRSF10 signaling pathway has the potential to serve as a novel therapeutic target for atherosclerosis. 32 In addition, the employment of in silico databases by Polini et al. and his fellow researchers has led to the discovery that TNFRSF19 is indeed a direct target of miR‐193a‐5p, which was subsequently subjected to scrutiny through the utilization of the luciferase assay. 33
Consequently, through the utilization of bioinformatic tools, we have successfully elucidated fresh associations between hsa‐miR‐193a‐5p and two genes, namely IPPK and ZMYM4. The identification of these relationships between hsa‐miR‐193a‐5p and the predicted genes has further underscored the significance of hsa‐miR‐193a‐5p, thus propelling our esteemed research team to delve deeper into the exploration of the pathway that is intrinsically linked to hsa‐miR‐193a‐5p and the predicted genes.
In the present study, after the examination of five genes and their correlation to hsa‐miR‐193a‐5p, several in silico tools were employed to analyze the data. These tools considered various factors, including fold enrichments and gene‐gene interactions. Upon careful examination, it was observed that two specific pathways, inositol phosphate metabolism and Phosphatidylinositol signaling system, displayed a direct association with AA. Additionally, it was noted that the regulation of these two pathways was governed by the IPPK gene. The findings from this study provide valuable insights into the intricate mechanisms underlying the relationship between these genes and their impact on AA.
In eukaryotic cells, Phosphatidylinositol is a type of phospholipid that is synthesized and degraded as part of the intricate process of inositol phosphate metabolism, which plays a crucial role in cellular functioning. Serving as essential messenger molecules in various cellular signaling pathways, these phospholipids act as precursors for the synthesis of water‐soluble inositol phosphates, which are known to be involved in a multitude of cellular processes. These processes include the regulation of intracellular calcium levels, which is crucial for maintaining cellular homeostasis, as well as facilitating the cellular response to external stimuli. 34 , 35 The discovery of the involvement of inositol phosphates in these cellular processes has shed light on the intricate mechanisms through which cells communicate and respond to their environment, highlighting their significance in cellular physiology. 36
The Phosphatidylinositol signaling system, which is involved in a multitude of cellular activities such as membrane trafficking, cell division, and proliferation, represents one of the most critical networks of signaling pathways. 37 To generate second messengers, a dynamic cycle of lipases, phosphatases, and kinases acts upon Phosphatidylinositol. 38 For this Phosphatidylinositol ‐cycle to occur, it is imperative to have the transportation of lipids between two distinct membranes, the plasma membrane, and the endoplasmic reticulum. 39 By synthesizing Phosphatidylinositol and its phosphorylated derivatives, as well as lipid signaling molecules like phosphatidic acid and diacylglycerol, the Phosphatidylinositol‐cycle assumes a pivotal role in the intricate process of cell signaling. 40
The results of our study provide evidence to suggest that both pathways under investigation are influenced by two specific parameters: IPPK and inositol. These parameters have been targeted by the hsa‐miR‐193a‐5p, indicating a potential regulatory role of hsa‐miR‐193a‐5p in the pathways. Furthermore, the involvement of inositol in these pathways sheds light on the significance of inositol in the context of AA. This finding opens new avenues for further research and deepens our understanding of the role of inositol in AA. In the realm of hair function, inositol assumes a significant role, specifically in the intricate process of developing and maintaining hair cells. 41 , 42 , 43
It is worth noting that inositol phosphates, exemplified by inositol 1 , 4 , 5 trisphosphate, emerge as key players in the regulation of cytosolic calcium concentrations, a crucial aspect of hair cell function. Moreover, a constellation of intracellular signaling pathways, including but not limited to Phosphatidylinositol 3‐kinase, protein kinase C, and calcium, assumes a pivotal role in bolstering cell proliferation within mammalian balance epithelia, thereby potentially contributing to the process of hair cell regeneration. 44 , 45
The cells known as dermal papilla cells, which are in the hair follicle, play a crucial role in producing signals that are responsible for controlling the actions of the adjacent epithelial cells throughout the hair cycle. These significant findings propose that the inositol phosphate‐calcium signaling system and activated signaling pathways potentially participate in the intricate mechanisms that underlie the functions of hair, such as its growth, regeneration, and maintenance. Therefore, it can be argued that the communication between dermal papilla cells and epithelial cells is essential for the overall well‐being and functionality of hair. 46 , 47 , 48
From our findings and the utilization of bioinformatics tools, we are able to make a well‐informed estimation regarding the involvement of hsa‐miR‐193a‐5p in the pathogenesis of AA. Specifically, our analysis suggests that hsa‐miR‐193a‐5p may exert a regulatory influence, either upregulating or downregulating, on IPPK, a pivotal player in two significant molecular pathways: inositol phosphorylation and the Phosphatidylinositol signaling system. These pathways are known to elicit changes in the levels of inositol, thereby impacting the progression of AA.
6. CONCLUSION
Our findings clearly show, and for the first time, the significant over‐expression of novel miRNA, hsa‐miR‐193a‐5p, in the blood of patients with AA against controls. Further, we were able to indicate the impact of hsa‐miR‐193a‐5p on IPPK gene which intern controls the inositol phosphorylation pathway and the Phosphatidylinositol signaling system pathway. The results enlighten the era of the potential therapeutic role of this hsa‐miR‐193a‐5p in AA.
7. FUTURE RECOMMENDATION
To further validate the findings of this research, an additional study must be conducted using lesional skin biopsies and a larger sample size of patients. This subsequent study should aim to evaluate the expression levels of IPPK genes. In addition to this, the protein levels of IPPK gene must be quantified using the highly reliable and widely accepted western blot technique.
CONFLICT OF INTEREST STATEMENT
The authors declare no conflicts of interest.
ACKNOWLEDGMENTS
The author would like to thank the Deanship of Scientific Research at Shaqra University for supporting this work. There are no sponsors or funds for the research; the author supported it.
AbdElneam AI, Al‐Dhubaibi MS, Bahaj SS, Mohammed GF, Atef LM. The role of hsa‐miR‐193a‐5p as an important factor for control of inositol in alopecia areata. Skin Res Technol. 2024;30:e13800. 10.1111/srt.13800
DATA AVAILABILITY STATEMENT
The data that support the findings of this study are available from the corresponding author upon reasonable request.
REFERENCES
- 1. Pratt CH, King LE, Messenger AG, Christiano AM, Sundberg JP. Alopecia areata. Nat Rev Dis Primers. 2017;3:17011. [DOI] [PMC free article] [PubMed] [Google Scholar]
- 2. Sundberg JP, Silva KA, Li R, Cox GA, King LE. Adult‐onset Alopecia areata is a complex polygenic trait in the C3H/HeJ mouse model. J Invest Dermatol. 2004;123:294–297. [DOI] [PubMed] [Google Scholar]
- 3. Alessandrini A, Bruni F, Piraccini BM, Starace M. Common causes of hair loss—clinical manifestations, trichoscopy and therapy. J Eur Acad Dermatol Venereol. 2021;35:629–640. [DOI] [PubMed] [Google Scholar]
- 4. Rossi A, Fortuna MC, Pranteda G, et al. Clinical, histological and trichoscopic correlations in scalp disorders. Dermatology. 2015;231:201–208. [DOI] [PubMed] [Google Scholar]
- 5. Godnic I, Zorc M, Jevsinek Skok D, et al. Genome‐wide and species‐wide in silico screening for intragenic MicroRNAs in human, mouse and chicken. PLoS One. 2013;8:e65165. [DOI] [PMC free article] [PubMed] [Google Scholar]
- 6. Barnes MR, Deharo S, Grocock RJ, Brown JR, Sanseau P. The micro RNA target paradigm: a fundamental and polymorphic control layer of cellular expression. Expert Opin Biol Ther. 2007;7:1387–1399. [DOI] [PubMed] [Google Scholar]
- 7. Qu Z, Li W, Fu B. MicroRNAs in autoimmune diseases. Biomed Res Int. 2014;2014:527895. [DOI] [PMC free article] [PubMed] [Google Scholar]
- 8. MiR‐125a targets effector programs to stabilize Treg‐mediated immune homeostasis—PubMed. https://pubmed.ncbi.nlm.nih.gov/25963922/ [DOI] [PubMed]
- 9. Wang JK, Wang Z, Li G. MicroRNA‐125 in immunity and cancer. Cancer Lett. 2019;454:134–145. [DOI] [PubMed] [Google Scholar]
- 10. Park EJ, Shimaoka M, Kiyono H. MicroRNA‐mediated dynamic control of mucosal immunity. Int Immunol. 2017;29:157–163. [DOI] [PubMed] [Google Scholar]
- 11. Qi S‐S, Miao Y, Sheng Y‐Y, Hu R‐M, Zhao J, Yang Q‐P. MicroRNA‐1246 inhibits NFATc1 phosphorylation and regulates T helper 17 cell activation in the pathogenesis of severe alopecia areata. Ann Dermatol. 2023;35:46–55. [DOI] [PMC free article] [PubMed] [Google Scholar]
- 12. Hoefig KP, Heissmeyer V. MicroRNAs grow up in the immune system. Curr Opin Immunol. 2008;20:281–287. [DOI] [PubMed] [Google Scholar]
- 13. Hu S, Li Z, Lutz H, et al. Dermal exosomes containing miR‐218‐5p promote hair regeneration by regulating β‐catenin signaling. Sci Adv. 2020;6:eaba1685. [DOI] [PMC free article] [PubMed] [Google Scholar]
- 14. Abdelneam AI, Al‐Dhubaibi MS, Bahaj SS, Mohammed GF, Alantry AK, Atef LM. Effect of interleukin‐12 gene expression on insulin resistance in patients with acne vulgaris. Skin Res Technol. 2023;29:e13503. [DOI] [PMC free article] [PubMed] [Google Scholar]
- 15. Abdelneam AI, Alhetheli G, Al‐Dhubaibi MS, Bahaj SS. Haplotype analysis and linkage disequilibrium of ApoB gene polymorphisms and its relationship with hyperlipidemia in patients with acne vulgaris. J Gene Med. 2024;26:e3578. [DOI] [PubMed] [Google Scholar]
- 16. Abdelneam AI, Al‐Dhubaibi MS, Bahaj SS, Mohammed GF, Atef LM. Apo B‐48 gene expression and low‐density lipoprotein as a factor for increased insulin resistance and severity of acne. Gene. 2023;885:147703. [DOI] [PubMed] [Google Scholar]
- 17. Abdelneam AI, Al‐Dhubaibi MS, Bahaj SS, Mohammed GF. Role of macrophage scavenger receptor 1 in the progression of dyslipidemia in acne vulgaris patients. Skin Res Technol. 2023;29:e13424. [DOI] [PMC free article] [PubMed] [Google Scholar]
- 18. Mohammed GF, Al‐Dhubaibi MS, Bahaj SS, Abdelneam AI. Alterations in lipid and hormonal titers in patients with acne and their relationship with severity: a case‐control study. Health Sci Rep. 2023;6:e1322. [DOI] [PMC free article] [PubMed] [Google Scholar]
- 19. Abdelneam AI, Al‐Dhubaibi MS, Bahaj SS, Mohammed GF. The vitamin D receptor gene polymorphism rs1544410 T/T genotype as a predictor of factor vitamin D thresholds deficiency in patients with psoriasis vulgaris‐a preliminary study. J Cosmet Dermatol. 2023;22:1642–1646. [DOI] [PubMed] [Google Scholar]
- 20. Alhetheli G, Al‐Dhubaibi MS, Bahaj SS, AbdElneam AI. Vitamin D receptor gene polymorphism ApaI as a predisposing factor for psoriasis and its relation with serum Vitamin D levels and psoriasis severity. Cureus. 2022;14:e32715. [DOI] [PMC free article] [PubMed] [Google Scholar]
- 21. Abdelneam AI, Al‐Dhubaibi MS, Bahaj SS, Mohammed GF. TaqI polymorphism T/t genotypes at the vitamin D receptor gene (VDR) are associated with increased serum vitamin D levels in mild and moderate psoriasis vulgaris: a pilot study. J Gene Med. 2022;24:e3449. [DOI] [PubMed] [Google Scholar]
- 22. Elneam AIA, Alhetheli G, Al‐Dhubaibi MS, Alrheam AIAA, Hassan AE‐S. The association between forkhead box class O3A gene polymorphism and psoriasis and its relationship with psoriasis severity. J Clin Aesthet Dermatol. 2022;15:22–26. [PMC free article] [PubMed] [Google Scholar]
- 23. Abd Elneam AI, Al‐Dhubaibi MS, Abd Alrheam AIA Angiotensin‐converting enzyme (ACE) D allele as a risk factor for increase serum interleukin‐6 and interleukin‐8 in psoriasis patients. Open Access Maced J Med Sci. 2018;6:772–776. [DOI] [PMC free article] [PubMed] [Google Scholar]
- 24. Abdelneam AI, Al‐Dhubaibi MS, Bahaj SS, Alhetheli G. MiR‐200c‐3p as a novel genetic marker and therapeutic tool for alopecia areata. Skin Res Technol. 2024;30:e13639. [DOI] [PMC free article] [PubMed] [Google Scholar]
- 25. Kloosterman WP, Plasterk RHA. The diverse functions of microRNAs in animal development and disease. Dev Cell. 2006;11:441–450. [DOI] [PubMed] [Google Scholar]
- 26. Mustafa AI, Al ‐Refaie AM, El‐Shimi OS, Fawzy E, Sorour NE. Diagnostic implications of MicroRNAs; 155, 146 a, and 203 lesional expression in alopecia areata: a preliminary case‐controlled study. J Cosmet Dermatol. 2022;21:2648–2654. [DOI] [PubMed] [Google Scholar]
- 27. Wang EHC, Destefano GM, Patel AV, et al. Identification of differentially expressed miRNAs in alopecia areata that target immune‐regulatory pathways. Genes Immun. 2017;18:100–104. [DOI] [PubMed] [Google Scholar]
- 28. Maher SA, Ismail NA, Toraih EA, et al. Hair follicle‐related microRNA‐34a serum expression and rs2666433A/G variant in patients with alopecia: a cross‐sectional analysis. Biomolecules. 2022;12:602. [DOI] [PMC free article] [PubMed] [Google Scholar]
- 29. Faisal S, Toraih EA, Atef LM, et al. MicroRNA‐17‐92a‐1 host gene (MIR17HG) expression signature and rs4284505 variant association with alopecia areata: a case‐control study. Genes (Basel). 2022;13:505. [DOI] [PMC free article] [PubMed] [Google Scholar]
- 30. Zheng X, Zhao W, Ji P, et al. High expression of Rap2A is associated with poor prognosis of patients with hepatocellular carcinoma. Int J Clin Exp Pathol. 2017;10:9607–9613. [PMC free article] [PubMed] [Google Scholar]
- 31. Johnson K, Leary PJ, Govaere O, et al. Increased serum miR‐193a‐5p during non‐alcoholic fatty liver disease progression: diagnostic and mechanistic relevance. JHEP Rep. 2022;4:100409. [DOI] [PMC free article] [PubMed] [Google Scholar]
- 32. Fan Y, Zhang Y, Zhao H, et al. lncR‐GAS5 upregulates the splicing factor SRSF10 to impair endothelial autophagy, leading to atherogenesis. Front Med. 2023;17:317–329. [DOI] [PubMed] [Google Scholar]
- 33. Polini B, Carpi S, Doccini S, et al. Tumor suppressor role of hsa‐miR‐193a‐3p and ‐5p in cutaneous melanoma. Int J Mol Sci. 2020;21:6183. [DOI] [PMC free article] [PubMed] [Google Scholar]
- 34. Majerus PW. Inositol phosphate biochemistry. Annu Rev Biochem. 1992;61:225–250. [DOI] [PubMed] [Google Scholar]
- 35. Shears SB. Metabolism of the inositol phosphates produced upon receptor activation. Biochem J. 1989;260:313–324. [DOI] [PMC free article] [PubMed] [Google Scholar]
- 36. Qiu D, Wilson MS, Eisenbeis VB, et al. Analysis of inositol phosphate metabolism by capillary electrophoresis electrospray ionization mass spectrometry. Nat Commun. 2020;11:6035. [DOI] [PMC free article] [PubMed] [Google Scholar]
- 37. Wang X, Deng Y, Gao L, et al. Series‐temporal transcriptome profiling of cotton reveals the response mechanism of phosphatidylinositol signaling system in the early stage of drought stress. Genomics. 2022;114:110465. [DOI] [PubMed] [Google Scholar]
- 38. Poli A, Billi AM, Mongiorgi S, et al. Nuclear phosphatidylinositol signaling: focus on phosphatidylinositol phosphate kinases and phospholipases C. J Cell Physiol. 2016;231:1645–1655. [DOI] [PubMed] [Google Scholar]
- 39.江南谭晓风 & Nan J, T. X. 基于RNA-Seq的油茶种子α-亚麻酸代谢途径及相关基因分析. 林业科学 2014;50:68–75. [Google Scholar]
- 40. Nishikawa M, Hörning M, Ueda M, Shibata T. Excitable signal transduction induces both spontaneous and directional cell asymmetries in the phosphatidylinositol lipid signaling system for eukaryotic chemotaxis. Biophys J. 2014;106:723–734. [DOI] [PMC free article] [PubMed] [Google Scholar]
- 41. Demir B, Cicek D, Orhan C, et al. Effects of a combination of arginine silicate inositol complex and a novel form of biotin on hair and nail growth in a rodent model. Biol Trace Elem Res. 2023;201:751–765. [DOI] [PMC free article] [PubMed] [Google Scholar]
- 42. Relationship of Pantothenic Acid and Inositol to Alopecia in Mice—D. W. Woolley, 1941. https://journals.sagepub.com/doi/abs/10.3181/00379727‐46‐12065?journalCode=ebma
- 43. Zacchè MM, Caputo L, Filippis S, Zacchè G, Dindelli M, Ferrari A. Efficacy of myo‐inositol in the treatment of cutaneous disorders in young women with polycystic ovary syndrome. Gynecol Endocrinol. 2009;25:508–513. [DOI] [PubMed] [Google Scholar]
- 44. Vadnal R, Parthasarathy L, Parthasarathy R. Role of inositol in the treatment of psychiatric disorders. CNS Drugs. 1997;7:6–16. [Google Scholar]
- 45. Gromova OA, Torshin IYu, Tetruashvili NK. Prospects of exogenous inositols in maintaining of skin, hair and nails condition: a review. Gynecology. 2022;24:261–270. [Google Scholar]
- 46. Morgan BA. The dermal papilla: an instructive niche for epithelial stem and progenitor cells in development and regeneration of the hair follicle. Cold Spring Harb Perspect Med. 2014;4:a015180. [DOI] [PMC free article] [PubMed] [Google Scholar]
- 47. Yang C‐C, Cotsarelis G. Review of hair follicle dermal cells. J Dermatol Sci. 2010;57:2–11. [DOI] [PMC free article] [PubMed] [Google Scholar]
- 48. Quílez C, Valencia L, González‐Rico J, et al. In vitro induction of hair follicle signatures using human dermal papilla cells encapsulated in fibrin microgels. Cell Prolif. 2024;57:e13528. [DOI] [PMC free article] [PubMed] [Google Scholar]
Associated Data
This section collects any data citations, data availability statements, or supplementary materials included in this article.
Data Availability Statement
The data that support the findings of this study are available from the corresponding author upon reasonable request.