

Abstract
Microscopy is often the first step in microplastic analysis and is generally followed by spectroscopy to confirm material type. The value of microscopy lies in its ability to provide count, size, color, and morphological information to inform toxicity and source apportionment. To assess the accuracy and precision of microscopy, we conducted a method evaluation study. Twenty-two laboratories from six countries were provided three blind spiked clean water samples and asked to follow a standard operating procedure. The samples contained a known number of microplastics with different morphologies (fiber, fragment, sphere), colors (clear, white, green, blue, red, and orange), polymer types (PE, PS, PVC, and PET), and sizes (ranging from roughly 3–2000 μm), and natural materials (natural hair, fibers, and shells; 100–7000 μm) that could be mistaken for microplastics (i.e., false positives). Particle recovery was poor for the smallest size fraction (3–20 μm). Average recovery (±StDev) for all reported particles >50 μm was 94.5 ± 56.3%. After quality checks, recovery for >50 μm spiked particles was 51.3 ± 21.7%. Recovery varied based on morphology and color, with poorest recovery for fibers and the largest deviations for clear and white particles. Experience mattered; less experienced laboratories tended to report higher concentration and had a higher variance among replicates. Participants identified opportunity for increased accuracy and precision through training, improved color and morphology keys, and method alterations relevant to size fractionation. The resulting data informs future work, constraining and highlighting the value of microscopy for microplastics.
Keywords: Standardized methods, Experience, Recovery, Accuracy, Morphology, Size, Color
Graphical Abstract.

1. Introduction
The quantification and characterization of microplastics (plastic particles <5 mm in size) in environmental samples has become a global priority, substantiated by increasing evidence of the presence and potential risks of microplastics in diverse habitats and ecosystems (Koelmans et al., 2019; Rochman, 2020). Microscopy is commonly used to quantify and characterize microplastics and is used as either a stand-alone tool or as a first step for analysis (Lusher et al., 2020). Microscopy can be used to assess particle size, color, and morphology. These characteristics are important for source-apportionment (Helm, 2017) and risk assessment (Bucci and Rochman, 2022). Historically, using microscopy to identify particles as plastics was common for larger microplastics (≥500 μm) (e.g., Lusher et al., 2017; Shim et al., 2017). As researchers have begun to quantify and characterize smaller-sized particles, limitations that affect the accuracy of particle identification via microscopy have been noted and extra steps using chemical characterization have been added to protocols.
Smaller particles are more difficult to visualize and manipulate for characterization. Research suggests that the lower size-limit for microscopy as a stand-alone tool ranges from 200 μm to 1 mm (Isobe et al., 2019; Lusher et al., 2020). As particles become smaller, it can be increasingly difficult to assess color and morphology. It is also more difficult to determine whether a particle is anthropogenic because it is difficult to distinguish the signs that a particle is manufactured (e.g., pellets, spheres, or bright colors). Particles that are black, brown, white, or clear are more susceptible to misidentification than particles that are vibrantly colored (Lusher et al., 2020). The misidentification of smaller particles is enhanced by variability in microscope magnification power, stage background, and lighting conditions (Primpke et al., 2020). Combined, these factors increase the subjectivity of observers, increasing human error and influencing accuracy (Lusher et al., 2020). As a result, additional steps are now recommended in protocols to chemically identify microparticles by material type. Techniques include Fourier transform infrared (FTIR) spectroscopy, Raman spectroscopy, and pyrolysis gas-chromatography with mass spectrometry (Py-GCMS) (Cowger et al., 2020; Primpke et al., 2020). In fact, some studies skip microscopy entirely and fully automate spectroscopy via scanning and mapping (Primpke et al., 2020).
Global working groups have formed to adopt monitoring practices and standardized methods, including the UN (represented by GESAMP (Joint Group of Experts on the Scientific Aspects of Marine Environmental Protection)), Arctic Monitoring Assessment Program (AMAP), Ministry of Environment Japan (G7), and the State of California. Determining the role for microscopy in such method standardization depends on understanding method accuracy and precision. To help the State of California with developing standard methods for quantifying and characterizing microplastics in drinking water, we conducted a method evaluation study in which laboratories were provided blind samples with known amounts of microplastic. In the full study, laboratories were asked to perform an extraction, quantification and characterization via microscopy, and chemical analysis via spectroscopy. An overview of the full study can be found in De Frond et al. (2022). Here, we focus on the microscopy results to address the following questions: 1) What is the accuracy and precision of microscopy, and how does this vary by size, morphology, and color of microplastics?, 2) How important is experience and training to assure more accurate microscopy analysis?, and 3) How can we improve protocols (e.g., extraction protocols, color and morphology keys, equipment) to increase accuracy and precision? Combined, our findings are used to make relevant recommendations and inform future methods that enhance the value of microscopy as a tool for microplastic analysis.
2. Methods
2.1. Approach
We conducted a multi-laboratory study in which 22 labs from six countries were provided blinded triplicate microplastic-spiked clean water samples and one blank sample. Approximately 600 microplastic particles, consisting of four polymers, three morphologies, and six colors, were added to ‘microplastic grade water’ (1 μm PCTE filtered deionized water; see De Frond et al., 2022 for more detail). Microplastic particles ranged in size from 3 to 2000 μm. In addition to microplastics, particles (100–7000 μm in size) that may be mistaken as microplastics were added to test for type 1 error, or false positives (Table S1). Because variation in extraction procedures across labs would confound comparisons among laboratories, a specific standard operating procedure (SOP) was provided to all participants (De Frond et al., 2022). Briefly, the SOP provided steps for sample processing relevant to extraction, quantification, and characterization via microscopy, and chemical analysis via spectroscopy. The extraction procedure included a size fractionation step into four size fractions: 1–20 μm, 20–212 μm, 212–500 μm, and >500 μm. Laboratories were asked to only quantify and characterize particles that they suspected were microplastics. Laboratories were asked to report data and metadata using a standard Excel template. For more detail on the multi-laboratory study methods and overarching results, see De Frond et al. (2022).
2.2. Data extraction, quality assessment, and availability
Data were collected and anonymized using a standard Excel data template and stored in a PostgreSQL database (all raw data is available at microplastics.sccwrp.org). The reported data were first quality screened to ensure all data used were correctly recorded and relevant to the objectives in this study. Labs A, U, and WW were excluded for counting all particles, including those suspected to be natural. In addition, Labs D and F were excluded due to too much deviation from the SOP. The resulting dataset was used to determine total microplastic recovery, recoveries by microplastic characteristics (size, morphology, and color), and recoveries according to laboratory practices (e.g., training, microscope magnification). We also created a dataset to check recovery and accuracy of spiked particles only, as well as how many spiked false positives were reported. We called this the quality assurance (QA) dataset. To build this dataset, researchers at the Southern California Coastal Water Research Project (SCCWRP) compared submitted images to reported particle characteristics for each particle to assess whether the particle was in fact spiked or if the particle was procedural contamination that happened to match characteristics of a spiked particle (See Supplementary Material for more information about the QA dataset). Lastly, to answer more specific questions relevant to our objectives, we conducted a survey that included questions about experience, training, duration of sample storage, processing time, and microscope settings that were not included in the original dataset (See Supplementary Data for survey results).
2.3. Synthesis of data
All data synthesis and analyses were conducted using Excel 2016 or R software (Version 4.0.3). Scripts used to generate statistical analyses, summary results and figures are available at: https://github.com/SCCWRP/Microplastics_Intercalibration_Study, and compatible datasets are available at https://microplastics.sccwrp.org/. Total particle recovery was calculated as the total number of suspected microplastic particles counted (without blank correction) divided by the total number of spiked microplastic particles. This was done across all labs, within labs, and among particle characteristics. To quantitatively assess how particle characteristics (color, morphology, and size) and experience affected spiked particle recovery, we ran a generalized linear mixed model (GLMM) using the QA dataset. In summary, a series of negative binomial GLMMs were built with research lab ID as a random effect and all other variables as fixed effects. The best fitting and competing models (within 2 AICc of best model) were chosen for final model selection. Multiple comparisons were conducted for significant variables for the best fitting model (fibers excluded) and the morphology univariate model (fibers included) with Tukey Contrasts (see Supplementary Materials for more details on these analyses).
We also used these datasets to consider how an SOP may be improved. To assess how size fractioning samples during extraction affected our results, we compared recoveries among size-fractions when particles were binned according to the sieve size they were captured in versus manual measurements. Individual t-tests assuming unequal variances determined whether there were statistical differences (p < 0.05) between sieved and measured recoveries for each spiked particle’s characteristics. Moreover, misidentifications of color and morphology were binned by matches or mismatches to assess any patterns in mischaracterization across particle characteristics.
Next, we assessed the color and morphological keys and asked whether any characteristics in the key should be collapsed into one characteristic. To summarize, the data used for the color/morphology collapse analysis was sourced from the raw data and corrected for unknown particles and lack of lab replicates for comparability. The mean microplastics counted per participating laboratory were calculated for color and morphology categories. To determine if collapsing color and morphology categories increased accuracy, two-tailed one-sample t-tests or Wilcoxon signed-rank tests were conducted for normal or non-normal data, respectively. These data were then visualized with nonmetric multidimensional scaling (NMDS) to determine if the microplastic ‘community’ structure for the original or collapsed datasets were more aligned with the spiked ‘community’. NMDS was conducted using each lab’s sample-by-microplastic morphology/color combination mean abundance matrix (max try of 100 iterations, Bray-Curtis similarity distance). The effect of collapsing microplastic morphology/color combinations were analyzed using ADONIS (see Supplementary Materials for specific analysis details).
3. Results
3.1. Total recovery
Total recovery of microplastics using microscopy ranged from 5.6 to 115.5% across labs, with an average of 45.7% when including all size fractions (Fig. 1, Table S2). When the smallest size fraction (1–20 μm) was excluded, the mean total suspected microplastic recovery increased to an average of 94.5% (Fig. 1). When only including the recovery of spiked particles, determined by the QA dataset, the total mean recovery of microplastic particles decreased to 21.9% compared to the raw dataset; however, when excluding the 1–20 μm size fraction in the QA dataset, the mean recovery of spiked particles doubled to 51.3% (Fig. 1, Table S2). Due to the poor recovery of particles in the 1–20 μm size fraction, all subsequent analyses were performed without the 1–20 μm size fraction unless specifically stated otherwise. As such, for most analyses, particles were >50 μm in size (Table S1).
Fig. 1.
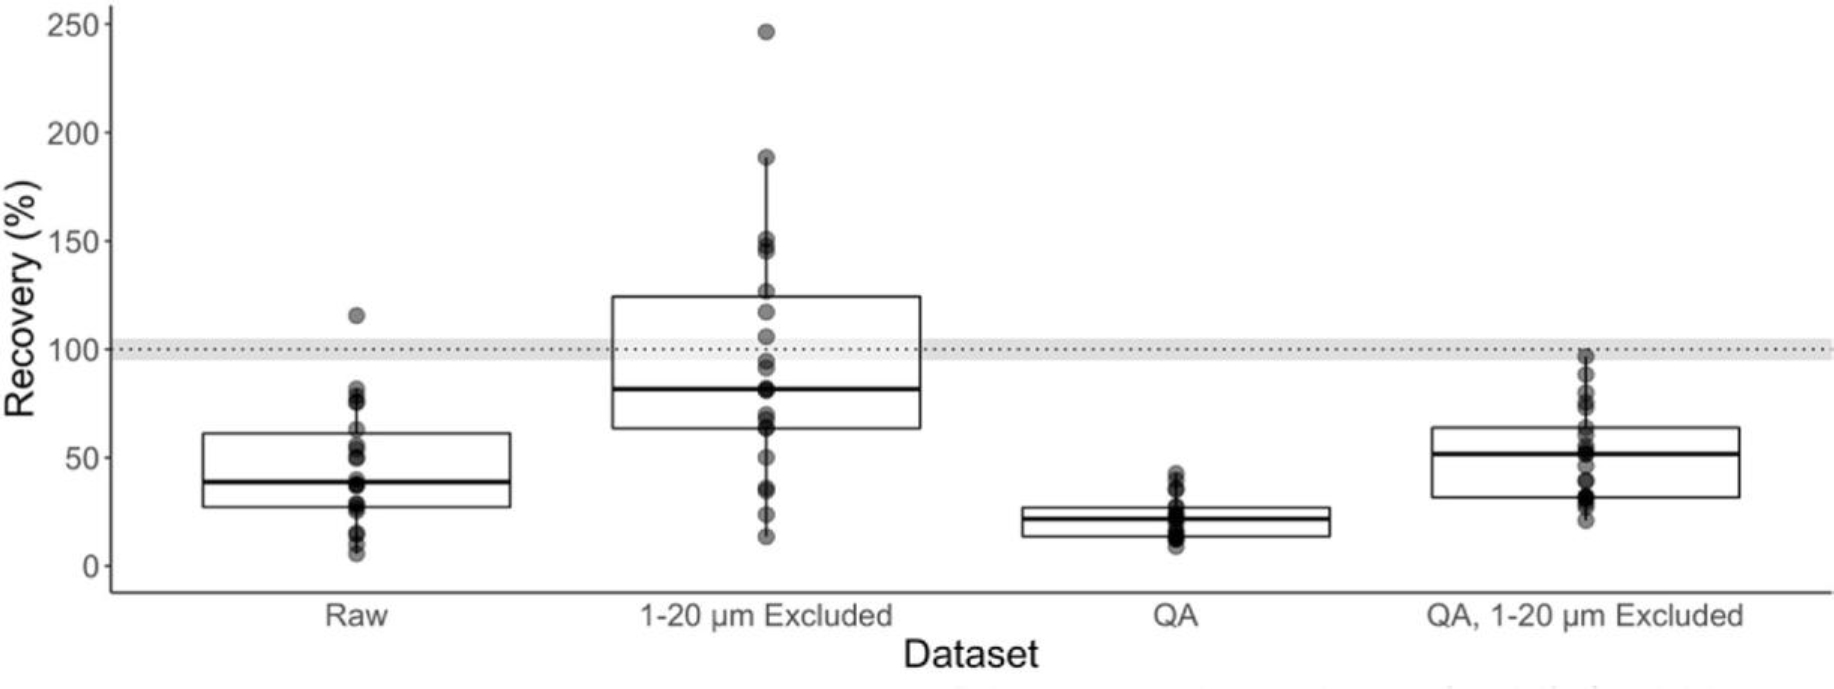
Recoveries of suspected microplastic particles across laboratories using a non-blank corrected dataset. The boxes represent total recoveries with and without the inclusion of the 1–20 μm size fraction and using only the QA corrected dataset. The dotted line is at 100% particle recovery and the grey area represents the mean relative standard deviation (RSD).
Although not a measure of recovery of specifically spiked microplastics, we also assessed how many of the spiked non-plastic microparticles (20 red cotton fibers, 40 white cellulose and fur fibers, and 20 white shell fragments per sample) were reported as suspected microplastics using the QA dataset. Out of the 80 non-plastic microparticles spiked per sample, 1–51 were reported as microplastics across labs, with a mean of 16 and median of 11 particles per sample (Figure S1). Across all labs, white fragments were reported with a mean of 11 and a median of 10 particles, white fibers were reported with a mean of 12 and a median of 9 particles, and red fibers were reported with a mean of 13 and a median of 10 particles per sample (Figure S2).
3.2. Recoveries by particle characteristics
Overall recoveries varied considerably across size fractions (Table S3), with the lowest recovery in the 1–20 μm size fraction (mean of 31.9%). Overall recoveries were higher, and similar amongst the other size fractions (Fig. 2a; Table S3). Across morphologies, the most accurate mean recovery was for spheres (95.9%) and the least accurate was for fibers (462.4%; Fig. 2b; Table S4). Recoveries also varied among colors (Table S5), with the most accurate recovery for green particles and the least accurate for clear with a mean of 110.7% and 1085.6%, respectively (Fig. 2c; Table S5). Across all labs, the mean recovery of white (33.4%) and orange (47.2%) particles were underreported while clear and blue (337.8%) particles were overreported compared to all other colors (Table S5).
Fig. 2.

Percent recovery of all suspected microplastics among labs, separated by size fraction (A), morphology (B), and color (C). The dotted line represents the average expected recovery based on the spiked particles. (For interpretation of the references to color in this figure legend, the reader is referred to the Web version of this article.)
A GLMM using the QA dataset found that the greatest determinant of deviation from total recovery was a combination of particle color, morphology, and size fraction (Tables S6 – S8), with the amount of experience working with microplastics not a significant explanatory variable. Labs’ deviations in reported spiked microplastic abundance from their respective spiked known values were significantly greater for particles that were in the 212–500 μm size fraction compared to the smallest and largest size fractions (Figure S3a). The abundance of fibers reported by labs deviated the most from known spiked values compared to spheres and fragments (Figure S4) when fibers were included in analysis; however, fragments had the largest deviation from expected values compared to spheres when fibers were excluded from the analysis (Figure S3b). Deviations in reported particle colors were significantly different across all colors with the largest deviations predicted for clear and white particles compared to blue and green particles (Figure S3c).
3.3. Assessing recovery to inform future SOPs
3.3.1. Nominal vs. measured size binning
Within the extraction procedure, participants were asked to size fraction to aid in identification under the microscope and to potentially reduce the number of particles physically measured to determine the size range of particles in a sample. To assess how useful this step was, we compared median recoveries by size fraction when grouped by sieving (as in Fig. 2a) versus by manual measurements (which were obtained from particle measurements in the QA dataset). Particles had the greatest mismatch within the smaller size fractions (Fig. 3). Recoveries were overestimated within the 1–20 μm (from a median of 112 in the reported dataset to 21 particles in the QA dataset) and 20–212 μm (from a median of 81 in the reported dataset to 53 particles in the QA dataset) size fractions and underestimated within the >500 μm size fraction (from a median of 37 in the reported dataset to 79 particles in the QA dataset). For the 212–500 μm size fraction, the median recoveries were similar (median of 68 in the reported dataset to 66 particles in the QA dataset). This trend was consistent across labs and appears to be driven by fibers. T-tests assuming unequal variances determined that there were no statistical differences (p > 0.05) between sieved and manually measured recoveries for any spiked particles except for orange fibers (p< 0.005). This suggests that sieving accurately captures particles within the right size range except for particles that are long and narrow and can pass through the sieve in their smallest dimension.
Fig. 3.
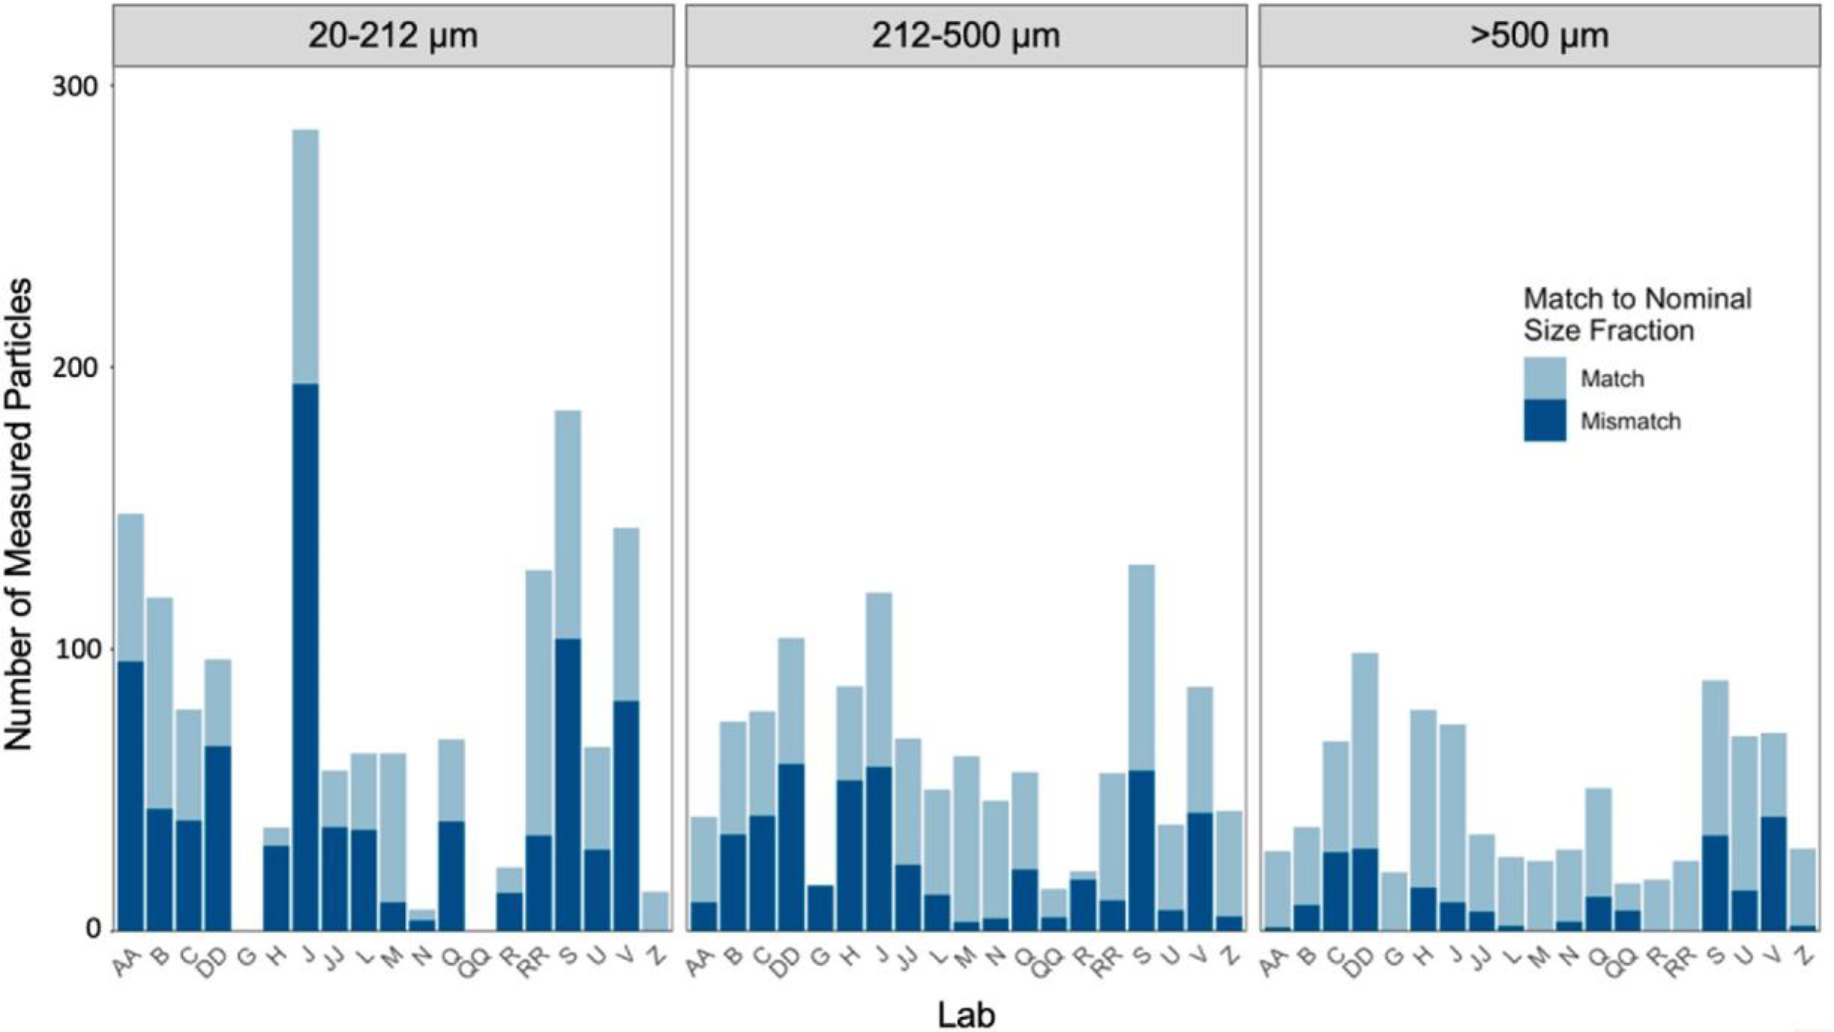
The number of measured particles submitted by participating laboratories that matched or mismatched the sieved (nominal) size fractions based on their manual measurements.
3.3.2. Color and morphology subjectivity
The color and morphology of a particle reported may be subjective, particularly when characterizing particles via microscopy. To assess this, we used the QA dataset to measure the accuracy of characterization for each spiked color and morphology (Fig. 4). For example, if a study participant reported a particle as “gold,” but the quality screening team identified this particle as “orange,” this would be considered a “mismatch.” Similarly, if a study participant reported a particle as a “pellet,” but the quality screening team identified this particle as a “sphere,” this was considered a “mismatch”. Blue and green particles were most often identified correctly, while orange and white particles were most frequently misidentified (Fig. 4a). Of the orange fibers that were misidentified, 79.4% of the misidentifications were called gold, followed by red (12.4%) (Fig. 4a). White was mainly mischaracterized as clear (71.1%) followed by grey (20.5%). When identifying particle morphology, study participants rarely mischaracterized fibers (0.6%) but were more likely to mischaracterize fragments and spheres (Fig. 4b). Misidentified fragments were most often reported as pellet (51.9%) or foam (39.0%). Misidentified spheres were most often reported as pellets (64.7%) or fragments (33.3%) (Fig. 4b).
Fig. 4.

Quantity and characterization of misidentified particles by color (A) and morphology (B). Misidentified particles are depicted in orange, labeled as a “mismatch”. The tables below each graph show the colors and morphologies reported for each misidentified particle as well as the total misidentified particles for each category. (For interpretation of the references to color in this figure legend, the reader is referred to the Web version of this article.)
The color and morphology misidentifications led us to ask whether collapsing color and morphology categories could increase particle recovery due to the inherent subjectivity. To test this, we collapsed the morphologies “pellet”, “foam”, “film” and “fragment” as “fragment”; “fiber bundle” and “fiber” as “fiber”; and “sphere” as “sphere”. Colors were collapsed based on similar colors: Black-Brown, Blue-Purple, Clear-Grey-White-Silver, Gold-Orange-Yellow, Red-Pink, Green, and Multicolor. Collapsed morphology and color categories improved or main-tained accuracy for some categories from the ≥20 μm and <20 μm datasets (Tables S9 and S10). The collapsed median values were closer to the spiked or non-spiked (0) values compared to initial median values for white, orange, and red colors (Tables S9 and S10). Microplastics that were classified as green, multicolor, or spheres were not collapsed and were consistent in values across the analyses. Most morphology and color categories did vary substantially from spiked microplastic values, with a few exceptions (Tables S9 and S10).
The initial and collapsed microplastic ‘communities’ were significantly different for particles ≥20 μm (F2,42 = 3.3658, P < 0.0001). The microplastic ‘communities’ became more similar across labs after collapsing morphologies and colors (Fig. 5), with the initial ‘community’ occupying an area of 5.7 in ordination space while the collapsed ‘community’ occupied an area of 3.8. In addition, the ‘communities’ became more similar to the known spiked ‘community’ after collapsing as evidenced by the ‘communities’ shifting closer to the spiked ‘community’ (Fig. 5).
Fig. 5.
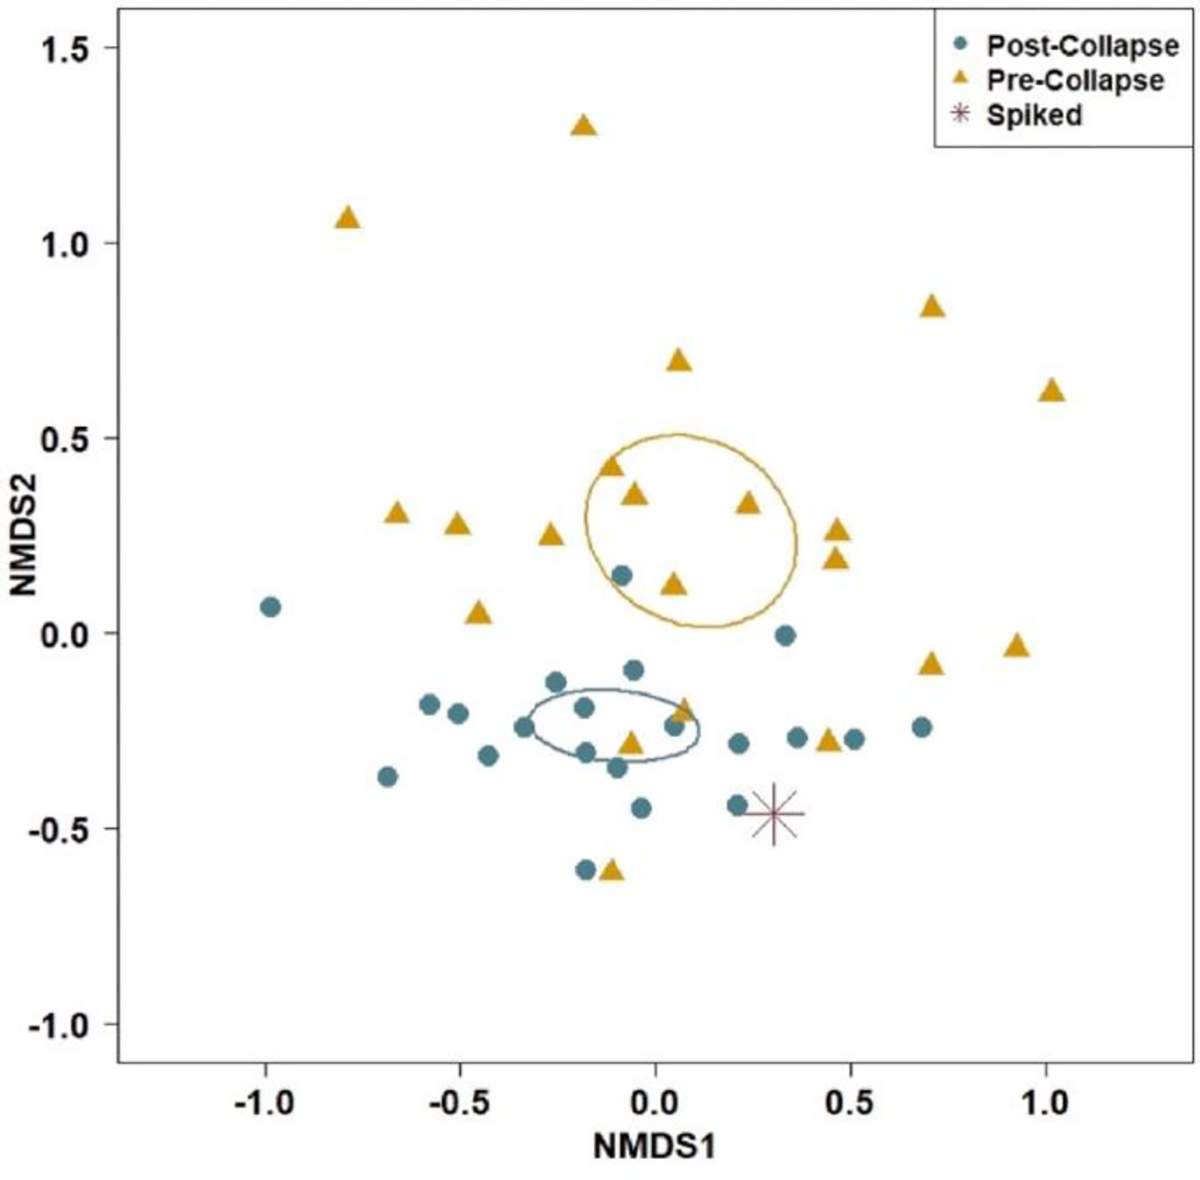
Microplastic ‘community’ relationship between initial and collapsed morphology and color combinations compared to the spiked ‘community’ for particles ≥20 μm. Panels represent 2-D nonmetric multidimensional scaling (NMDS) results with standard error 95% confidence ellipses for initial and collapsed ‘communities’. (For interpretation of the references to color in this figure legend, the reader is referred to the Web version of this article.)
3.3.3. Experience
In addition to assessing particle characteristics, we looked at patterns related to self-reported experience. Experience was ranked as a level of expertise defined by the amount of time a lab had previous experience (before this study) quantifying and characterizing microplastics. A lab’s experience level was scored as a 0 if they were a novice (i.e., new to microplastics analysis, some labs having participated in a three-day training course on these methods immediately prior to the study), as if they were intermediate (<1 year of experience), or as 2 if they were expert (>1 year). Mean recoveries were 54.2% for level 0, 36.7% for level 1, and 33.9% for experience level 2 (Table S11). Overall, recoveries were statistically similar across levels of experience (Figure S5), and experience was not a significant explanatory variable for recovery, as demonstrated by the GLMM (Table S7). Still, we did see a pattern whereby standard error, as a measure of precision, decreased with experience from an average of 10.6% in level 0–3.8% in level 1–3.1% in level 2 (Table S11).
3.3.4. Microscope settings
We examined the effects of microscopy parameters on recovery by assessing whether labs’ variation in background color, illumination, and magnification settings used in microscopy influenced total recovery. We found no clear relationship between background color or illumination setting and spiked particle recovery (Figure S6 & S7). From the survey, reported background settings included white, black, or other (Table S12). Reported illumination settings included brightfield, black, or oblique (Table S13). There is a slight trend that suggests labs that switched between two background fields had better recovery, but there is not enough data to conclude that three is better or worse than one or two fields due to the lack of labs that used three backgrounds (n = 1 lab). The same can be said for illumination settings. Similarly, there is not a clear relationship between magnification setting and particle recovery.
4. Discussion and conclusion
The purpose of this study was to determine the value of microscopy for microplastic quantification and characterization in drinking water samples. Although we assessed drinking water, our findings are likely relevant across matrices (e.g., environmental samples). Below, we discuss how our findings elucidate the value of microscopy as a tool for microplastics research and recommend improvements.
4.1. The value of microscopy
Microscopy provides the most value for the characterization of microplastics in larger size fractions (i.e., greater than 50 μm in our study). As expected, the three largest size fractions examined in this study (20–212, 212–500, and >500 μm) were characterized with the greatest accuracy, as has been reported elsewhere (Isobe et al., 2019). As such, microscopy is less reliable for smaller particle sizes. The poor recovery of <20 μm particles in this study highlights the greatest limitation of microscopy, as researchers now note that the abundance of particles in environmental samples increases dramatically with decreasing particle size (Enders et al., 2015; Covernton et al., 2019). In our study, the relative abundance of particles was intended to represent this phenomenon with more particles spiked within the smaller size classes (<20 μm: 360; 20–212 μm: 143) compared to that of the larger classes (212–500 μm: 70; >500 μm: 46) (Table S1). However, it should be noted that recoveries are dependent not only upon the spiked particle counts, but also on the relative abundance of spiked material characteristics (i.e., size, color, and morphology) that may also influence recovery across size classes. For example, in this study, there were only a few large particles within the spiked microplastic samples compared to all the other size classes, which could magnify any errors in the extraction process or discrepancies in identification for this largest size class. Moreover, our particles are less diverse than environmental microplastics. Although we did include clear fragments of various sizes and polymer types, we also included bright green spheres and blue fragments that were likely simpler to recover than environmental microplastics. Future studies should include a more even distribution in particle size classes, and more diverse particles that better match environmental samples to help fully ascertain the challenges with particle identification.
Despite the limitations in characterizing microplastics at sizes <20 μm, this study demonstrates that microscopy alone can result in relatively good quantification and characterization of larger-sized microplastics similar to previous studies (Isobe et al., 2019; Müller et al., 2020). This validates the value of microscopy for microplastics research, especially for larger-sized particles. For example, if environmental managers or researchers want to know the amount, size, and morphology of larger-sized microplastics in a sample, this can be done using microscopy as the equipment is relatively inexpensive and the method is reliable and widely accessible. Following up with additional methods to identify polymer type can be important to confirm particles are indeed plastic (Minor et al., 2020), this early information can provide estimates of microplastic particle concentration, size, color, and morphology to inform risk to wildlife (Bucci and Rochman, 2022) and to inform source-apportionment (Zhu et al., 2021). For example, size is a relevant parameter when determining risks to organismal health (Bucci and Rochman, 2022), and morphology may be an important consideration, for example, non-fiber microplastics may have less toxicological effects than microplastic fibers (Bucci et al., 2020). Visual assessment of particles via microscopy may also inform potential source materials or pathways, for example, black, rubbery fragments are likely related to tire wear (e.g., Werbowski et al., 2021), microplastic fibers are likely shed from textiles which may be released to the environment via wastewater effluent (e.g., Erdle et al., 2021), and pellets may be associated with plastic production facilities upstream of study sites (e.g., Tsui et al., 2020).
4.2. Improvements that may increase the value of microscopy
To determine how microscopy SOPs could be improved to increase accuracy and/or efficiency, we took a closer look at size fractionation, color/morphology keys, microscope parameters, and experience/ training. Below, we discuss how what we learned may inform future SOPs.
First, we recommend size fractioning samples during extraction. This can make microscopy quicker because it reduces the need to adjust magnification during sample sorting. Moreover, it can save time when characterizing particles according to size. In our study, we found that for most spiked particles, the reported size fraction matched the measured size, suggesting an extra manual measurement may not be necessary. However, this was not the case for microfibers, suggesting that while measuring microfibers manually is necessary, manually measuring only one morphology will save time and resources.
Second, we assessed the accuracy of reporting for color and morphology to determine whether new color and/or morphology keys would improve accuracy. We asked whether collapsing certain colors and morphologies in keys (Table S14 and S15) may result in more accurate recovery. The collapsing we tested in this study improved overall accuracy, bringing the final sample closer to the known spiked value. This suggests that simplified keys may be useful overall. However, we recommend that researchers think carefully about their objectives before choosing more simplified keys. This is because further detail may be critical for an objective, such as source apportionment to inform management. As such, standardized training to match lab-specific keys may be more important.
Third, we asked how important experience was for accuracy and precision. Overall, we found that experience was less relevant to recovery, and more relevant to precision (Figure S5). What may be most important is standardized training within a laboratory. Here, we found that training at SCCWRP prior to the method evaluation study improved recovery. Labs that went through training had a higher mean recovery than those that did not (Figure S8), but these results were not statistically significant (2-sample t-test, t-statistic = −1.487, df = 15, P > 0.05). Moreover, labs that followed our protocols had higher recovery than those that deviated (Figure S9). It was also determined that labs with less experience with microplastics had more blank contamination compared to more experienced labs (Lao et al. in prep for this issue). Thus, standardized training in extraction and microscopy for microplastic identification is recommended. In addition, it is recommended that multiple training sessions be conducted, and that training include a diversity of particle morphologies and colors, as well as include common organic materials and false positives. This should increase both accuracy and precision of microplastic particle recovery and characterization.
Finally, we assessed microscopy parameters. Overall, we observed no clear trend suggesting how background color, lighting, and magnification settings affect microplastic particle recovery. This suggests that laboratories can save money on microscopes, because more expensive microscopes that include more options for these parameters may not increase an individual’s ability to identify microplastics. Standardized microscopy settings in the microplastic field may help improve consistency within and between labs across studies, as suggested by Hidalgo-Ruz et al. (2012) and Lusher et al. (2020). It is recommended that labs maintain a minimum magnification and light settings, and a consistently clean microscope and surrounding laboratory space. Similar to Cowger et al. (2020), we recommend that it become standard practice to report the microscopy settings used in each study for future comparability and standardization in the microplastic field.
4.3. Moving forward
Overall, visual microscopy remains an effective and accessible tool for microplastic quantification and characterization of particles >50 μm (the smallest size particle in the >20 μm fraction). Still, the use of further analyses to confirm material type are recommended where possible to improve confidence in quantification. For improvements, a variety of supplemental techniques can be addressed in future method evaluation studies, including tactile examination (Lusher et al., 2020), melt tests (Enders et al., 2015), staining with dyes (Maes et al., 2017; Karakolis et al., 2019) or fluorescence (Qiu et al., 2015), and polarized-light microscopy (Sierra et al., 2020). The use of fluorescent and polarized-light microscopy may also improve recovery for particles <20 μm, which are an important size fraction for exposure and health risk assessment. Although we demonstrated that there is subjectivity, we show that subjectivity can be countered with the standardization of SOPs, training, and morphology/color keys. In addition, we expect that standardizing microscope settings may also lead to decreased variability in recovery. While there have been advancements with the development of new technologies that can increase throughput and accuracy of microplastic quantification, and characterize particles by size, color, morphology, and material type, these tools can be expensive and less accessible. As such, even with the need for new technologies and methods, microscopy remains a valuable and accessible tool for microplastic research.
Supplementary Material
HIGHLIGHTS.
Microscopy provides count, size, color, and morphological information.
Particle recovery decreases with particle size.
Recovery varies based on morphology, with poorest recovery for fibers.
Color affects recovery, with the largest deviations for clear and white particles.
Accuracy and precision improve with experience and training.
Acknowledgements
We thank all participants of the method evaluation study including: Alfred-Wegener-Institute; Algalita Marine Research and Education; Barnett Technical Services; BASF; California State University (Bakersfield); California State University (Channel Islands); East China Normal University; Eastman Chemical Company; U.S. Environmental Protection Agency; Eurofins (Australia, Norway, US); HORIBA Scientific; Innovations institut für Nanotechnologie und korrelative Mikroskopie; Institute of Hydrobiology (Chinese Academy of Sciences); Jinan University; NatureWorks LLC; Metropolitan Water District; Norwegian Institute for Water Research; Ontario Ministry of the Environment, Conservation and Parks; Orange County Sanitation District; Oregon State University; Pennsylvania State University; RJ Lee Group; Southern California Coastal Water Research Project Authority; Thermo Fisher (US); University of California (Riverside); University of Minnesota (Duluth); University of Quebec at Rimouski; University of Toronto. We thank R. Butler and Z. Quraishi at SCCWRP for helping with the database. We thank Amy Fetters (California State University Bakersfield), Hinako Nogi (University of California Riverside), Nina T. Buenaventura and Cecille Singdahl-Larsen (Norwegian Institute for Water Research), Jerome Jourdan (BASF), and Devin Edge (University of Minnesota Duluth) for contribution to assisting with sample processing. Funding was provided by the California State Water Resources Control Board and SCCWRP. UC (Riverside) participation was supported in part by USDA NIFA Hatch Program (project number CA-R-ENS-5120-H) and USDA Multistate Project 4170 (project number CA-R-ENS-5189-RR). Sample processing in the Minor Lab was funded by a cooperative agreement between the National Park Service and the University of Minnesota with support from the Great Lakes Restoration Initiative and the National Park Service Water Resources Division.
Footnotes
Declaration of competing interest
The authors declare that they have no known competing financial interests or personal relationships that could have appeared to influence the work reported in this paper.
Appendix A. Supplementary data
Supplementary data to this article can be found online.
Data availability
The data is all completely open access via a link in the paper and some shared as supp mat.
References
- Bucci K, Tulio M, Rochman CM, 2020. What is known and unknown about the effects of plastic pollution: a meta-analysis and systematic review. Ecol. Appl. 30 (2) 10.1002/eap.2044. [DOI] [PubMed] [Google Scholar]
- Bucci K, Rochman CM, 2022. Microplastics: a multidimensional contaminant requires a multidimensional framework for assessing risk. Microplastics and Nanoplastics 2 (1), 1–9.35005629 [Google Scholar]
- Covernton GA, Pearce CM, Gurney-Smith HJ, Chastain SG, Ross PS, Dower JF, Dudas SE, 2019. Size and shape matter: a preliminary analysis of microplastic sampling technique in seawater studies with implications for ecological risk assessment. Sci. Total Environ. 667, 124–132. [DOI] [PubMed] [Google Scholar]
- Cowger W, Booth AM, Hamilton BM, Thaysen C, Primpke S, Munno K, Lusher AL, Dehaut A, Vaz VP, Liboiron M, Devriese LI, Hermabessiere L, Rochman C, Athey SN, Lynch JM, de Frond H, Gray A, Jones OAH, Brander S, Nel H, 2020. Reporting guidelines to increase the reproducibility and comparability of research on microplastics. Appl. Spectrosc. 74 (9) 10.1177/0003702820930292. [DOI] [PMC free article] [PubMed] [Google Scholar]
- De Frond H, Hampton LT, Kotar S, Gesulga K, Matuch C, Lao W, et al. , 2022. Monitoring microplastics in drinking water: an interlaboratory study to inform effective methods for quantifying and characterizing microplastics. Chemosphere, 134282. [DOI] [PubMed] [Google Scholar]
- Enders K, Lenz R, Stedmon CA, Nielsen TG, 2015. Abundance, size and polymer composition of marine microplastics ≥10 μm in the Atlantic Ocean and their modelled vertical distribution. Mar. Pollut. Bull. 100 (1) 10.1016/j.marpolbul.2015.09.027. [DOI] [PubMed] [Google Scholar]
- Erdle LM, Nouri Parto D, Sweetnam D, Rochman CM, 2021. Washing machine filters reduce microfiber emissions: evidence from a community-scale pilot in parry sound, Ontario. Front. Mar. Sci. 8 10.3389/fmars.2021.777865. [DOI] [Google Scholar]
- Helm PA, 2017. Improving microplastics source apportionment: a role for microplastic morphology and taxonomy? Anal. Methods 9 (9), 1328–1331. [Google Scholar]
- Hidalgo-Ruz V, Gutow L, Thompson RC, Thiel M, 2012. Microplastics in the marine environment: a review of the methods used for identification and quantification. Environ. Sci. Technol. 46 (6) 10.1021/es2031505. [DOI] [PubMed] [Google Scholar]
- Isobe A, Buenaventura NT, Chastain S, Chavanich S, Cózar A, DeLorenzo M, Hagmann P, Hinata H, Kozlovskii N, Lusher AL, Martí E, Michida Y, Mu J,Ohno M, Potter G, Ross PS, Sagawa N, Shim WJ, Song YK, et al. , 2019. An interlaboratory comparison exercise for the determination of microplastics in standard sample bottles. Mar. Pollut. Bull. 146 10.1016/j.marpolbul.2019.07.033. [DOI] [PubMed] [Google Scholar]
- Karakolis EG, Nguyen B, You JB, Rochman CM, Sinton D, 2019. Fluorescent dyes for visualizing microplastic particles and fibers in laboratory-based studies. Environ. Sci. Technol. Lett. 6 (6), 334–340. [Google Scholar]
- Koelmans AA, Mohamed Nor NH, Hermsen E, Kooi M, Mintenig SM, de France J, 2019. Microplastics in freshwaters and drinking water: critical review and assessment of data quality. In: Water Research, vol. 155. 10.1016/j.watres.2019.02.054. [DOI] [PMC free article] [PubMed] [Google Scholar]
- Lusher AL, Welden NA, Sobral P, Cole M, 2017. Sampling, isolating and identifying microplastics ingested by fish and invertebrates. In: Analytical Methods, vol. 9. 10.1039/c6ay02415g. Issue 9. [DOI] [Google Scholar]
- Lusher AL, Bråte ILN, Munno K, Hurley RR, Welden NA, 2020. Is it or isn’t it: the importance of visual classification in microplastic characterization. Appl.Spectrosc 74 (9) 10.1177/0003702820930733. [DOI] [PubMed] [Google Scholar]
- Maes T, Jessop R, Wellner N, Haupt K, Mayes AG, 2017. A rapid-screening approach to detect and quantify microplastics based on fluorescent tagging with Nile Red. Sci. Rep. 7 10.1038/srep44501. [DOI] [PMC free article] [PubMed] [Google Scholar]
- Minor EC, Lin R, Burrows A, Cooney EM, Grosshuesch S, Lafrancois B, 2020. An analysis of microlitter and microplastics from Lake Superior beach sand and surface-water. Sci. Total Environ. 744, 140824. [DOI] [PubMed] [Google Scholar]
- Müller YK, Wernicke T, Pittroff M, Witzig CS, Storck FR, Klinger J,Zumbülte N, 2020. Microplastic analysis-are we measuring the same? Results on the first global comparative study for microplastic analysis in a water sample. Anal. Bioanal. Chem. 412 (3), 555–560. [DOI] [PubMed] [Google Scholar]
- Primpke S, Cross RK, Mintenig SM, Simon M, Vianello A, Gerdts G, Vollertsen J, 2020. Toward the systematic identification of microplastics in the environment: evaluation of a new independent software tool (siMPle) for spectroscopic analysis. Appl. Spectrosc. 74 (9) 10.1177/0003702820917760. [DOI] [PMC free article] [PubMed] [Google Scholar]
- Qiu Q, Peng J, Yu X, Chen F, Wang J, Dong F, 2015. Occurrence of microplastics in the coastal marine environment: first observation on sediment of China. Mar.Pollut. Bull. 98 (1–2) 10.1016/j.marpolbul.2015.07.028. [DOI] [PubMed] [Google Scholar]
- Rochman CM, 2020. The story of plastic pollution from the distant ocean gyres to the global policy stage. Oceanography 33 (3). 10.5670/oceanog.2020.308. [DOI] [Google Scholar]
- Shim WJ, Hong SH, Eo SE, 2017. Identification methods in microplastic analysis: a review. In: Analytical Methods, vol. 9. 10.1039/c6ay02558g. Issue 9. [DOI] [Google Scholar]
- Sierra I, Chialanza MR, Faccio R, Carrizo D, Fornaro L, Pérez-Parada A, 2020. Identification of microplastics in wastewater samples by means of polarized light optical microscopy. Environ. Sci. Pollut. Control Ser. 27 (7) 10.1007/s11356-019-07011-y. [DOI] [PubMed] [Google Scholar]
- Tsui N, Helm P, Hruska J, Rochman CM, 2020. Kicking pellet emissions to the curb.Integrated Environ. Assess. Manag. 16 (5), 788–790. [DOI] [PubMed] [Google Scholar]
- Werbowski LM, Gilbreath AN, Munno K, Zhu X, Grbic J, Wu T, Sutton R, Sedlak MD, Deshpande AD, Rochman CM, 2021. Urban stormwater runoff: a major pathway for anthropogenic particles, black rubbery fragments, and other types of microplastics to urban receiving waters. ACS ES&T Water; 1 (6). 10.1021/acsestwater.1c00017. [DOI] [Google Scholar]
- Zhu X, Munno K, Grbic J, Werbowski LM, Bikker J, Ho A, et al. , 2021. Holistic assessment of microplastics and other anthropogenic microdebris in an urban bay sheds light on their sources and fate. ACS ES&T Water; 1 (6), 1401–1410. [Google Scholar]
Associated Data
This section collects any data citations, data availability statements, or supplementary materials included in this article.
Supplementary Materials
Data Availability Statement
The data is all completely open access via a link in the paper and some shared as supp mat.