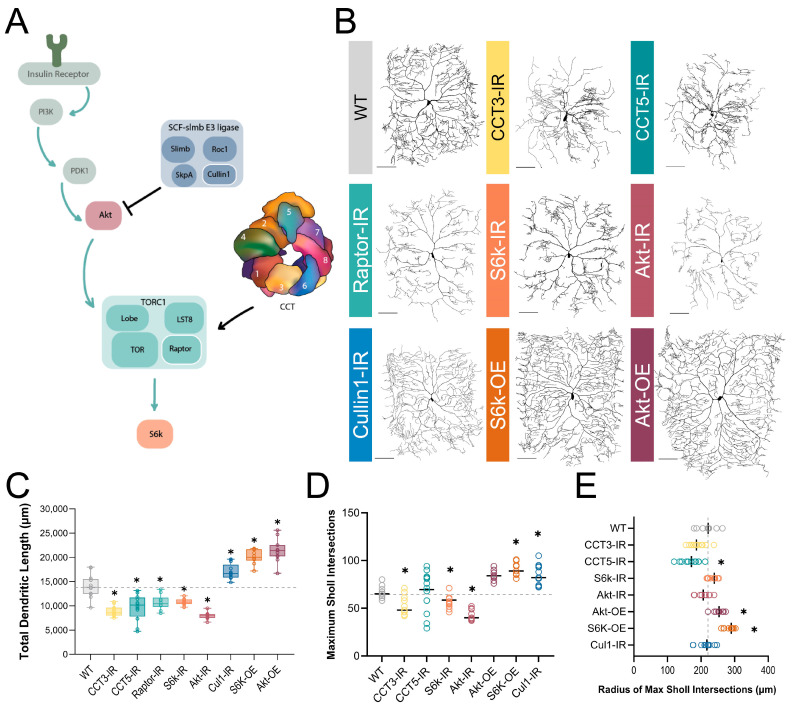
Figure 1.
CCT and the TORC1 pathway promote dendritic arborization. (A) Schematic diagram of regulatory relationships between the insulin pathway, SCF complex, CCT, and TORC1 pathway, with the insulin pathway indicated by teal arrows. TORC1 is negatively regulated by Cullin1 and positively regulated by CCT. The upstream insulin pathway in green is displayed for context, but was not examined in this study. Individual components of the SCF and TORC1 complexes examined in this study are outlined in white. (B) Representative images of CIV neurons for key CCT and TORC1 pathway manipulations, with RNAi-mediated knockdown indicated with -IR and UAS-mediated overexpression with -OE. Scale bars = 100 µm (C) Total dendritic length of CCT and TORC1 pathway manipulations shown in comparison to a WT control. (D) Number of Sholl maximum intersections. (E) Radius (in µm) of Sholl maximum intersection for each genotype. Radii that have shifted a significant difference from control are indicated with an asterisk. In all panels * = p < 0.05, see Supplementary Table S2 for detailed statistics.

