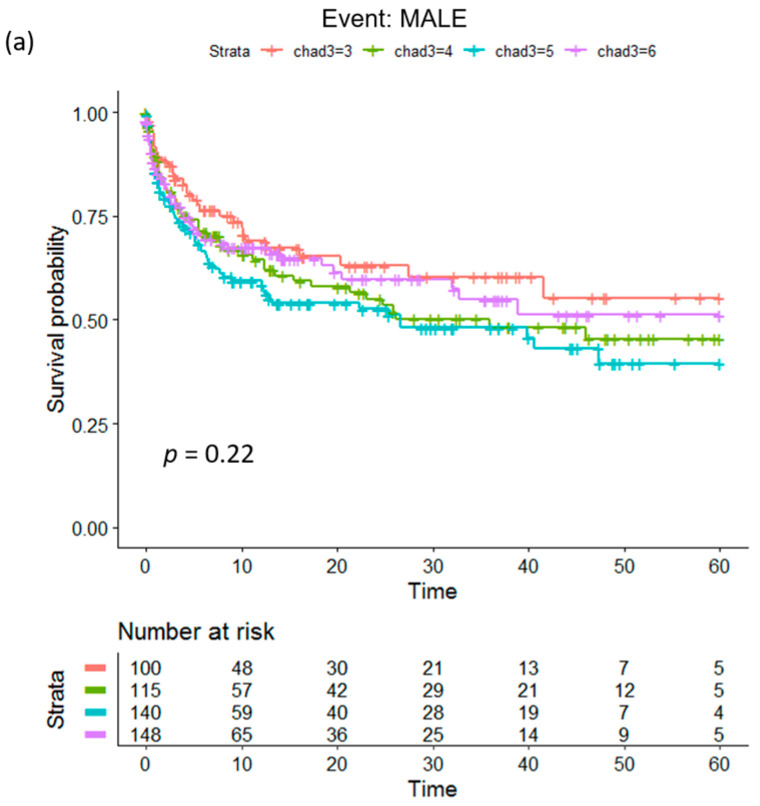
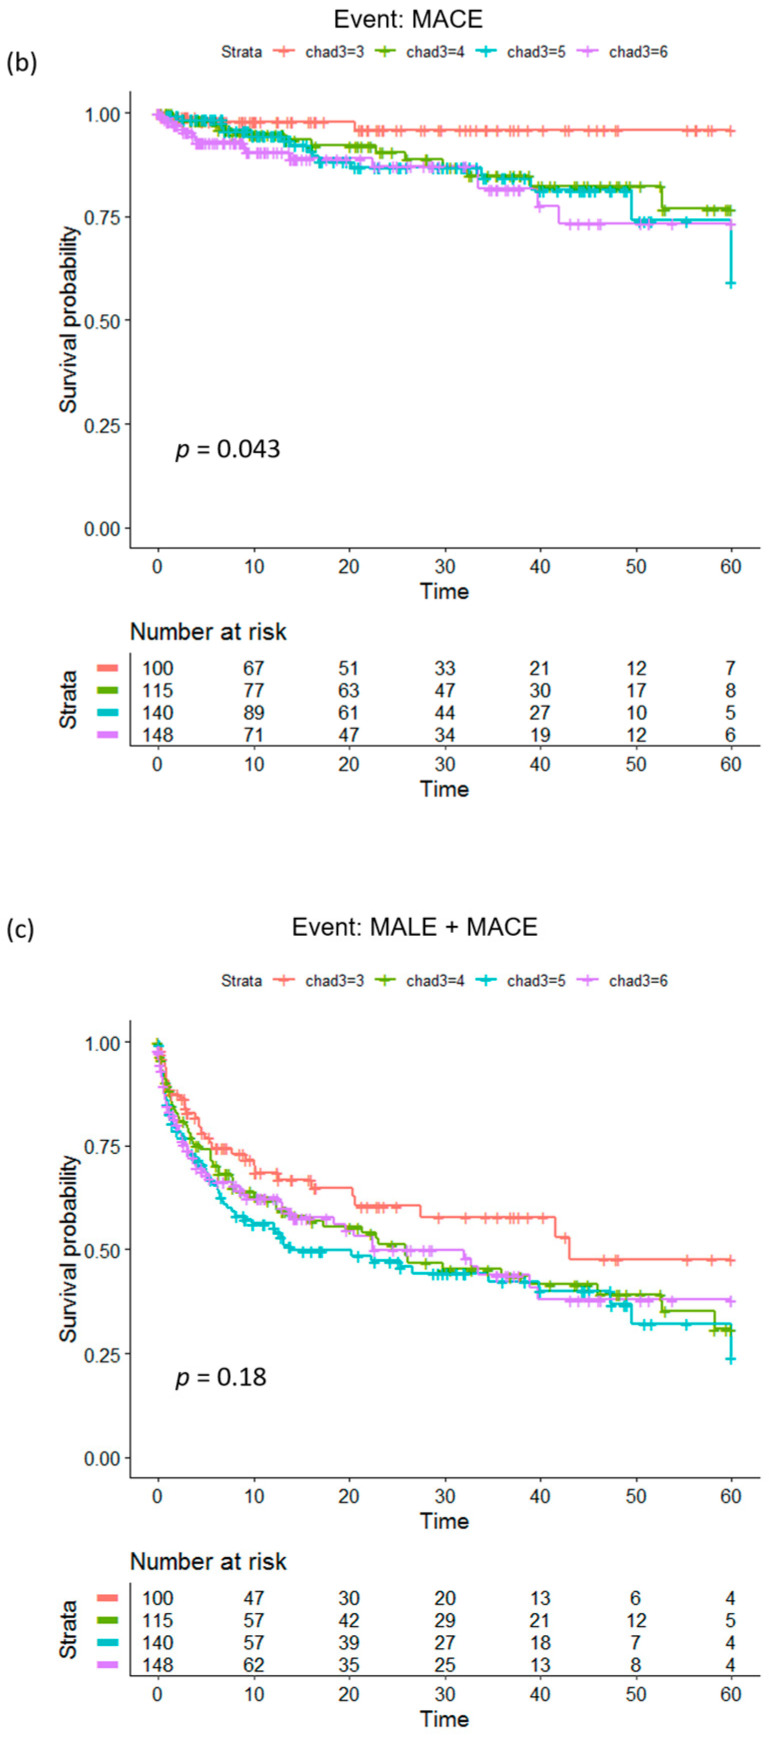
Figure 3.
Kaplan–Meier plots to compare the time-to-event probability of subjects (N = 503) with different MCR scores (low-risk, moderate-risk, high-risk, very high-risk). The p values indicate whether significant differences exist among the different groups: (a) MALEs, (b) MACEs, and (c) MALEs + MACEs. MALEs: major adverse limb events; MACEs: major adverse cardiovascular events.


