

Tissue-specific genetic features in multiple tissues can inform prediction of drug side effects in clinical trials.
Abstract
Adverse side effects often account for the failure of drug clinical trials. We evaluated whether a phenome-wide association study (PheWAS) of 1167 phenotypes in >360,000 U.K. Biobank individuals, in combination with gene expression and expression quantitative trait loci (eQTL) in 48 tissues, can inform prediction of drug side effects in clinical trials. We determined that drug target genes with five genetic features—tissue specificity of gene expression, Mendelian associations, phenotype- and tissue-level effects of genome-wide association (GWA) loci driven by eQTL, and genetic constraint—confer a 2.6-fold greater risk of side effects, compared to genes without such features. The presence of eQTL in multiple tissues resulted in more unique phenotypes driven by GWA loci, suggesting that drugs delivered to multiple tissues can induce several side effects. We demonstrate the utility of PheWAS and eQTL data from multiple tissues for informing drug side effect prediction and highlight the need for tissue-specific drug delivery.
INTRODUCTION
The high failure rates and considerable costs associated with the development of novel drug therapeutics in clinical trials can be largely attributed to the occurrences of unforeseen adverse side effects and inefficacy of drugs in mitigating disease outcomes (1). The causes of adverse side effects for drugs are multifactorial but include the biodistribution of drugs to unintended and undesired tissues (2) and the metabolic conversion of drugs to metabolites (3). Recent studies indicate that human genetic data can inform drug success in clinical trials and therefore have the potential to guide drug target prioritization (4–6). Specifically, genes targeted by drugs with high efficacy in clinical trials are enriched for Mendelian diseases and complex traits; moreover, this enrichment increases as the phase of clinical trial advances (5). In addition, drug safety profiles can be predicted with the use of human genetic data, as drugs that produce side effects are more likely than those without side effects to target genes with support from genome-wide association (GWA) loci for related phenotypes (6). Although the utility of GWA loci information in predicting drug safety and efficacy has previously been demonstrated, drug outcome (main indication and side effects) prediction using genetics has still been limited. This is, in part, due to (i) the restricted number and scope of phenotypes studied, (ii) the lack of resources to identify biologically relevant tissues, and/or (iii) limited methods to identify causal genes.
The recent emergence of large-scale publicly available human genetic data resources and the development of methods that leverage such resources have mitigated many of these limitations. A phenome-wide association study (PheWAS), in conjunction with electronic medical record (EMR) data—which typically consist of a broad spectrum of medical phenotypes defined through integration of International Classification of Diseases (ICD) billing codes, clinical laboratory tests, and additional clinical information—can greatly expand the number and scope of phenotypes studied (7).
In addition, functional studies have shown that the alteration of gene expression levels in disease-relevant tissues can have an effect on disease risk (8, 9). Moreover, the phenotypic consequences of genetic variation mediated by expression regulation can depend partially on context. For example, a large study using expression quantitative trait loci (eQTL) information from 44 tissues in 449 individuals from the Genotype-Tissue Expression (GTEx) project showed that GWA loci are enriched for eQTL in biologically relevant tissues (10).
Last, the development of a colocalization method that integrates eQTL and GWA summary statistics in a Bayesian framework for a given locus has been an important advancement to identify gene variant expression colocalized signals (11, 12). The approach has shown vast improvement in identifying causal genes driving GWA loci over existing methods that relied solely on physical proximity or overlap with variant annotations, functional region annotations, and/or eQTL (11–14).
In the present study, we hypothesize that GWA loci driven by eQTL in biologically relevant tissues can act as a proxy for drug-induced perturbations causing side effects. We leverage the aforementioned resources and methods: (i) a PheWAS of 1167 EMR phenotypes from >360,000 individuals from the U.K. Biobank, (ii) gene expression and eQTL information from 48 tissues from the GTEx project, (iii) colocalization leveraging eQTL and GWA loci signals, and (iv) a clinical trial drug side effect dataset of 1780 drugs comprising 1398 target genes. We determine whether (i) prediction of clinical trial drug side effects can be informed through incorporation of tissue-specific gene expression and eQTL from multiple tissues, and (ii) adverse side effects may arise as a result of delivery of drugs to biologically irrelevant tissues through examination of gene variant expression colocalized signals in multiple tissues.
RESULTS
Descriptive statistics of genetic predictors and clinical trial side effects
We characterized 1780 drugs comprising 1398 target genes by their associated side effects and by genetic predictors—such as gene expression level, presence of expression regulation, evolutionary constraint, and phenotypic associations in multiple tissues—that may inform drug side effects (Fig. 1; see Materials and Methods). We integrated the clinical trial drug side effect datasets and U.K. Biobank phenotypes by following the approach used by Nguyen et al. (6) and mapped both side effects and phenotypes from GWA loci to 21 System Organ Class (SOC) terms from the Medical Dictionary for Regulatory Activities (MedDRA) structure. We then integrated this dataset with gene expression and eQTL information from the GTEx project by mapping the 21 SOC terms to the 48 tissues represented in the GTEx dataset (Materials and Methods and table S1). The tissues that were mapped span a wide range of tissues including arterial (e.g., coronary, tibial, and aortic arteries), endocrine (e.g., adrenal, thyroid, and pituitary glands), brain (e.g., cerebellum and cortex), and respiratory (e.g., lung) (table S1). Furthermore, the phenotypes studied in the U.K. Biobank span several different categories including adiposity (e.g., arm fat mass and arm fat percentage), cardiovascular (e.g., angina pectoris), and respiratory (e.g., asthma and chronic bronchitis), among many others (table S1). In total, after integration of the various datasets, there were 1167 phenotypes that had information for colocalization from GWA loci summary statistics from the U.K. Biobank and eQTL in 48 tissues from GTEx and the clinical trial drug side effect dataset (Materials and Methods). A description of the integrated dataset is provided in fig. S1 and table S2.
Fig. 1. Flowchart of the integrated dataset used in the study.

A schematic and flowchart outlining integration of the clinical trial and genetic information datasets used in the present study. SOC, System Organ Class; TPM, transcripts per million; OMIM, Online Mendelian Inheritance in Man; OE, observed/expected score; SE, side effect; SNP X, single nucleotide polymorphism X; GI, gastrointestinal; EBV, Epstein-Barr virus; CNS, central nervous system.
Addition of EMR-linked phenotypes and multiple tissues increases genetic support coverage for drug side effects
Leveraging GWA loci data from PheWAS of EMR phenotypes can potentially improve genetic support coverage for drug side effects; EMR databases typically contain a wealth of clinical phenotypes (including ICD billing codes, clinical laboratory tests, and other clinical measures) not matched in spectrum and granularity by curated GWA databases. Similarly, the power of GTEx as a resource stems from its wide breadth of sampled tissues, which allows for identification of an increased number of gene expression and eQTL signals.
To test how the addition of EMR-linked phenotypes and multiple tissues can increase coverage of genetic support for drug side effects, we calculated the percentage of drug side effects that were supported by a gene variant expression colocalized signal [calculated by the number of side effects (in GTEx terms) of a drug target gene that also has a gene variant expression colocalized signal for that gene and phenotype (in GTEx terms) divided by the total number of side effects (in GTEx terms) of all drug target genes, multiplied by 100] after randomly sampling from n = 1 to n = 48 GTEx tissues (Fig. 2A) or n = 1 to n = 1150 U.K. Biobank phenotypes from a GWA locus successively (Fig. 2B).
Fig. 2. Drug side effects supported by GWA loci as a function of number of sampled tissues and number of sampled phenotypes.
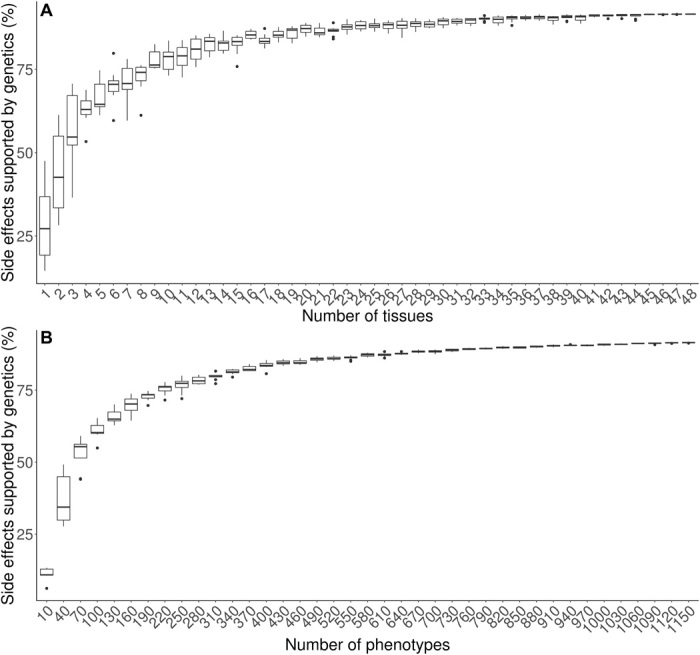
Sampling of n = 1 to n = 48 GTEx tissues or of n = 10 to n = 1150 phenotypes. The percentage of drug side effects with genetic support was calculated by the number of side effects (in GTEx terms) of a drug target gene that also has a gene variant expression colocalized signal for that gene and phenotype (in GTEx terms) divided by the total number of side effects (in GTEx terms) of all drug target genes, multiplied by 100. The percentage of drug side effects with genetic support increased as both the (A) number of tissues and the (B) number of phenotypes sampled increased by a gene variant expression colocalized signal.
We observed a substantial increase in the percentage of side effects with genetic support due to incorporation of more tissues and phenotypes; the percentage of genetically supported side effects increased from 1 to 91% as both the number of tissues increased and the number of phenotypes from a GWA locus increased. The results suggest that inclusion of a wide array of both tissues and phenotypes can provide more genetic support for drug side effects.
As a sensitivity analysis, we also considered a subset of tissues that are less correlated since previous studies have reported substantial correlation of gene expression between tissues in the GTEx project (15, 16). We calculated the Pearson correlation, r2, for the expression [transcripts per million (TPM) values] of genes between all pairs of GTEx tissues. We selected tissues such that each pair of tissues had correlation of gene expression values of r2 < 0.30. In the set of less correlated tissues, we observed a similar pattern where the percentage of genetically supported side effects increased as the number of tissues increased (fig. S2). We note that the slope of the relationship appears to diminish as the number of tissues and phenotypes increases when considering all tissues and phenotypes. This is, in part, due to the set of tissues and phenotypes being correlated. The addition of tissues and phenotypes that are independent and therefore uncorrelated to the set that is studied here will provide more meaningful increases in genetically supported side effects. This is consistent with the more linear relationship seen among the set of less correlated tissues in fig. S2. The results show that the inclusion of larger numbers of phenotypes and tissues when using genetic data to inform drug development will result in greater sensitivity in identification of genetic support for drug side effects, thereby improving drug side effect prediction.
Drug side effects are predicted by multiple genetic features
Using the integrated dataset (Fig. 1), we next assessed whether multiple lines of genetic data can predict drug side effects. We considered six genetic features a priori to define genetic support: (i) Mendelian genes from the Online Mendelian Inheritance in Man (OMIM) catalog, (ii) eQTL in a given tissue that underlies GWA loci through a gene variant expression colocalized signal (coloc2 tissue), (iii) GWA phenotype that is driven by eQTL through a gene variant expression colocalized signal (coloc2 phenotype), (iv) genetic constraint as measured by OE (observed/expected), (v) tissue sharing of gene expression, and (vi) tissue specificity of gene expression (see Materials and Methods). In multivariable analyses using a mixed-effect regression model of 1780 drugs and genetic data from 48 GTEx classes and 1167 GWA phenotypes, while adjusting for drug route and drug modality as covariates, we observed significant associations between side effect occurrence in a GTEx class and all genetic features in a GTEx class except tissue sharing of expression (Table 1 and table S3). We obtained decent performance of all five genetic features on side effect occurrence (area under the curve = 0.66) (fig. S3). The five significant genetic features were generally independent, with modest correlation between pairs of genetic features ranging from Pearson r = −0.076 to 0.20 across all tissues (table S4). We observed that drugs having genetic support as defined by all five significant genetic features had 2.6-fold risk of side effect occurrence, compared to drugs lacking any genetic support (table S5). Genetic support as defined by one or more genetic features resulted in side effect risk ranging from 1.1- to 2.6-fold. Similar results were obtained when restricted to drugs with only one target gene (table S5).
Table 1. Prediction of drug side effects from joint modeling of five genetic features.
Features considered include the following: Mendelian associations from OMIM, coloc2 phenotype: phenotype-level effects of gene expression regulation from colocalization, coloc2 tissue: tissue-level effects of gene expression regulation from colocalization, upper bound of OE confidence interval <0.35, expression level in TPM, and tissue specificity of gene expression (TPM > 0.5 and Tau > 0.5). Results were adjusted for drug route and drug modality.
| All 1780 drugs | 932 drugs with one target gene | |||||
| Predictor | Odds ratio |
95% confidence
interval |
P | Odds ratio |
95% confidence
interval |
P |
| OMIM | 1.37 | 1.32–1.42 | 6.7 × 10−74 | 1.36 | 1.29–1.43 | 2.2 × 10⁻³¹ |
| coloc2 phenotype | 1.14 | 1.08–1.20 | 1.1 × 10⁻⁶ | 1.09 | 1.03–1.16 | 4.6 × 10⁻³ |
| coloc2 tissue | 1.18 | 1.14–1.23 | 7.6 × 10⁻²² | 1.04 | 0.98–1.11 | 0.17 |
| Upper bound of OE confidence interval <0.35 |
1.15 | 1.11–1.20 | 4.6 × 10⁻¹² | 1.33 | 1.26–1.40 | 1.0 × 10⁻²³ |
| Tissue specificity (TPM > 0.5 and Tau > 0.5) |
1.23 | 1.19–1.26 | 1.6 × 10−39 | 1.18 | 1.13–1.23 | 2.4 × 10⁻¹³ |
To ensure that these enrichments were not due to bias unaccounted for in our analysis, we permuted the side effect variable to obtain a randomly shuffled outcome variable and performed the same mixed-effect regression modeling of the five significant genetic feature fields. With 1000 permutations, we observed no inflation; there was an expected null average odds ratio of 1.0 and a controlled empirical false-positive rate of approximately 5.0% for each of the five genetic features (table S6).
Drug side effects are associated with perturbation of target gene expression in multiple tissues
Last, we explored the possibility of adverse side effects arising as a result of delivery of the drug to nonrelevant tissues. Leveraging eQTL that underlie GWA loci as proxies for drug-induced perturbations of gene activity that result in side effects, we tested whether gene variant expression colocalized signals that are present in multiple GTEx tissues also affect multiple phenotypes. We observed a strong correlation (Spearman ρ = 0.58) between the number of tissues and the number of resulting unique phenotypes with a gene variant expression colocalized signal when restricted to off-target side effects. The correlation was driven by instances in which the GTEx tissue and GWA phenotype for the gene variant expression colocalized signal matched in terms of biological relevance (Fig. 3).
Fig. 3. Number of tissues for a given gene variant expression colocalized signal is correlated with number of phenotypes from a GWA locus for off-target side effects.
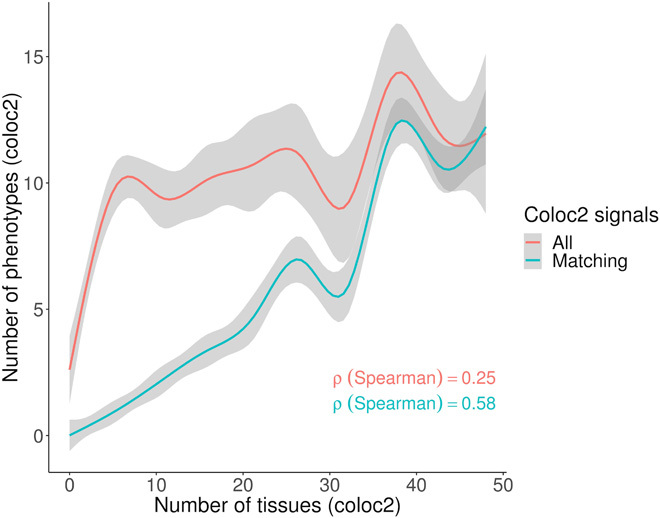
Off-target side effects were evaluated by removing drug events where the side effect for a GTEx term matched the main indication for a GTEx term. The main indications for 21 SOCs for the drugs were mapped to 48 GTEx terms using the same phenotype mapping strategy as performed for side effects, as described in Materials and Methods. After restricting to off-target side effects, the plot shows the number of unique phenotypes from a gene variant expression colocalized signal, mapped to 48 GTEx terms, plotted against the number of GTEx tissues with a gene variant expression colocalized signal for the same drug target genes. A correlation was observed for all phenotypes (red curve labeled “All”) between the numbers of unique GTEx terms corresponding to a phenotype from a gene variant expression colocalized signal, with the numbers of unique GTEx terms corresponding to a tissue from a gene variant expression colocalized signal. A strong correlation was observed when restricting to instances where the GTEx term was the same for the phenotype and tissue for the gene variant expression colocalized signal (green curve labeled “Matching”).
Examining this further, we assigned each of the 1167 phenotypes from the gene variant expression colocalized signals to 1 of 11 main tissue supercategories. We observed that gene expression regulation in a certain tissue type can result in a myriad of different phenotypic consequences, not all of which appear to be biologically relevant (fig. S4). For example, we show that GWA loci for cardiovascular traits such as blood pressure (e.g., “Vascular/heart problems diagnosed by doctor: High blood pressure” and “Non-cancer code, self-reported: hypertension”), pulse rate (e.g., “Pulse rate, automated reading”), and adiposity (e.g., “Arm fat mass” and “Arm fat percentage”) are driven by eQTL that occur broadly in other tissues. On the other hand, brain-related phenotypes (e.g., “Cerebral ischemia” and “Lack of coordination”) are driven by eQTL that are not typically observed with its biologically relevant tissue. By analogizing a regulatory variant that alters gene activity and produces a phenotypic consequence, with a drug that perturbs gene activity and results in a side effect, these results imply that delivery of drugs to multiple tissues—including tissues ostensibly unrelated to the disease of interest—can induce several undesirable side effects.
Colocalization and PheWAS analyses applied to select drug target genes
To showcase the utility and validity of our predictive model, we selected nine drugs (Table 2) that recapitulated well-known side effects using genetic support from all five significant genetic features identified in our predictive scheme in Table 1. In these instances, the reported phenotype from a GWA locus matched the reported drug side effect in relevant tissues, providing a strong biological rationale for the findings. For example, we observed an eQTL signal in both colonic and esophageal tissues for the ATPase Na+/K+ Transporting Subunit Alpha 1 (ATP1A1) gene, a drug target for heart failure, that colocalized with a GWA locus for the “K59 other functional intestinal disorders” phenotype in the U.K. Biobank PheWAS analysis. Clinical trials have shown that drugs targeting ATP1A1, such as digoxin, can result in nausea, vomiting, and diarrhea (17, 18), thus supporting our observed side effect results.
Table 2. Selected case examples of drug side effects supported by our model composed of five genetic features.
Side effects were supported by five genetic features from our model: Mendelian associations from OMIM, coloc2 phenotype: phenotype-level effects of gene expression regulation from colocalization, coloc2 tissue: tissue-level effects of gene expression regulation from colocalization, upper bound of OE confidence interval <0.35, level in TPM, and tissue specificity of gene expression (TPM > 0.5 and Tau > 0.5). For the side effect column, the side effect/the time of onset/prevalence of side effects were reported and obtained from the prescribers’ digital reference website (www.pdr.net). SAIGE and NEALE are PheWAS datasets used in the study (see Materials and Methods).
| Drug name | Drug use | Target gene | coloc2 tissue(s) | coloc2 phenotype | Side effect(s) |
| Leflunomide | Rheumatoid arthritis and psoriatic arthritis |
DHODH (dihydroorotate dehydrogenase) |
Heart left ventricle and heart atrial appendage |
Hypertension (SAIGE 401) | Hypertension/ early/9.0–10.0 |
| Heart atrial appendage and heart left ventricle |
Essential hypertension (SAIGE 401.1) |
||||
| Heart left ventricle, artery aorta, and artery tibial |
Non-cancer illness code, self-reported: hypertension [UK biobank (UKBB) NEALE 20002_1065] |
||||
| Artery aorta and artery tibial |
Systolic blood pressure, automated reading (UKBB NEALE 4080) |
||||
| Artery aorta | Vascular/heart problems diagnosed by doctor: high blood pressure (UKBB NEALE 6150_4) |
||||
|
PTK2B (protein tyrosine kinase 2 beta) |
Heart left ventricle and heart atrial appendage |
Hypertension (SAIGE 401) | |||
| Heart atrial appendage and heart left ventricle |
Essential hypertension (SAIGE 401.1) |
||||
| Heart atrial appendage | Non-cancer illness code, self-reported: hypertension (UKBB NEALE 20002_1065) |
||||
| Whole blood | Diastolic blood pressure, automated reading (UKBB NEALE 4079) |
||||
| Whole blood | Systolic blood pressure, automated reading (UKBB NEALE 4080) |
||||
| Heart atrial appendage | Vascular/heart problems diagnosed by doctor: high blood pressure (UKBB NEALE 6150_4) |
||||
| Artery tibial and artery aorta |
Medication for cholesterol, blood pressure, or diabetes: blood pressure medication (UKBB NEALE 6177_2) |
||||
| Atomoxetine | Attention-deficit hyperactivity disorder |
GRIN3A [glutamate ionotropic receptor N-methyl-D-aspartate (NMDA) type subunit 3A] |
Brain cerebellum | Sensitivity/hurt feelings (UKBB NEALE 1950) |
Suicidal ideation/ delayed/0.4 |
| Brain nucleus accumbens basal ganglia, brain cerebellar hemisphere, brain cortex, and brain cerebellum |
Mood swings (UKBB NEALE 1920) |
||||
| Brain nucleus accumbens basal ganglia, brain cortex, and brain cerebellum |
Worrier/anxious feelings (UKBB NEALE 1980) |
||||
| Brain cortex, brain nucleus accumbens basal ganglia, brain cerebellum, and brain cerebellar hemisphere |
Tense/“highly strung” (UKBB NEALE 1990) |
||||
| Brain nucleus accumbens basal ganglia, brain cerebellar hemisphere, brain cortex, and brain cerebellum |
Worry too long after embarrassment (UKBB NEALE 2000) |
||||
| Digoxin | Heart failure | ATP1A1 | Sigmoid colon and esophagus mucosa |
Diagnoses—main icd10: k59 other functional intestinal disorders (UKBB NEALE K59) |
Diarrhea/early/3.3 |
| Sigmoid colon and esophagus mucosa |
Diagnoses—main icd10: k59 other functional intestinal disorders (UKBB NEALE K59) |
Nausea/early/3.3 | |||
| Sigmoid colon and esophagus mucosa |
Diagnoses—main icd10: k59 other functional intestinal disorders (UKBB NEALE K59) |
Vomiting/early/1.6 | |||
| Tiagabine | Epilepsy | SLC6A1 | Muscle skeletal | Symptoms involving nervous and musculoskeletal systems (SAIGE 781) |
Asthenia/ delayed/18.0–23.0 |
| Etonogestrel | Progestin-only contraceptive |
PGR (progesterone receptor) |
Artery aorta and artery tibial |
Hypertension (SAIGE 401) |
Hypertension/ early/0–5.0 |
| Artery aorta and artery tibial |
Essential hypertension (SAIGE 401.1) |
||||
| Artery aorta and artery tibial |
Vascular/heart problems diagnosed by doctor: high blood pressure (UKBB NEALE 6150_4) |
||||
| Artery aorta and artery tibial |
Medication for cholesterol, blood pressure, or diabetes: blood pressure medication (UKBB NEALE 6177_2) |
||||
| Phentermine | Obesity |
SLC6A4 (solute carrier family 6 member 4) |
Artery aorta | Non-cancer illness code, self-reported: angina (UKBB NEALE 20002_1074) |
Cardiac valvulopathy/ delayed/0–1.0 |
| Artery aorta | Vascular/heart problems diagnosed by doctor: angina (UKBB NEALE 6150_2) |
||||
| Artery aorta | Medication for cholesterol, blood pressure, or diabetes: cholesterol-lowering medication (UKBB NEALE 6177_1) |
||||
| Artery aorta | Non-cancer illness code, self-reported: hypertension (UKBB NEALE 20002_1065) |
Pulmonary hypertension/ delayed/0–1.0 |
|||
| Esketamine | Depression | GRIN3B | Brain cerebellum, brain nucleus accumbens basal ganglia, brain cortex, and brain cerebellar hemisphere |
Pain type(s) experienced in past month: headache (UKBB NEALE 6159_1) |
Headache/early/20.0 |
DISCUSSION
In contrast to previous studies that have focused primarily on genetic evidence from GWA studies and Mendelian disease catalogs and have not dissected association information at the tissue level, we evaluated whether incorporating PheWAS, eQTL, and tissue-specific genetic information can better inform prediction of drug side effects in clinical trials. In the current study, we provide evidence for the following: (i) A non-negligible proportion of drug side effects are supported by current genetic data; (ii) the analysis of larger numbers of phenotypes and tissues results in increased sensitivity in genetic support ascertainment; (iii) genes with five genetic features can predict up to 2.6-fold increased risk of side effects, compared to genes with no features; and (iv) the number of tissues is correlated with the number of unique phenotypes observed for a gene variant expression colocalized signal.
Our findings showed that multiple genetic features, including tissue specificity of gene expression, genetic constraint, GWA loci mediated by eQTL, and Mendelian genes, can inform drug side effect prediction. A major focus of many studies has been the use of rare protein coding variation identified through exome sequencing and exome chip genotyping data to support drug outcomes. Our results suggest that the study of polygenic traits, as well as the use of additional orthogonal sources of genomic information including PheWAS, eQTL, and tissue-specific genetic information, can be of substantial value and represent an unique contribution to the human genetics–supported drug discovery field. A recent study incorporating various functional and pathway-based annotations further demonstrated the utility of such an approach (19, 20).
Furthermore, signals were most pronounced in disease-relevant tissues showing target gene expression and regulation. This is consistent with a recent study that found that GWA loci were enriched in relevant tissues with expressed genes (21). Our results are also consistent with a study that found that GWA loci were enriched for eQTL in relevant tissues (10). Together, these results suggest that tissue source should be taken into consideration when leveraging genetic information to predict drug outcomes, as data from disease-relevant tissues may have greater utility.
In addition, we found that the number of phenotypes from GWA loci increases with the number of tissues showing gene expression perturbation due to eQTL. This finding has important implications as it suggests that drugs should be carefully targeted toward specific tissues where the drug activity is relevant rather than administered widely throughout the body. Ubiquitous and systemic delivery of a drug therapeutic could expose nonrelevant tissues to drugs, resulting in the occurrence of adverse side effects. Drug delivery approaches that target specific organs and/or tissues are currently in development such as liposomes as carriers for delivering drugs (22). Our results lend support to the need for such technologies (23, 24).
The current study has several limitations. First, case/control imbalance for certain EMR phenotypes due to low disease prevalence results in reduced statistical power to identify GWA loci. We used GWA summary statistics that used a mixed-model method to account for this imbalance (25). Second, a number of phenotypes are based on either billing classifications (ICD-10) or self-report data, which can result in misclassification and bias in disease definition. In this regard, drug research and development pipelines that leverage EMR-linked biobank data would greatly benefit from the use of clinical algorithms that can generate disease definitions from structured and unstructured EMR data. Efforts such as EMERGE (www.genome.gov/Funded-Programs-Projects/Electronic-Medical-Records-and-Genomics-Network-eMERGE) have been developed primarily to address this unmet need. Third, genetic evidence in the form of GWA loci was seen among the majority of side effects, but approximately 10% of side effects were still missing genetic support. There are a number of potentially responsible factors, including lack of GWA loci due to reduced statistical power for certain phenotypes, lack of representation for side effects that do not have related phenotypes that were tested in genetic association analyses, lack of relevant tissues, and, additionally, the reporting of clinical trial side effects that were not directly caused by the relevant drugs. Fourth, the lack of granularity in the SOC term and GTEx tissue mapping methods that enable integration across datasets [described in previous studies (5, 6) and also used here] may result in the misclassification of certain phenotypes and also greatly limits the utility of our approach to be used for individual prediction of side effects for drug target genes. Therefore, our findings should be viewed as providing proof of concept. In the future, the mapping of target gene association phenotypes with drug outcomes should be performed without the usage of a classification system. Fifth, an eQTL in a biologically relevant tissue for a given phenotype may not always align with a drug target gene associated with a side effect due to unknown off-target effects of the drug and/or the drug binding to multiple targets causing perturbations on entire pathways. Sixth, genetic perturbation due to an eQTL is not the same as perturbation due to a drug therapeutic because a genetic variant can be seen as a lifelong exposure, whereas a drug therapeutic represents a short-term exposure. However, the correlation between genetic colocalization and drug side effects suggests that this is not an unreasonable assumption.
In summary, we have provided compelling evidence that the use of EMR-linked PheWAS data, in combination with gene expression and gene regulation data from multiple tissues, represents a powerful approach for informing drug side effects in clinical trials. Furthermore, our findings highlight the need for tissue-targeted delivery of drug therapeutics.
MATERIALS AND METHODS
Drug side effect clinical trial dataset and target gene information sources
We used a publicly available coded clinical trial drug dataset of 1819 drugs, described by Nguyen et al. (6). In brief, side effects of drugs from clinical trials were obtained from the Cortellis Clinical API and Cortellis Drug Design API. The 1819 drugs were selected based on a protein target present in at least one of three databases [Pharmaprojects (Informa PLC)] (26, 27). Drug route and drug modality were also provided and described by Nguyen et al. (6). Exclusion criteria as defined by Nguyen et al. (6) included drugs from oncology and combination therapy trials, drugs with common side effects, and non–small-molecule/biologic drugs. In total, we mapped all target genes without filtering based on pharmacological action (recorded as Entrez Gene IDs) for 1780 drugs in the clinical trial drug dataset using DrugBank (27), Citeline Pharmaprojects, and a curated dataset of U.S. Food and Drug Administration–approved therapeutic efficacy targets (26).
Gene expression, tissue sharing/specificity, and gene regulation
We integrated gene expression and gene regulatory information (eQTL) from datasets from GTEx Analysis V7 (https://gtexportal.org/home/; 11,688 samples from 53 tissues from 714 donors and 10,294 samples from 48 tissues from 620 donors for eQTL analysis). We examined the following metrics (see below for details): (i) gene expression (median TPM), (ii) tissue sharing (Tau ≤ 0.5)/tissue specificity (Tau > 0.5) of a gene (Tau), and (iii) colocalization of eQTL and GWA loci across all single-nucleotide variants (SNVs) in a locus [posterior probability (PPH4) > 0.8] (11, 12). Details for each of the metrics are described below.
Gene expression
Gene expression for all drug target genes was quantified using median TPM values across all samples for a given gene and tissue from the GTEx project (https://gtexportal.org/home/). For a drug with multiple target genes, the median value of the median TPM values calculated across all samples was calculated (median TPM per drug).
Tissue sharing/specificity
Tissue specificity and tissue sharing for genes were calculated across each tissue in the GTEx Analysis V7 using the Tau statistic, as described by Kryuchkova-Mostacci and Robinson-Rechavi (28). For a drug with multiple target genes, the median of Tau values was calculated.
Genetic datasets from GWA catalog and Mendelian databases
We used genetic datasets from GWA loci and Mendelian loci, provided by Nguyen et al. (6), including (i) GWA loci identified from the National Health Genome Research Institute-European Bioinformatics Institute GWA study catalog (29) and (ii) genes involved in Mendelian diseases from the Human Phenotype Ontology and OMIM (30).
GWA loci from a wide array of phenotypes from EMR-linked biobanks
In addition to the genetic annotations from Nguyen et al. (6), we integrated a subset of GWA summary statistics from EMR sources generated from a PheWAS from the U.K. Biobank from two sources: Zhou et al. (25) and Neale et al. (2018) (www.nealelab.is/blog/2017/7/19/rapid-gwas-of-thousands-of-phenotypes-for-337000-samples-in-the-uk-biobank). Details of the GWA summary statistics that we analyzed for the current study are as follows:
1) One thousand seventy-five case-control phenotypes from Phecodes from 408,961 individuals from the U.K. Biobank from Zhou et al. (25). This analysis accounts for the known inflated type 1 error issue due to extreme imbalance of cases and controls that is present for a number of case-control phenotypes in the U.K. Biobank. Phenotypes with number of cases less than 200 were removed.
2) Eighty-three continuous phenotypes from 361,194 individuals from the U.K. Biobank from Neale et al. (2018).
3) Four hundred ninety-five ICD and survey case-control phenotypes from 361,194 individuals from the U.K. Biobank Neale et al. dataset that are not sensitive to the known inflated type 1 error issue reported by Zhou et al. (25). These phenotypes were selected based on a sufficient number of cases relative to controls in the U.K. Biobank, as recommended by Neale et al. [included phenotypes with at least 1250 cases such that minor allele frequency (MAF) = 25/(2* number of cases) > 0.01 for each SNV tested]. We combined the above GWA summary statistic datasets [1653 phenotypes total from 1075 Scalable and Accurate Implementation of GEneralized mixed model (SAIGE) Phecodes + 83 continuous phenotypes + 495 Neale ICD and survey case-control phenotypes (“All” dataset) from the U.K. Biobank].
Gene regulation: eQTL and colocalization
Colocalization of eQTL and GWA signals was determined using coloc2 (11, 12). coloc2 was applied to 1653 phenotypes and eQTL data from 48 tissues from the GTEx project. A MAF threshold of >0.001 was used. coloc2 performs Bayesian tests and calculates posterior probabilities for the following hypothesis tests: (i) PPH1: GWA signal exists only; (ii) PPH2: eQTL signal exists only; (iii) PPH3: both GWA and eQTL signals exist but no colocalization; (iv) PPH4: both GWA and eQTL signals exist and colocalization. Statistical evidence in favor of a colocalization signal was determined using PPH4 > 0.8.
Phenotype mapping procedure
To integrate and harmonize the datasets, drug side effects from clinical trials (6) and GWA loci from Zhou et al. (25) and Neale et al. GWA summary statistic data were both mapped to MedDRA terms and 21 SOC terms (6). The 21 SOC terms were then mapped to 48 tissue terms in the GTEx project (Fig. 1). All mappings were performed manually, with careful guidance from clinicians with expertise in clinical text, structured EMR data, and natural language processing of unstructured EMR data. We note that not all U.K. Biobank phenotypes map to SOC terms and that not all SOC terms map to GTEx terms.
Linked clinical trial drug outcome and genetic dataset
In total, of the 1653 phenotypes, we mapped GWA loci from 1167 phenotypes to the clinical trial drug outcome dataset and gene expression dataset of 48 tissues from the GTEx project. Using the integrated clinical trial drug outcome and genetic dataset, we tested the following six genetic features a priori:
1) Upper bound of OE confidence interval <0.35: We used the OE score—a metric for intolerance to loss-of-function mutations and a measure of constraint per gene. A cutoff of the upper bound of the OE confidence interval <0.35 was used as suggested by Karczewski et al. (31). Constraint was examined because previous studies have shown it to be predictive of genes exhibiting drug side effects (32).
2) OMIM: We used genes involved in Mendelian diseases from the Human Phenotype Ontology and OMIM (30), provided by Nguyen et al. (25). Genetic support from Mendelian diseases was examined because it has been shown to be associated with drug side effect prediction (25).
3) Tissue specificity of gene expression: We dichotomized levels of median TPM for target genes per drug. The TPM threshold of 0.5 was used to indicate presence (TPM > 0.5) and absence (TPM ≤0.5) of gene expression (33). We further dichotomized levels of median Tau (28) for target genes per drug into tissue sharing (Tau ≤ 0.5) and tissue specificity (Tau > 0.5) for 1780 drugs in 48 tissues from the GTEx project. The Tau threshold of 0.5 was used based on Kryuchkova-Mostacci and Robinson-Rechavi (28), which showed a bimodal distribution for Tau with the threshold of 0.5 distinguishing either mode. We generated a genetic feature for tissue specificity of gene expression for drugs with expressed target genes that have TPM > 0.5 and Tau > 0.5.
4) Tissue sharing of gene expression: Using the TPM and Tau metrics as described above, we also generated a genetic feature for tissue sharing of gene expression for drugs with expressed target genes that have TPM > 0.5 and Tau ≤ 0.5.
5) coloc2 phenotype: We identified genes with significant hypothesis tests for colocalization of both eQTL and GWA loci from the Zhou et al. (25) and Neale et al. GWA summary statistic data in each of the 48 tissues in the GTEx project. We evaluated signals with colocalization of both GWA and eQTL signals with PPH4 > 0.8 in our main analyses. We defined a genetic feature called “coloc2 phenotype,” which is a drug target gene with a GWA phenotype that is driven by gene expression regulation through colocalization. We selected this genetic feature because previous studies have shown GWA loci phenotypes to be predictive of genes exhibiting drug side effects (32).
6) coloc2 tissue: From the colocalization analyses described above, we defined a genetic feature called “coloc2 tissue,” which is a drug target gene with gene expression regulation in a given tissue that underlies GWA association through colocalization of both GWA and eQTL signals with PPH4 > 0.8.
We selected the above six genetic features a priori based on previous studies showing enrichment of the genetic features for drug side effects (constraint represented by upper bound of OE confidence interval <0.35, OMIM, and coloc2 phenotype) or to explicitly test whether tissue specificity of gene expression or gene expression regulation is enriched for drug side effects (tissue specificity of gene expression, tissue sharing of gene expression, and coloc2 tissue). We combined these six genetic features (OMIM, upper bound of OE confidence interval <0.35, coloc2 phenotype, coloc2 tissue, tissue specificity of gene expression, and tissue sharing of gene expression) with the clinical trial side effect information (also mapped to 48 GTEx terms). A description of the various genetic datasets and drug clinical trial side effects is shown in Fig. 1.
Statistical analyses
Association analysis of various genetic variables with clinical trial drug outcomes was performed using a mixed-effect logistic regression, used to account for multiple occurrences of 1780 drugs in 48 GTEx tissues. The mixed-effect regression model was composed of the following components: (i) The outcome variable was the side effect; (ii) the predictor variables were the six genetic features listed above; (iii) the random-effect variable was the GTEx term (N = 48); (iv) the covariates were drug route and drug modality. The mixed-effect regression model was performed using the lme4 package in the R project for Statistical Computing (version 3.5, Vienna, Austria). All statistical analyses were performed in Perl and/or R. The studies were approved by the institutional review board of the Icahn School of Medicine at Mount Sinai.
Acknowledgments
Funding: R.D. was supported by R35GM124836 from the National Institute of General Medical Sciences of the NIH and R01HL139865 from the National Heart, Lung, and Blood Institute of the NIH. G.N. was supported by a career development award from the NIH (K23-DK107908) and was also supported by R01-DK108803, U01-HG007278, U01-HG009610, and U01-DK116100. H.-H.W. was supported by the National Research Foundation of Korea (NRF) grant funded by the Korean government (MSIT) (no. 2019R1A2C4070496). A. Dobbyn was supported by T32-HL007824 from the National Heart, Lung, and Blood Institute of the NIH. J.L.R. was supported by T32-DK007757 from the NIH. I.S.F. was supported by T32GM728042, the Medical Scientist Training Program Training Grant from the National Institute of General Medical Sciences of the NIH. The content is solely the responsibility of the authors and does not necessarily represent the official views of the NIH. Author contributions: Á. Duffy, M.V., A. Dobbyn, and R.D. contributed to study conception, data analysis, interpretation of the results, and drafting of the manuscript. H.-H.W., J.LR., I.S.F., G.N., and G.R. contributed to data analysis and/or interpretation of results. Á. Duffy, M.V., and R.D. contributed to critical revision of the manuscript. All authors reviewed and provided comments on the manuscript. Competing interests: R.D. has received research support from AstraZeneca and Goldfinch Bio, not related to this work. G.N. is a scientific cofounder of RenalytixAI, receives financial compensation as consultant and advisory board member for RenalytixAI Inc., and owns equity in RenalytixAI. G.N. has received research from Goldfinch Bio and consulting fees from BioVie Inc. and GLG consulting in the past 3 years, not related to this work. All other authors declare that they have no competing interests. Data and materials availability: All data needed to evaluate the conclusions in the paper are present in the paper and/or the Supplementary Materials. Additional data related to this paper may be requested from the authors.
SUPPLEMENTARY MATERIALS
Supplementary material for this article is available at http://advances.sciencemag.org/cgi/content/full/6/37/eabb6242/DC1
REFERENCES AND NOTES
- 1.Waring M. J., Arrowsmith J., Leach A. R., Leeson P. D., Mandrell S., Owen R. M., Pairaudeau G., Pennie W. D., Pickett S. D., Wang J., Wallace O., Weir A., An analysis of the attrition of drug candidates from four major pharmaceutical companies. Nat. Rev. Drug Discov. 14, 475–486 (2015). [DOI] [PubMed] [Google Scholar]
- 2.Gashaw I., Ellinghaus P., Sommer A., Asadullah K., What makes a good drug target? Drug Discov. Today 17, S24–S30 (2012). [DOI] [PubMed] [Google Scholar]
- 3.Masubuchi N., Makino C., Murayama N., Prediction of in vivo potential for metabolic activation of drugs into chemically reactive intermediate: Correlation of in vitro and in vivo generation of reactive intermediates and in vitro glutathione conjugate formation in rats and humans. Chem. Res. Toxicol. 20, 455–464 (2007). [DOI] [PubMed] [Google Scholar]
- 4.Plenge R. M., Scolnick E. M., Altshuler D., Validating therapeutic targets through human genetics. Nat. Rev. Drug Discov. 12, 581–594 (2013). [DOI] [PubMed] [Google Scholar]
- 5.Nelson M. R., Tipney H., Painter J. L., Shen J., Nicoletti P., Shen Y., Floratos A., Sham P. C., Li M. J., Wang J., Cardon L. R., Whittaker J. C., Sanseau P., The support of human genetic evidence for approved drug indications. Nat. Genet. 47, 856–860 (2015). [DOI] [PubMed] [Google Scholar]
- 6.Nguyen P. A., Born D. A., Deaton A. M., Nioi P., Ward L. D., Phenotypes associated with genes encoding drug targets are predictive of clinical trial side effects. Nat. Commun. 10, 1579 (2019). [DOI] [PMC free article] [PubMed] [Google Scholar]
- 7.Denny J. C., Ritchie M. D., Basford M. A., Pulley J. M., Bastarache L., Brown-Gentry K., Wang D., Masys D. R., Roden D. M., Crawford D. C., PheWAS: Demonstrating the feasibility of a phenome-wide scan to discover gene-disease associations. Bioinformatics 26, 1205–1210 (2010). [DOI] [PMC free article] [PubMed] [Google Scholar]
- 8.Musunuru K., Strong A., Frank-Kamenetsky M., Lee N. E., Ahfeldt T., Sachs K. V., Li X., Li H., Kuperwasser N., Ruda V. M., Pirruccello J. P., Muchmore B., Prokunina-Olsson L., Hall J. L., Schadt E. E., Morales C. R., Lund-Katz S., Phillips M. C., Wong J., Cantley W., Racie T., Ejebe K. G., Orho-Melander M., Melander O., Koteliansky V., Fitzgerald K., Krauss R. M., Cowan C. A., Kathiresan S., Rader D. J., From noncoding variant to phenotype via SORT1 at the 1p13 cholesterol locus. Nature 466, 714–719 (2010). [DOI] [PMC free article] [PubMed] [Google Scholar]
- 9.Kjolby M., Andersen O. M., Breiderhoff T., Fjorback A. W., Pedersen K. M., Madsen P., Jansen P., Heeren J., Willnow T. E., Nykjaer A., Sort1, encoded by the cardiovascular risk locus 1p13.3, is a regulator of hepatic lipoprotein export. Cell Metab. 12, 213–223 (2010). [DOI] [PubMed] [Google Scholar]
- 10.Gamazon E. R., Segrè A. V., van de Bunt M., Wen X., Xi H. S., Hormozdiari F., Ongen H., Konkashbaev A., Derks E. M., Aguet F., Quan J.; GTEx Consortium, Nicolae D. L., Eskin E., Kellis M., Getz G., McCarthy M. I., Dermitzakis E. T., Cox N. J., Ardlie K. G., Using an atlas of gene regulation across 44 human tissues to inform complex disease- and trait-associated variation. Nat. Genet. 50, 956–967 (2018). [DOI] [PMC free article] [PubMed] [Google Scholar]
- 11.Dobbyn A., Huckins L. M., Boocock J., Sloofman L. G., Glicksberg B. S., Giambartolomei C., Hoffman G. E., Perumal T. M., Girdhar K., Jiang Y., Raj T., Ruderfer D. M., Kramer R. S., Pinto D.; CommonMind Consortium , Landscape of conditional eQTL in dorsolateral prefrontal cortex and co-localization with schizophrenia GWAS. Am. J. Hum. Genet. 102, 1169–1184 (2018). [DOI] [PMC free article] [PubMed] [Google Scholar]
- 12.Giambartolomei C., Vukcevic D., Schadt E. E., Franke L., Hingorani A. D., Wallace C., Plagnol V., Bayesian test for colocalisation between pairs of genetic association studies using summary statistics. PLOS Genet. 10, e1004383 (2014). [DOI] [PMC free article] [PubMed] [Google Scholar]
- 13.Gamazon E. R., Wheeler H. E., Shah K. P., Mozaffari S. V., Aquino-Michaels K., Carroll R. J., Eyler A. E., Denny J. C.; GTEx Consortium, Nicolae D. L., Cox N. J., Im H. K., A gene-based association method for mapping traits using reference transcriptome data. Nat. Genet. 47, 1091–1098 (2015). [DOI] [PMC free article] [PubMed] [Google Scholar]
- 14.Gusev A., Mancuso N., Won H., Kousi M., Finucane H. K., Reshef Y., Song L., Safi A.; Schizophrenia Working Group of the Psychiatric Genomics Consortium, McCarroll S., Neale B. M., Ophoff R. A., O’Donovan M. C., Crawford G. E., Geschwind D. H., Katsanis N., Sullivan P. F., Pasaniuc B., Price A. L., Transcriptome-wide association study of schizophrenia and chromatin activity yields mechanistic disease insights. Nat. Genet. 50, 538–548 (2018). [DOI] [PMC free article] [PubMed] [Google Scholar]
- 15.GTEx Consortium; Laboratory, Data Analysis & Coordinating Center (LDACC)—Analysis Working Group; Statistical Methods groups—Analysis Working Group; Enhancing GTEx (eGTEx) groups; NIH Common Fund; NIH/NCI; NIH/NHGRI; NIH/NIMH; NIH/NIDA; Biospecimen Collection Source Site—NDRI; Biospecimen Collection Source Site—RPCI; Biospecimen Core Resource—VARI; Brain Bank Repository—University of Miami Brain Endowment Bank; Leidos Biomedical—Project Management; ELSI Study; Genome Browser Data Integration &Visualization—EBI; Genome Browser Data Integration &Visualization—UCSC Genomics Institute, University of California Santa Cruz; Lead analysts; Laboratory, Data Analysis &Coordinating Center (LDACC); NIH program management; Biospecimen collection; Pathology; eQTL manuscript working group, Battle A., Brown C. D., Engelhardt B. E., Montgomery S. B., Genetic effects on gene expression across human tissues. Nature 550, 204–213 (2017).29022597 [Google Scholar]
- 16.GTEx Consortium , Human genomics. The Genotype-Tissue Expression (GTEx) pilot analysis: Multitissue gene regulation in humans. Science 348, 648–660 (2015). [DOI] [PMC free article] [PubMed] [Google Scholar]
- 17.Yang E. H., Shah S., Criley J. M., Digitalis toxicity: A fading but crucial complication to recognize. Am. J. Med. 125, 337–343 (2012). [DOI] [PubMed] [Google Scholar]
- 18.Amjad W., Qureshi W., Farooq A., Sohail U., Khatoon S., Pervaiz S., Narra P., Hasan S. M., Ali F., Ullah A., Guttmann S., Gastrointestinal side effects of antiarrhythmic medications: A review of current literature. Cureus 9, e1646 (2017). [DOI] [PMC free article] [PubMed] [Google Scholar]
- 19.Fang H.; ULTRA-DD Consortium, De Wolf H., Knezevic B., Burnham K. L., Osgood J., Sanniti A., Lara A. L., Kasela S., De Cesco S., Wegner J. K., Handunnetthi L., McCann F. E., Chen L., Sekine T., Brennan P. E., Marsden B. D., Damerell D., O’Callaghan C. A., Bountra C., Bowness P., Sundström Y., Milani L., Berg L., Göhlmann H. W., Peeters P. J., Fairfax B. P., Sundström M., Knight J. C., A genetics-led approach defines the drug target landscape of 30 immune-related traits. Nat. Genet. 51, 1082–1091 (2019). [DOI] [PMC free article] [PubMed] [Google Scholar]
- 20.Plenge R. M., Priority index for human genetics and drug discovery. Nat. Genet. 51, 1073–1075 (2019). [DOI] [PubMed] [Google Scholar]
- 21.Finucane H. K., Reshef Y. A., Anttila V., Slowikowski K., Gusev A., Byrnes A., Gazal S., Loh P.-R., Lareau C., Shoresh N., Genovese G., Saunders A., Macosko E., Pollack S.; Brainstorm Consortium, Perry J. R. B., Buenrostro J. D., Bernstein B. E., Raychaudhuri S., McCarroll S., Neale B. M., Price A. L., Heritability enrichment of specifically expressed genes identifies disease-relevant tissues and cell types. Nat. Genet. 50, 621–629 (2018). [DOI] [PMC free article] [PubMed] [Google Scholar]
- 22.Puri A., Loomis K., Smith B., Lee J.-H., Yavlovich A., Heldman E., Blumenthal R., Lipid-based nanoparticles as pharmaceutical drug carriers: From concepts to clinic. Crit. Rev. Ther. Drug Carrier Syst. 26, 523–580 (2009). [DOI] [PMC free article] [PubMed] [Google Scholar]
- 23.Busatto S., Pham A., Suh A., Shapiro S., Wolfram J., Organotropic drug delivery: Synthetic nanoparticles and extracellular vesicles. Biomed. Microdevices 21, 46 (2019). [DOI] [PMC free article] [PubMed] [Google Scholar]
- 24.Wilczewska A. Z., Niemirowicz K., Markiewicz K. H., Car H., Nanoparticles as drug delivery systems. Pharmacol. Rep. 64, 1020–1037 (2012). [DOI] [PubMed] [Google Scholar]
- 25.Zhou W., Nielsen J. B., Fritsche L. G., Dey R., Gabrielsen M. E., Wolford B. N., Faive J. L., Haar P. V., Gagliano S. A., Gifford A., Bastarache L. A., Wei W.-Q., Denny J. C., Lin M., Hveem K., Kang H. M., Abecasis G. R., Willer C. J., Lee S., Efficiently controlling for case-control imbalance and sample relatedness in large-scale genetic association studies. Nat. Genet. 50, 1335–1341 (2018). [DOI] [PMC free article] [PubMed] [Google Scholar]
- 26.Santos R., Ursu O., Gaulton A., Bento A. P., Donadi R. S., Bologa C. G., Karlsson A., Al-Lazikani B., Hersey A., Oprea T. I., Overington J. P., A comprehensive map of molecular drug targets. Nat. Rev. Drug Discov. 16, 19–34 (2017). [DOI] [PMC free article] [PubMed] [Google Scholar]
- 27.Wishart D. S., Knox C., Guo A. C., Shrivastava S., Hassanali M., Stothard P., Chang Z., Woolsey J., DrugBank: A comprehensive resource for in silico drug discovery and exploration. Nucleic Acids Res. 34, D668–D672 (2006). [DOI] [PMC free article] [PubMed] [Google Scholar]
- 28.Kryuchkova-Mostacci N., Robinson-Rechavi M., A benchmark of gene expression tissue-specificity metrics. Brief. Bioinform. 18, 205–214 (2017). [DOI] [PMC free article] [PubMed] [Google Scholar]
- 29.Buniello A., MacArthur J. A. L., Cerezo M., Harris L. W., Hayhurst J., Malangone C., Mahon A. M., Morales J., Mountjoy E., Sollis E., Suveges D., Vrousgou O., Whetzel P. L., Amode R., Guillen J. A., Riat H. S., Trevanion S. J., Hall P., Junkins H., Flicek P., Burdett T., Hindorff L. A., Cunningham F., Parkinson H., The NHGRI-EBI GWAS catalog of published genome-wide association studies, targeted arrays and summary statistics 2019. Nucleic Acids Res. 47, D1005–D1012 (2019). [DOI] [PMC free article] [PubMed] [Google Scholar]
- 30.Hamosh A., Scott A. F., Amberger J., Bocchini C., Valle D., McKusick V. A., Online Mendelian Inheritance in Man (OMIM), a knowledgebase of human genes and genetic disorders. Nucleic Acids Res. 30, 52–55 (2002). [DOI] [PMC free article] [PubMed] [Google Scholar]
- 31.Karczewski K. J., Francioli L. C., Tiao G., Cummings B. B., Alföldi J., Wang Q., Collins R. L., Laricchia K. M., Ganna A., Birnbaum D. P., Gauthier L. D., Brand H., Solomonson M., Watts N. A., Rhodes D., Singer-Berk M., Seaby E. G., Kosmicki J. A., Walters R. K., Tashman K., Farjoun Y., Banks E., Poterba T., Wang A., Seed C., Whiffin N., Chong J. X., Samocha K. E., Pierce-Hoffman E., Zappala Z., O’Donnell-Luria A. H., Minikel E. V., Weisburd B., Lek M., Ware J. S., Vittal C., Armean I. M., Bergelson L., Cibulskis K., Connolly K. M., Covarrubias M., Donnelly S., Ferriera S., Gabriel S., Gentry J., Gupta N., Jeandet T., Kaplan D., Llanwarne C., Munshi R., Novod S., Petrillo N., Roazen D., Ruano-Rubio V., Saltzman A., Schleicher M., Soto J., Tibbetts K., Tolonen C., Wade G., Talkowski M. E.; Genome Aggregation Database Consortium, Neale B. M., Daly M. J., MacArthur D. G., Variation across 141,456 human exomes and genomes reveals the spectrum of loss-of-function intolerance across human protein-coding genes. bioRxiv, 531210 (2019). [Google Scholar]
- 32.Begum T., Ghosh T. C., Basak S., Systematic analyses and prediction of human drug side effect associated proteins from the perspective of protein evolution. Genome Biol. Evol. 9, 337–350 (2017). [DOI] [PMC free article] [PubMed] [Google Scholar]
- 33.Ray P. R., Khan J., Wangzhou A., Tavares-Ferreira D., Akopian A. N., Dussor G., Price T. J., Transcriptome analysis of the human tibial nerve identifies sexually dimorphic expression of genes involved in pain, inflammation, and neuro-immunity. Front. Mol. Neurosci. 12, 37 (2019). [DOI] [PMC free article] [PubMed] [Google Scholar]
Associated Data
This section collects any data citations, data availability statements, or supplementary materials included in this article.
Supplementary Materials
Supplementary material for this article is available at http://advances.sciencemag.org/cgi/content/full/6/37/eabb6242/DC1