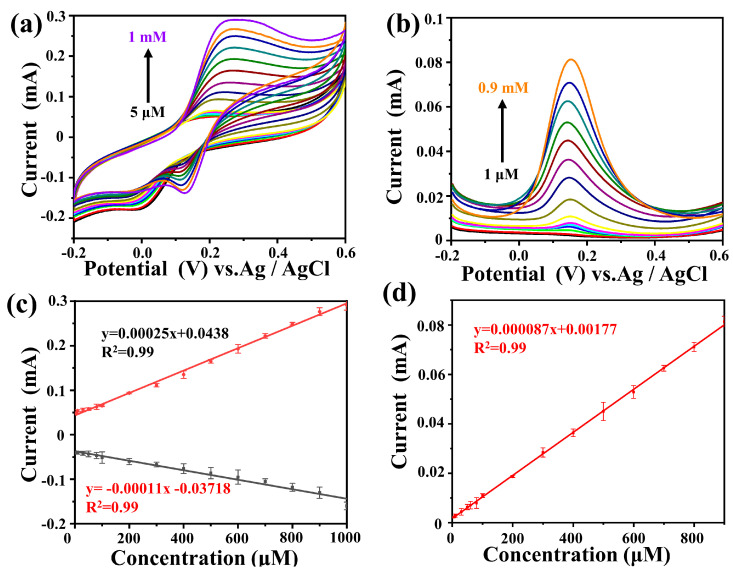
Figure 5.
(a) CV curves of Au@NiS2-FTO in 0.1 M PBS (pH = 7.3) containing various concentrations of DA (5–1 mM) at a scan rate of 0.1 V s−1; (b) DPV curves of Au@NiS2-FTO in 0.1 M PBS (pH = 7.3) containing various concentrations of DA (1–0.9 mM); (c) linear relationship between peak potential and concentration in CV; (d) linear relationship between peak potential and concentration in DPV.

