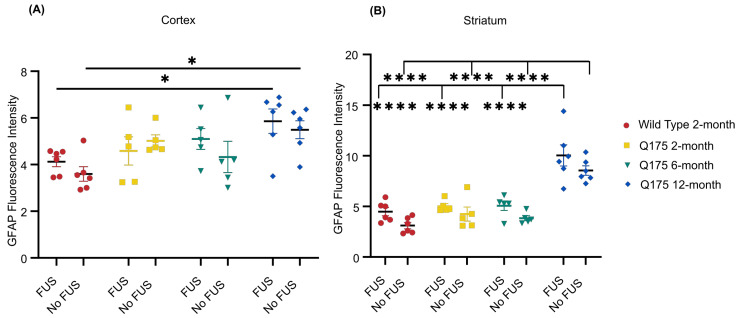
Figure 9.
GFAP fluorescence intensity. (A) Quantification of GFAP fluorescence in the cortex and (B) striatum of FUS-treated WT 2-month (n = 6), zQ175 2-month (n = 5), zQ175 6-month (n = 5), and zQ175 12-month (n = 6) mice following AAV delivery. * p < 0.05, **** p < 0.0001. Data shown are mean ± SEM.

