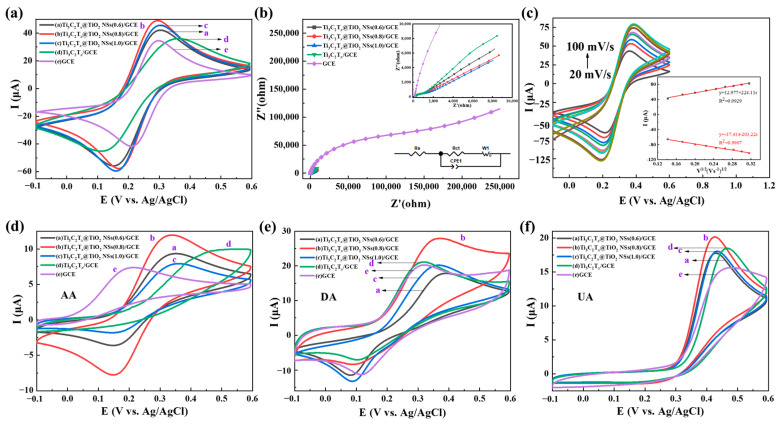
Figure 4.
(a) CV curves and (b) EIS curve of Ti3C2Tx@TiO2 NSs/GCE, Ti3C2Tx/GCE and GCE; (c) CV curves of Ti3C2Tx@TiO2 NSs(0.8)/GCE with different scanning rates. The CV curves of Ti3C2Tx@TiO2 NSs/GCE, Ti3C2Tx/GCE and GCE are detected in (d) 100 μMAA, (e) 100 μM DA and (f) 100 μM UA solutions. In all the experiments, detection was in 0.1 M KCl solution with 0.5 mM K3[Fe (CN)6].

