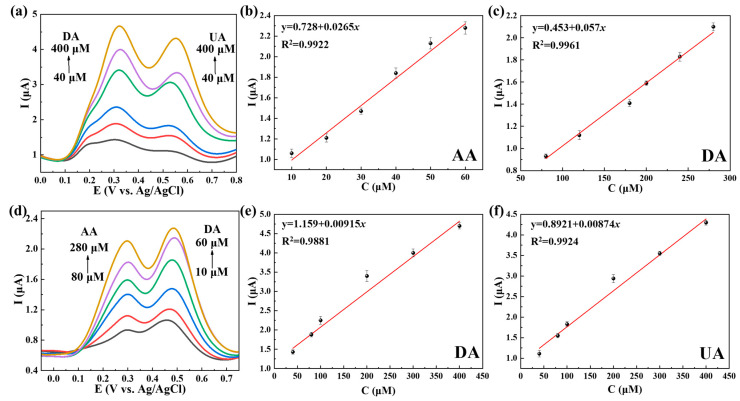
Figure 7.
DPV curves based on different concentrations when detecting (a) AA and DA and (d) DA and UA on Ti3C2Tx@TiO2 NSs/GCE in 0.1 M PBS (pH 7.4). (b,c) Calibration curves for the current vs. concentrations of AA and UA, (e,f) calibration curves for the current vs. concentrations of DA and UA. Error bars based on S/N = 3.

