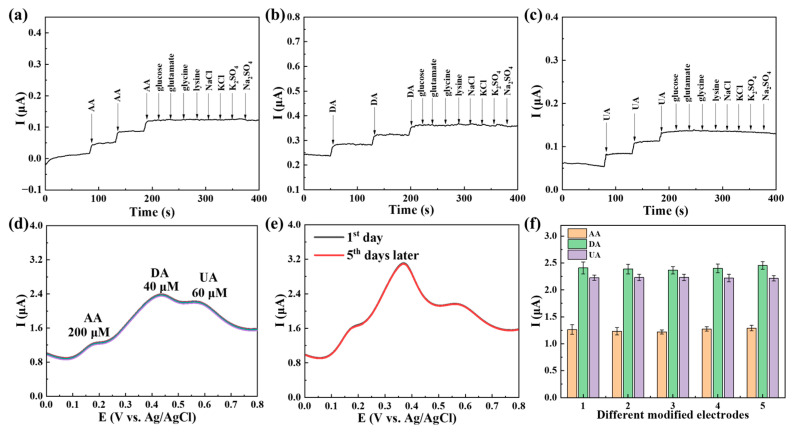
Figure 9.
Amperometric responses of the mixture upon addition of 10 μM (a) AA, (b) DA, (c) UA and 1000 μM other chemicals on Ti3C2Tx@TiO2 NSs/GCE; (d) DPV curves detected 5 consecutive times on Ti3C2Tx@TiO2 NSs/GCE for AA, DA and UA; (e) DPV curve change of Ti3C2Tx@TiO2 NSs/GCE containing 200 μM AA, 40 μM DA and 60 μM UA (5 days) in 0.1 M PBS; (f) peak current using five different Ti3C2Tx@TiO2 NSs/GCE electrodes at fixed concentrations of AA (200 μM), DA (40 μM) and UA (60 μM) in PBS. Error bars based on S/N = 3.

