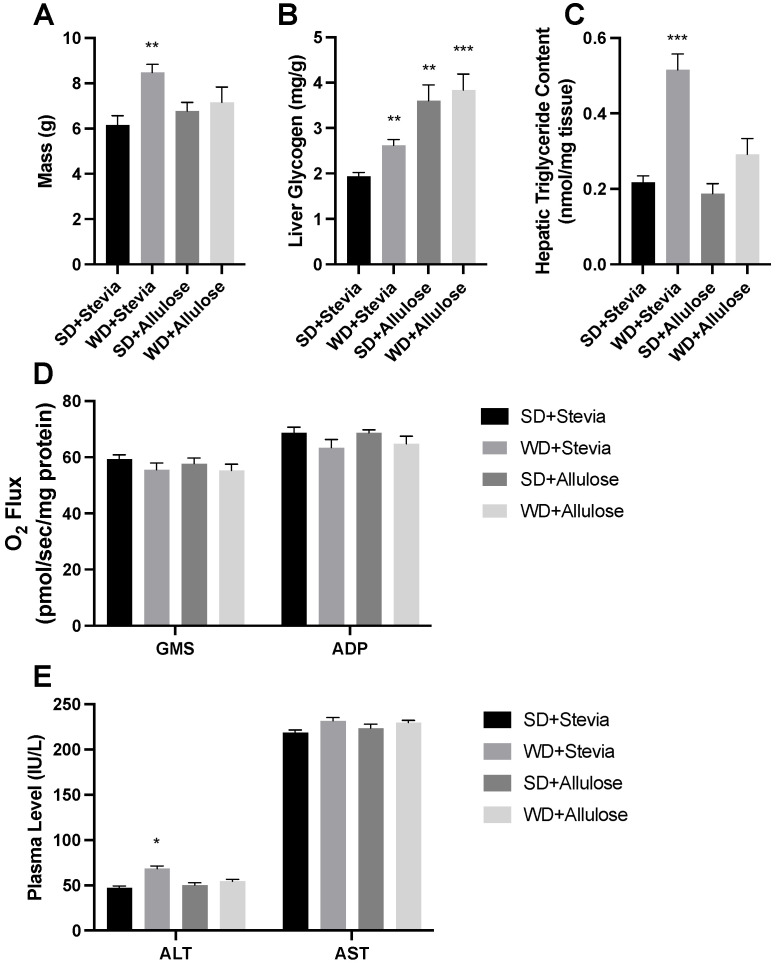
Figure 3.
Liver analysis following 12 wks of allulose consumption. Liver mass was measured (A) prior to the analysis of glycogen (B) and triglycerides (C) following 12 wks of a Western diet (WD) and standard diet (SD) with stevia or allulose in the drinking water. Mitochondrial respiration (see Section 2) was measured to determine any direct impact of diet on function (D). The liver enzymes alanine (ALT) and aspartate aminotransferase (AST) were quantified (E) in the plasma as a marker of liver health. N = 8. * p < 0.05; ** p < 0.005; *** p < 0.0005 vs. SD+stevia.

