

Abstract
Objectives:
The objective of this study is to identify gait alterations related to worsening knee pain, and to worsening physical function, using machine learning approaches applied to wearable-sensor derived data from a large observational cohort.
Methods:
Participants in the Multicenter Osteoarthritis Study (MOST) completed a 20-meter walk test wearing inertial sensors on their lower back and ankles. Parameters describing spatiotemporal features of gait were extracted from this data. We used an ensemble machine learning technique (“super learning”) to optimally discriminate between those with and without worsening physical function and, separately, those with and without worsening pain over 2 years. We then used log-binomial regression to evaluate associations of the top ten influential variables selected with super-learning with each outcome. We also assessed whether the relation of altered gait with worsening function was mediated by changes in pain.
Results:
Of 2324 participants, 29% and 24% had worsening knee pain and function over 2-years, respectively. From the super-learner, several gait parameters were found to be influential for worsening pain and for worsening function. After adjusting for confounders, greater gait asymmetry, longer average step length, and lower dominant frequency were associated with worsening pain, and lower cadence was associated with worsening function. Worsening pain partially mediated the association of cadence with function.
Conclusion:
We identified gait alterations associated with worsening knee pain and those associated with worsening physical function. These alterations could be assessed with wearable sensors in clinical settings. Further research should determine whether they might be therapeutic targets to prevent worsening pain and worsening function.
Knee osteoarthritis (OA) is a leading cause of disability in adults worldwide (1). Knee pain and declining physical function are the key reasons people with knee OA seek medical care. Clinical management of knee OA primarily addresses symptoms with no interventions that may prevent worsening of pain or function (2). There is a need to identify modifiable risk factors related to worsening pain and those related to worsening function in people with knee OA to inform more effective interventions.
Gait alterations (e.g., higher knee adduction moment, varus thrust) are ubiquitous in people with knee OA and are potentially modifiable (3–6). However, prior gait studies in people with knee OA have focused on alterations that may be related to worsening of structural disease (3). While these observations have informed several interventions (e.g., gait retraining, orthotics, etc.), none are strongly recommended in knee OA guidelines as they don’t provide meaningful improvements in pain or function (2). Gait alterations that may be related to worsening pain or function in people with knee OA are less studied. Importantly, while pain and limited physical function are both common in people with knee OA, these impairments may not always co-exist and different factors may be related to worsening pain versus function (7, 8). Identifying gait alterations that are related to worsening pain and those related to worsening function may help identify people at risk, as well as guide gait interventions.
Prior gait studies in people with knee OA have used three-dimensional motion analysis to characterize gait and relied on small sample sizes (3). Motion capture can be cumbersome, expensive, and time consuming, limiting their application to research settings. On the other hand, wearable inertial sensors have been validated for assessment of gait in people with knee OA and allow for implementation in large cohorts and clinical settings (9–11). As such, wearable inertial sensors could assist with translation of research findings to the clinic. Use of wearable sensors to characterize gait in large cohorts also offers the opportunity to use machine learning that can identify gait alterations related to the outcomes without making a priori assumptions about underlying relationships between various risk factors. Such techniques have been previously used to identify wearable sensor derived gait measures related to disease characteristics in other populations (12–15).
Our objective was to identify wearable sensor derived gait characteristics associated with worsening pain and physical function over two years in a large cohort. We also examined whether the association of gait with worsening function was mediated by worsening pain. We first used machine learning to identify gait and non-gait parameters related to worsening pain, and in separate analyses, those related to worsening physical function. We then determined the associations of these gait parameters with worsening pain and physical function while adjusting for potential confounders. Finally, we used causal mediation to estimate whether association of gait characteristics with worsening function was mediated by changes in pain.
PARTICIPANTS AND METHODS
Study Population
The Multicenter Osteoarthritis (MOST) study is an observational cohort study of risk factors related to knee OA. We used data from the 144-month (baseline) and 168-months (two-year follow-up) visits of MOST. At both visits, we included data from participants from the original MOST cohort (age 50-79, with or at increased risk of developing knee OA at enrolment) and a new cohort enrolled at 144-month visit (age 45-69, Kellgren-Lawrence grades ≤2, with or without knee pain). We included participants who had inertial sensor gait data from a 20-meter walk test at the 144-month clinic visit and Western Ontario and McMaster Universities Osteoarthritis Index (WOMAC) Pain and Function scores at the 144-month and 168-month MOST visits (Figure 1). All participants signed an Institutionally approved informed consent form prior to any study procedures.
Figure 1.
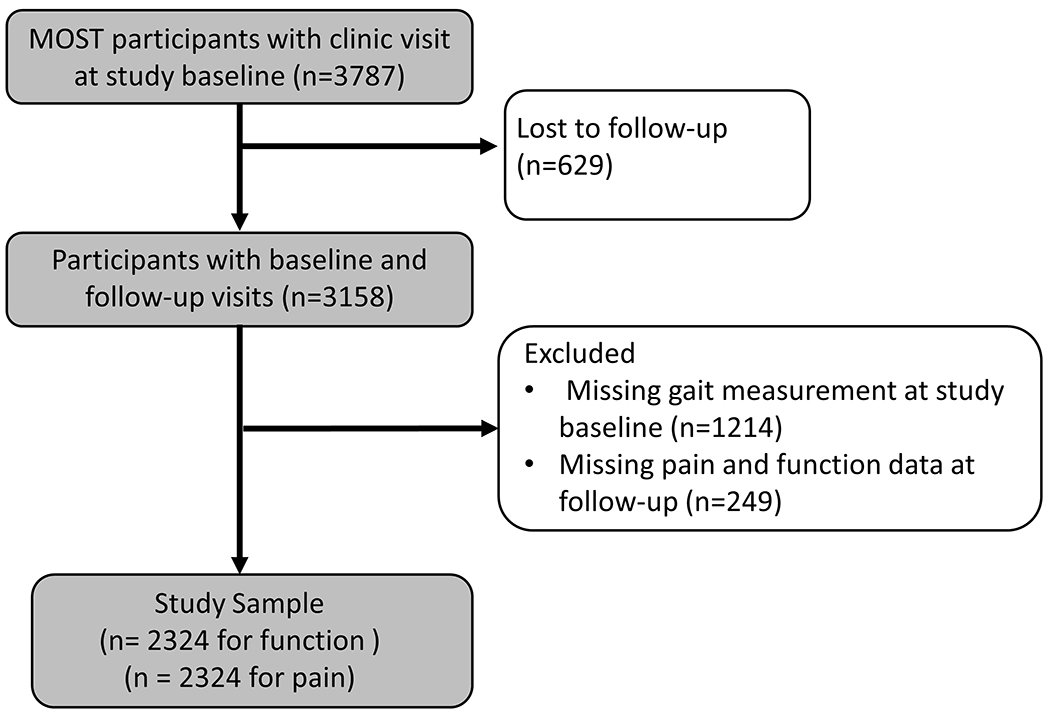
Selection of Participants for analysis dataset from MOST cohort
Gait parameters
A wearable inertial sensor system (OPAL, APDM Inc, Portland, OR, USA) was used to collect spatiotemporal gait measures during over-ground walking. Sensors were worn on their trunk and each ankle. Each sensor contains an accelerometer (±16 g), gyroscope (±2,000 degrees/second), and magnetometer (±8 Gauss) and measures 43.7 × 39.7 × 13.7 mm (length × width × height) and weighs approximately 25 grams. Participants completed two trials of a self-paced 20-meter walk test at baseline. Gait parameters available from the MOST database included spatiotemporal and other features that were extracted from the raw sensor data at the MOST Accelerometry Center. The data was processed in Matlab programs implementing published algorithms (see references included in Table 1). For each gait parameter, we used the mean of the two trials in the analyses.
Table 1.
Gait variables from the MOST database included in the machine learning models
| Variable | Explanation |
|---|---|
| Gait speed (m/s) | Total distance walked/total walking time |
| Cadence (steps/minute) | Number of steps taken per minute (47, 48) |
| Step Length (m) | Total distance walked/number of steps taken |
| Stride Time (s) | Mean duration of gait cycle (i.e., stride) |
| Step symmetry | Expresses the symmetry of the acceleration between left and right limbs(49, 50) |
| Gait asymmetry | Calculated as: 100* | ln(Right Swing Time / Left Swing Time)|. Values of 0.0 reflect perfect symmetry and higher values reflect greater degrees of asymmetry with a range of 0 to 57 (32) |
| Stride time coefficient of variation (CV) | Reflects the magnitude of the stride-to-stride variability of stride time(51) |
| Step regularity | Measure of regularity of the vertical acceleration measured from the trunk sensor between consecutive steps using autocorrelation. Low step regularity indicates that there is a low regularity between steps or a systematic asymmetry between left and right leg(49) |
| Stride regularity | Expresses the regularity of the vertical acceleration measured from the trunk sensor between consecutive strides using autocorrelation(49, 50) |
| Sample entropy | Entropy is a measure that quantifies regularity in time series: the more predictable and less complex a series is, the lower the entropy value(52, 53) |
| Phase coordination index (PCI) | A measure of bilateral coordination of gait assessed by quantifying the phase relationship between the step timing of the left and right legs(54) |
| Phase CV | Coefficient of variation of the phase (54) |
| Phase absolute difference | Measure of how close the phases are to 180° |
| Dominant frequency | Frequency with the largest amplitude in the power spectral density in the 0.5-3 Hz band of the vertical acceleration signal from the trunk sensor(37) |
| Amplitude of dominant frequency | The peak of the power spectral density of the vertical acceleration signal from the trunk sensor(37) |
| Width of dominant frequency | Width of the peak at half of its peak amplitude(37) |
| Lyapunov exponent (short divergent) | Estimate of local stability during gait(55) |
Pain and physical function
Participants completed the WOMAC Pain (range 0-20) for each knee and WOMAC Physical Function (range 0-68) surveys at baseline and follow-up visits, including interim phone interviews every 8 months (16). We defined pain and function worsening based on a minimal clinically important difference (MCID) for WOMAC Pain and Physical Function scores (17). Specifically, we defined pain worsening as an increase ≥ 2 points in ≥ 1 knee on the WOMAC Pain scale at two or more follow-up visits after 144m including phone interviews. We defined worsening physical function per person as an increase ≥ 4 on the WOMAC Function scale at two or more follow-up visits, including phone interviews. Knees with WOMAC Pain score of zero at baseline were eligible. Knees with WOMAC Pain scores of 18 or greater at baseline were not eligible since a score this high precluded further worsening. Participants with baseline WOMAC Function scores greater than 64 were not eligible.
Clinical and demographic features
We selected baseline measures that have previously been reported to be related to worsening pain or function (8, 18–20). These measures included age, sex, BMI, depressive symptoms, race, clinic site, and number of knees with radiographic OA. MOST has 2 sites and at one, Iowa, almost all participants are White, so separate covariate analyses of race is inherently confounded by clinic site. Rather than including these variables separately in the analysis, we therefore have created a variable with levels: Alabama(white), Alabama(black), Alabama(other), Iowa(white). Depressive symptoms were assessed using the Center for Epidemiological Studies Depression scale (CES-D)(21). Radiographic OA was defined as Kellgren-Lawrence grade ≥2 on a weight bearing posterior-anterior fixed flexion radiograph. Radiographs were not acquired for knees once the knee had developed Kellgren-Lawrence scores of 3 or greater or had a TKR. For these knees, Kellgren-Lawrence scores from the most recent radiograph exam were used.
Machine learning process for variable selection
Our goal was to identify gait characteristics associated with each of our outcomes, i.e., worsening knee pain or worsening physical function. As a first step towards this goal, we used an ensemble machine learning technique (“super learning”) as a feature reduction approach to identify important variables associated with the presence/absence of each outcome, separately (22, 23). Super learner uses a multi-fold cross-validation to select the optimal combination of algorithms that theoretically achieves an accuracy superior to any single machine learning method (23, 24). Our super learner configuration with 5-fold cross-validation included a stacked ensemble of the following individual algorithms appropriate for binomial outcomes while ensuring diverse learning approaches: discrete Bayesian additive regression trees, xgboost (extreme gradient boosting), generalized linear models (GLM) with convex penalties (that consisted of least absolute shrinkage and selection operator [LASSO], GLM ridge regression, and GLM elastic net, logistic regression, random forest(ranger: Fast(er) Random Forests),and support vector machine (used for the WOMAC function outcome analysis).
Variables included for possible selection by the super learning process included all person-based inertial sensor gait variables (Table 1), age, BMI, CES-D, sex, and radiographic OA status. For the outcome of worsening knee pain, we also included the baseline WOMAC knee pain score for the worse knee. Missing values were first imputed in the data used for the machine learning process, using multipleimputation by changed equations (MICE) and data were then randomly split into 70% training (development) and 30% test (evaluation) sets (25). To increase robustness, the random data split and model training and testing were repeated 100 times as part of the machine learning process (Supplement Figure, ML process ). We report the median area under the curve (AUC) and the 2.5th and 97.5th percentile AUC across the 100 iterations. Influential variables were selected from the ML process as the variables most frequently identified as contributing to the outcome prediction (i.e., pain worsening or function worsening) across the 100 iterations. During each iteration, a metric is calculated for each covariate which compares the risk without the covariate to the risk when it is included (“least square error” on each covariate). A higher difference value corresponds to a more important covariate. All covariates are ranked in a table at the end of each iteration. After 100 iterations we took the top 10 “most important” covariates from each iteration, then calculated the number of iterations in which each covariate was in the top 10 most influential covariates. (23).
Statistical analyses
We used separate log-binomial regression models for the pain and function worsening outcomes. We included the ten influential variables selected from machine learning as exposures while adjusting for potential confounders such as age, race, and radiographic OA status irrespective of whether they were identified as an influential predictor in the machine learning process. We also adjusted the baseline value of the outcome in each model. Continuous variables were standardized, so the resulting odds ratios should be interpreted as per 1 standard deviation increase of the predictor variable. We evaluated the model variables for collinearity by reviewing correlations, tolerance values, and variance inflation factors. We then adjusted the set of model variables as necessary to deal with collinearity by choosing variables to drop from the model and then retesting the collinearity diagnostics.
For the outcome worsening physical function over 2 years, we did additional mediation analyses with cadence during walking as the exposure (selected from the log-binomial regression) and worsening pain as the mediator. Mediation analyses were implemented using natural effects models with the R package medflex (26). The natural effects model decomposes a total effect on the outcome (worsening function) into a direct effect of an exposure variable (cadence) and an indirect effect through a mediator (worsening pain). Due to power considerations, we included only CES-D and age as covariates in the adjusted mediation analyses. We also tested for interaction between the exposure cadence and the mediator worsening pain.
Analyses were performed using SAS software version 9.4 and R version 4.0.2. Alpha level for significance set at <0.05 two sided. We followed the published guidelines for reporting on observational cohort studies from Strengthening the Reporting of Observational studies in Epidemiology (STROBE). The STROBE checklist is included with supplemental materials (Supplemental Checklist 1).
RESULTS
Our sample included 2324 participants with mean age over 60, most were women, and mean BMI was in the overweight category. (Table 2). In our cohort, 29% of the participants experienced worsening pain and 24% experienced worsening function over 2 years.
Table 2.
Cohort characteristics
| Characteristics at Baseline | Characteristic* | n |
|---|---|---|
|
| ||
| Age (years) | 63.6 (10.5) | 2320 |
|
| ||
| Sex (% Female) | 56.5 | 2324 |
|
| ||
| BMI (kg/m2) | 29 (5.5) | 2322 |
|
| ||
| Site and race (%) | ||
|
| ||
| Iowa | 56.3 | 1374 |
|
| ||
| Alabama (white) | 27.6 | 619 |
|
| ||
| Alabama (Black) | 14.6 | 300 |
|
| ||
| Alabama (other) | 1.44 | 28 |
|
| ||
| CES-D ( % >16) | 11.3% | |
|
| ||
| Radiographic knee OA (%) | ||
|
| ||
| None | 68.9 | 1552 |
|
| ||
| Unilateral | 13.4 | 299 |
|
| ||
| Bilateral | 17.7 | 378 |
|
| ||
| WOMAC function (range: 0-84) | 9.7(10.2) | 2324 |
|
| ||
| WOMAC pain (worse knee) (range: 0-20) | 3.0(3.2) | 2324 |
|
| ||
| Gait speed (meters per second) | 1.3 (0.2) | 2323 |
|
| ||
| Step Length (meters) | 0.65(0.09) | 2324 |
|
| ||
| Cadence (steps per minute) | 113.79(10.76) | 2324 |
|
| ||
| Dominant Frequency (Hz) | 1.89(0.17) | 2324 |
|
| ||
| Gait Asymmetry | 3.71(3.62) | 2324 |
|
| ||
| Step Regularity | 0.81(0.11) | 2324 |
|
| ||
| Step Symmetry | 0.97(0.09) | 2324 |
|
| ||
| Stride Time (sec) | 1.08(0.10) | 2324 |
|
| ||
| Stride Regularity | 0.84(0.10) | 2324 |
|
| ||
| Stride Time CV | 2.21(2.81) | 2324 |
|
| ||
| Characteristics Baseline (144m visit) to Follow-up (168m visit) | n | |
|
| ||
| WOMAC Function Change, 144m to 168m | ||
| Worsen (4+ points) | 568 | |
| No change by MCID | 1250 | |
| Improve ( −4 points change ) | 505 | |
|
| ||
| WOMAC Pain Change, 144m to 168m | ||
| Worsen (2+ points) | 675 | |
| No change by MCID | 1501 | |
| Improve (−2 points change ) | 148 | |
Mean (standard deviation) reported unless indicated otherwise.
BMI = Body Mass Index; CES-D = Center for Epidemiologic Studies Depression scale; OA = osteoarthritis; WOMAC = Western Ontario and McMaster Universities Osteoarthritis Index; CV = coefficient of variation
Machine learning for variable selection
For the worsening pain outcome, the median AUC was 0.61 (2.5th, 97.5th percentiles=0.57, 0.64). Influential gait parameters included dominant frequency, gait asymmetry, stride time CV, and step length (Table 3). Influential non-gait variables included depressive symptoms, radiographic OA, BMI, sex, and race/site. Supplemental table 1 shows the means for these predictors grouped by the worsening pain outcome.
Table 3.
Variable selected from machine learning and percentage of machine learning iterations where variables were among to 10 influential variables for the worsening pain and worsening function outcomes
| Worsening pain outcome | Worsening function outcome | |
|---|---|---|
| Depressive symptoms (CES-D) | 99 | 99 |
| Radiographic knee OA status | 90 | 89 |
| Baseline WOMAC pain value for worst knee | 81 | |
| Dominant Frequency | 37 | 71 |
| Step Regularity | 69 | |
| Race/site | 43 | 67 |
| Step Symmetry | 59 | |
| Stride Regularity | 59 | |
| Stride Mean Time | 57 | |
| Gait Asymmetry | 69 | |
| Stride Time CV | 52 | |
| Average Step Length | 42 | |
| Age | 55 | |
| Cadence | 40 | |
| Sex | 63 | |
| BMI | 60 |
CES-D = Center for Epidemiologic Studies Depression scale; OA = osteoarthritis; WOMAC = Western Ontario and McMaster Universities Osteoarthritis Index; CV = coefficient of variation; BMI = Body Mass Index;
For the worsening function outcome, the median AUC was 0.60 (2.5th, 97.5th percentiles=0.56, 0.63). Influential gait parameters included dominant frequency, step irregularity, step symmetry, stride regularity, and stride mean time (Table 3). Influential non-gait variables included age, depressive symptoms, radiographic OA, and race/site. Supplemental table 2 shows the means for these predictors grouped by the worsening function outcome.
Gait alterations related to worsening pain and to worsening function
After adjusting for confounders, greater gait asymmetry, longer average step length, and lower dominant frequency (Table 4) were associated with worsening knee pain. Multicollinearity was not evident. After similar adjustment, lower cadence (Table 5) was associated with worsening function. In the latter model, dominant frequency was excluded due to evidence of collinearity with other variables in the model. Supplemental tables 3 and 4 show results stratified by OA status.
Table 4.
Association of worsening pain over 2 years with gait measures chosen by ensemble machine learning
| Parameters | Unadjusted odds ratio (95% CI) |
Adjusted odds ratio (95% CI) |
|---|---|---|
| Gait Asymmetry | 1.09(1.03-1.15) | 1.08(1.02-1.12) |
| Stride Time Coefficient of Variation (CV) | 1.00(0.93-1.05) | 1.01(0.93-1.05) |
| Step Length | 0.93(0.87-0.99) | 1.08(1.00-1.15) |
| Dominant Frequency | 0.92(0.87-0.98) | 0.92(0.87-0.99) |
Notes
All continuous variables are standardized: Gait symmetry, Stride Time CV, Average Step Length, Dominant Frequency, CES-D, and BMI. Odds ratios should be interpreted as applying to a 1-stdev change in the predictor.
Unadjusted model including only gait variables, listed above (n=2324)
Adjusted model includes the gait variables shown, plus baseline WOMAC pain value for worst knee, CES-D, OA status, sex, BMI, site and race. (n=2238, cases=654)
Table 5.
Association of worsening physical function over 2 years with gait measures chosen by ensemble machine learning
| Parameters | Unadjusted odds ratio (95% CI) |
Adjusted odds ratio (95% CI) |
|---|---|---|
| Cadence | 0.85(0.73-1.01) | 0.84(0.72-1.00) |
| Step Regularity | 1.29(0.81-2.06) | 1.40(0.78-2.65) |
| Step Symmetry | 0.82(0.62-1.09) | 0.78(0.52-1.13) |
| Stride Regularity | 0.73(0.50-1.13) | 0.77(0.44-1.34) |
| Stride Time | 0.92(0.78-1.11) | 0.89(0.75-1.06) |
Notes
All continuous variables are standardized: Cadence, Step Irregularity, Step Symmetry, Stride Regularity, Stride Mean Time, CES-D, age. Odds ratios should be interpreted as applying to a 1-stdev change in the predictor.
Unadjusted model including only gait variables, listed above (n=2324)
Adjusted model includes the gait variables shown, plus baseline WOMAC function value, CES-D, OA status, sex, BMI, site and race. (n=2226, cases=542). Dominant frequency variable was dropped from the model due to collinearity concerns.
In mediation analyses, we found that worsening pain partially mediated the association of cadence with worsening function, although it was less than 50% of the total effect. The natural direct effect of cadence on worsening function had an odds ratio of 0.93(95% confidence interval 0.85, 1.01), while the natural indirect effect of cadence on worsening function, mediated through worsening pain, had an odds ratio of 0.96 (95% confidence interval 0.92, 1.00). This remained true when covariates CES-D and age were included in the mediation models. We found no evidence of interaction between the cadence exposure and the worsening pain mediator.
DISCUSSION
In our study of wearable sensor derived gait measures from a large cohort of people with and without knee OA, we identified gait parameters related to worsening pain and those related to worsening physical function over two years. Walking with greater asymmetry, longer step length, and lower dominant frequency were related to worsening pain over two years. Walking with lower cadence was related to worsening physical function over two years. Although part of the association of cadence with worsening function may be mediated by worsening pain, this indirect pathway through pain appears to be less than half of the total effect of cadence on worsening function. While these findings suggest that gait alterations are related to worsening pain and physical function in people with knee OA, whether targeting these gait parameters can influence pain or function, and whether it is possible to change these gait parameters to a sufficiently large extent to influence the trajectory of decline, requires further study.
Our findings suggest that gait asymmetry, in addition to longer step length, and lower dominant frequency, are related to increased odds of worsening knee pain over two years. Previous studies examining gait symmetry in people with knee OA have been cross sectional with small samples. They provide inconsistent findings about the association of gait asymmetry with pain with both presence and absence of gait asymmetry being reported among those with knee OA for spatiotemporal, ground reaction force (GRF), kinematic, or kinetic gait variables (27–30). Using data from MOST, a recent longitudinal study reported that asymmetry in stance, single-limb support, or double-limb support times was not related to unilateral knee pain cross-sectionally, but that some measures of asymmetry were related to changes in contralateral knee pain over two years (31). Our gait symmetry measure was calculated from right and left swing times and reflects temporal asymmetry. Prior work has shown that older adults at risk of falls and individuals with Parkinson’s Disease walk with higher gait asymmetry (as calculated in our study) and gait asymmetry increases with walking is challenged with dual-task demands in these groups but not in healthy adults (32). Longer step length is also related to greater knee loading (i.e., knee contact forces or knee joint moments) which may explain its relation to pain worsening (33, 34). Interventions to reduce step/stride length have been proposed for people with knee OA (35, 36). Dominant frequency is closely tied to step duration and cadence; lower dominant frequency reflects greater step duration and lower cadence (37). So individuals who spend more time with each step will have a lower dominant frequency. Lower dominant frequency of walking has been previously associated with Parkinson’s disease and lower amplitude of the dominant frequency is related to both Parkinson’s disease and fall risk in older adults, when compared to controls (37–41). Our findings suggest that lower dominant frequency may also be a feature of gait in people with knee OA and is related to worsening knee pain.
We observed that lower cadence was related to increased odds of worsening physical function. Lower cadence has been reported to be related to an increase risk of cartilage damage in the knee (6). Meta-analysis of published studies reported lower gait speed, a measure closely related to lower cadence, as being related to risk of worsening physical function in people with knee OA (8). In people with hip OA who received a biomechanical intervention, increases in cadence were related to improved WOMAC Function scores (42). Cadence can itself be considered a measure of physical function, which may be one reason for the observed association, although our focus was on reported and not measured function.
It is worth noting that the while measures of knee loading during walking (e.g., peak knee adduction moment, knee adduction moment impulse, joint contact forces) are known to be related to greater risk of structural worsening of knee OA (3), the relation of these measures with OA symptoms is small and inconsistent in the literature (43). Given that these prior studies have been primarily cross-sectional, our study provides important longitudinal evidence in support of a relation between gait and changes in OA symptoms. However, the gait features identified in our study, i.e., gait asymmetry, step length, dominant frequency, and cadence, are only indirectly related to knee loading.
Some gait measures were related to worsening pain but not worsening function. Specifically, gait asymmetry and step length were associated with pain but not physical function, whereas lower dominant frequency (reflecting lower cadence) and lower cadence were related to both outcomes. These differences could be due to an artifact of the machine learning process given slight differences in variables included in the model and handling of missingness. We chose to select only the top ten influential predictors from the machine learning model (44). Gait variables not selected could still be causally related to the outcome but did not appear in top ten. For example. in the machine learning process for the function outcome, the next three variables were BMI, gait asymmetry, and step length. Lastly, persons affected by disease or pain find strategies to perform needed tasks, often without limitations. It is only when impairments from pain and disease foreclose multiple strategies that they report limitations in carrying out these tasks and they experience worsening function. That may explain why only some gait variables affect both pain and function. Further, we studied gait variables only at the beginning of the study and participants may have changed their gait asymmetry and step length at the follow-up minimizing their effects on function.
We observed AUCs of ~ 0.60 for prediction of worsening pain and worsening function with the super-learning approach, indicating performance which is better than random prediction in our model. . Most previous studies have focused on prediction of structural worsening or risk of knee replacement making comparison of our results with prior studies challenging. Using data from the Osteoarthritis Initiative (OAI), Halilaj et al. identified stable, worsening, and improving trajectories of knee pain over eight years (45). Their machine learning model using baseline clinical, demographic, and radiographic data predicted worsening vs. stable participants with an AUC of 0.76. Important predictive variables included baseline WOMAC scores, radiographic information, depressive symptoms, among others. These variables are similar to the ones that were selected as influential in our model. The difference in model accuracy may be due to differences in variables included as well as the longer duration of follow-up in the previous study. To our knowledge, there are no currently available datasets that include the measures that we had available in MOST for an external validation of our machine learning model. However, if this model could be validated, it could serve as a potential tool for identifying individuals who may be at risk of worsening pain and/or physical function.
Our study further provides important information on potentially modifiable gait measures related to worsening pain. Our findings also provide novel information on gait measures related to worsening physical function in this population. While our study identified several gait features that could be targeted in future interventions, it is likely that targeting any one feature would positively influence the others given their biological inter-relationships. For instance, interventions to increase cadence could reduce step length and increase dominant frequency (46). While this would need to be examined in future studies, our work identifying multiple important gait features provides avenues for further discovery in this area.
Among limitations to our study is that our minimal important change cutoff for pain and function worsening may miss more subtle changes in pain or function or fail to register severe worsening. We also acknowledge that the outcome, worsening function or pain, is not merely the opposite of improvement those areas, and further work is needed to identify characteristics which may be associated with improvement. In addition, residual confounding from other causes of worsening pain or function may exist. Other approaches to select influential predictors from machine learning and then determine associations may yield different results. Currently, there isn’t a consensus in the field on these approaches.
To conclude, we found that greater gait asymmetry, longer step length, and lower dominant frequency were related to worsening knee pain over two years and lower cadence was associated with worsening physical function. Through mediation analyses we found that worsening knee pain may be responsible for part of the association of gait features with functional decline. Our findings suggest that alterations in gait could be used to identify individuals at risk of pain or function worsening. These findings also suggest that gait alterations could be therapeutically targeted with the goal of preventing worsening pain or function.
Supplementary Material
SIGNIFICANCE AND INNOVATION.
We identified gait alterations related to worsening pain and those related to worsening function, using wearable-sensor gait data and machine learning in a large observational cohort of individuals with, or at risk of, knee osteoarthritis.
Our findings are aligned with prior reports on the relation of gait measures (e.g., cadence) with worsening structural outcomes in people with knee OA
Measures identified in our work may be more robust to confounding than prior work and may be easily assessed in clinical settings using wearable sensors
FUNDING SOURCE:
MOST is composed of four cooperative grants (DTF (BU)—AG18820, J.C. Torner (UI)—AG18832, CEL (UAB)—AG18947, and MCN (UCSF)—AG19069] funded by the National Institutes of Health (NIH), a branch of the Department of Health and Human Services, and conducted by MOST study investigators. Sponsors and Collaborators for MOST: University of California, San Francisco; University of Iowa; University of Alabama at Birmingham; Boston University; National Institute on Aging (NIA). Research reported in this publication was also supported under award numbers P30 AR0702571 (DTF) R21AR074578 (SRJ), R03AG060272 (S.R. Jafarzadeh), R01HL159620 (VBK), R21CA253498 (VBK), and K01 AR06972 (DK) from the National Institutes of Health and 20SFRN35460031 (VBK) from the American Heart Association. KLB was also supported by an Investigator Award from the Rheumatology Research Foundation. The National Institutes of Health, the American Heart Association, and the Rheumatology Research Foundation were not involved in study design, collection, analysis or interpretation of data, or the decision to submit this manuscript for publication.
ETHICS COMMITTEE APPROVAL : INSTITUTIONAL REVIEW BOARD STATEMENT
MOST has been conducted in accordance with U.S. Department of Health and Human Services Protection of Human Subjects regulations(45 CFR part 46) and the Privacy Rule of the Health Insurance Portability and Accountability Act (HIPAA) of 1996. Research data and image sets are de-identified in accordance with regulation 45 CFR 164.514(e). Study participants were recruited under local institutional review board (IRB) approval through the collaborating institutions: grant AG18820, Boston University IRB FWA00000301; grant AG18832 University of Iowa IRB FWA00003007; grant AG18947 University of Alabama at Birmingham IRB FWA00005960; grant AG19069 University of California at San Francisco IRB FWA00000068.
All participants underwent an informed consent process approved by the Institutional Review Board Committee on Human Research at the participating institutions as listed above. Written consent is obtained from all participants at the beginning of a clinic visit at the clinical center. The consent covers all data collection scheduled for each grant cycle. Verbal consent is obtained for telephone interviews. Participants give written permission for clinical centers to obtain medical records needed for documentation of joint replacement surgery. There were no participants under age 16.
DATA SHARING
Data from the Multicenter Osteoarthritis Study (MOST) is publicly available at the National Institute on Aging, Aging Research Biobank at: https://agingresearchbiobank.nia.nih.gov/studies/most/
REFERENCES
- 1.Vos T, Lim SS, Abbafati C, Abbas KM, Abbasi M, Abbasifard M, et al. Global burden of 369 diseases and injuries in 204 countries and territories, 1990-2019: a systematic analysis for the Global Burden of Disease Study 2019. The Lancet. 2020;396(10258):1204–22. [DOI] [PMC free article] [PubMed] [Google Scholar]
- 2.Kolasinski SL, Neogi T, Hochberg MC, Oatis C, Guyatt G, Block J, et al. 2019 American College of Rheumatology/Arthritis Foundation Guideline for the Management of Osteoarthritis of the Hand, Hip, and Knee. Arthritis Rheumatol. 2020;72(2):220–33. [DOI] [PMC free article] [PubMed] [Google Scholar]
- 3.D’Souza N, Charlton J, Grayson J, Kobayashi S, Hutchison L, Hunt M, et al. Are biomechanics during gait associated with the structural disease onset and progression of lower limb osteoarthritis? A systematic review and meta-analysis. Osteoarthritis Cartilage. 2022;30(3):381–94. [DOI] [PubMed] [Google Scholar]
- 4.Miyazaki T, Wada M, Kawahara H, Sato M, Baba H, Shimada S. Dynamic load at baseline can predict radiographic disease progression in medial compartment knee osteoarthritis. Annals of the rheumatic diseases. 2002;61(7):617–22. [DOI] [PMC free article] [PubMed] [Google Scholar]
- 5.Wink AE, Gross KD, Brown CA, Guermazi A, Roemer F, Niu J, et al. Varus thrust during walking and the risk of incident and worsening medial tibiofemoral MRI lesions: the Multicenter Osteoarthritis Study. Osteoarthritis and cartilage. 2017;25(6):839–45. [DOI] [PMC free article] [PubMed] [Google Scholar]
- 6.Hart HF, Gross KD, Crossley KM, Barton CJ, Felson DT, Guermazi A, et al. Step Rate and Worsening of Patellofemoral and Tibiofemoral Joint Osteoarthritis in Women and Men: The Multicenter Osteoarthritis Study. Arthritis Care Res (Hoboken). 2020;72(1):107–13. [DOI] [PMC free article] [PubMed] [Google Scholar]
- 7.Deveza LA, Melo L, Yamato TP, Mills K, Ravi V, Hunter DJ. Knee osteoarthritis phenotypes and their relevance for outcomes: a systematic review. Osteoarthritis Cartilage. 2017;25(12):1926–41. [DOI] [PubMed] [Google Scholar]
- 8.de Rooij M, van der Leeden M, Heymans MW, Holla JF, Häkkinen A, Lems WF, et al. Prognosis of Pain and Physical Functioning in Patients With Knee Osteoarthritis: A Systematic Review and Meta-Analysis. Arthritis Care Res (Hoboken). 2016;68(4):481–92. [DOI] [PubMed] [Google Scholar]
- 9.Kobsar D, Masood Z, Khan H, Khalil N, Kiwan MY, Ridd S, et al. Wearable inertial sensors for gait analysis in adults with osteoarthritis—a scoping review. Sensors. 2020;20(24):7143. [DOI] [PMC free article] [PubMed] [Google Scholar]
- 10.Rose MJ, Costello KE, Eigenbrot S, Torabian K, Kumar D. Inertial measurement units and application for remote health care in hip and knee osteoarthritis: Narrative review. JMIR Rehabilitation and Assistive Technologies. 2022;9(2):e33521. [DOI] [PMC free article] [PubMed] [Google Scholar]
- 11.Boekesteijn RJ, van Gerven J, Geurts ACH, Smulders K. Objective gait assessment in individuals with knee osteoarthritis using inertial sensors: A systematic review and meta-analysis. Gait Posture. 2022;98:109–20. [DOI] [PubMed] [Google Scholar]
- 12.Gao C, Sun H, Wang T, Tang M, Bohnen NI, Müller ML, et al. Model-based and Model-free Machine Learning Techniques for Diagnostic Prediction and Classification of Clinical Outcomes in Parkinson’s Disease. Scientific reports. 2018;8(1):7129. [DOI] [PMC free article] [PubMed] [Google Scholar]
- 13.Ricotti V, Kadirvelu B, Selby V, Festenstein R, Mercuri E, Voit T, et al. Wearable full-body motion tracking of activities of daily living predicts disease trajectory in Duchenne muscular dystrophy. Nat Med. 2023;29(1):95–103. [DOI] [PMC free article] [PubMed] [Google Scholar]
- 14.Bernad-Elazari H, Herman T, Mirelman A, Gazit E, Giladi N, Hausdorff JM. Objective characterization of daily living transitions in patients with Parkinson’s disease using a single body-fixed sensor. Journal of neurology. 2016;263(8):1544–51. [DOI] [PubMed] [Google Scholar]
- 15.Hannink J, Kautz T, Pasluosta CF, Gaßmann K-G, Klucken J, Eskofier BM. Sensor-based gait parameter extraction with deep convolutional neural networks. IEEE journal of biomedical and health informatics. 2017;21(1):85–93. [DOI] [PubMed] [Google Scholar]
- 16.Bellamy N, Buchanan WW, Goldsmith CH, Campbell J, Stitt LW. Validation study of WOMAC: a health status instrument for measuring clinically important patient relevant outcomes to antirheumatic drug therapy in patients with osteoarthritis of the hip or knee. Journal of rheumatology. 1988. [PubMed] [Google Scholar]
- 17.Angst F, Benz T, Lehmann S, Aeschlimann A, Angst J. Multidimensional minimal clinically important differences in knee osteoarthritis after comprehensive rehabilitation: a prospective evaluation from the Bad Zurzach Osteoarthritis Study. RMD open. 2018;4(2):e000685. [DOI] [PMC free article] [PubMed] [Google Scholar]
- 18.Felson DT, Niu J, Quinn EK, Neogi T, Lewis CL, Lewis CE, et al. Multiple Nonspecific Sites of Joint Pain Outside the Knees Develop in Persons With Knee Pain. Arthritis Rheumatol. 2017;69(2):335–42. [DOI] [PMC free article] [PubMed] [Google Scholar]
- 19.Bacon KL, Felson DT, Jafarzadeh SR, Kolachalama VB, Hausdorff JM, Gazit E, et al. Relation of gait measures with mild unilateral knee pain during walking using machine learning. Scientific Reports. 2022;12(1):22200. [DOI] [PMC free article] [PubMed] [Google Scholar]
- 20.Bacon KL, Segal NA, Øiestad BE, Lewis CE, Nevitt MC, Brown C, et al. Concurrent change in quadriceps strength and physical function over 5 years in The Multicenter Osteoarthritis Study. Arthritis care & research. 2018. [DOI] [PMC free article] [PubMed] [Google Scholar]
- 21.Radloff LS. The CES-D scale: A self-report depression scale for research in the general population. Applied psychological measurement. 1977;1(3):385–401. [Google Scholar]
- 22.Van der Laan MJ, Rose S. Targeted learning: causal inference for observational and experimental data: Springer Science & Business Media; 2011. [Google Scholar]
- 23.Coyle JR, Hejazi NS, Malenica I, Sofrygin O. sl3: Pipelines for Machine Learning and {Super Learning. doi: 10.5281/zenodo.1342293. 2021. p. R package version 1.4.2. https://github.com/tlverse/sl3. [DOI] [Google Scholar]
- 24.Wolpert DH. Stacked generalization. Neural networks. 1992;5(2):241–59. [Google Scholar]
- 25.van Buuren S, Groothuis-Oudshoorn K. mice: Multivariate Imputation by Chained Equations in R. Journal of Statistical Software. 2011;45(3):1–67. [Google Scholar]
- 26.Steen J, Loeys T, Moerkerke B, Vansteelandt S. Medflex: an R package for flexible mediation analysis using natural effect models. Journal of Statistical Software. 2017;76:1–46.36568334 [Google Scholar]
- 27.Mills K, Hettinga BA, Pohl MB, Ferber R. Between-limb kinematic asymmetry during gait in unilateral and bilateral mild to moderate knee osteoarthritis. Arch Phys Med Rehabil. 2013;94(11):2241–7. [DOI] [PubMed] [Google Scholar]
- 28.Creaby MW, Bennell KL, Hunt MA. Gait differs between unilateral and bilateral knee osteoarthritis. Arch Phys Med Rehabil. 2012;93(5):822–7. [DOI] [PubMed] [Google Scholar]
- 29.Liikavainio T, Isolehto J, Helminen HJ, Perttunen J, Lepola V, Kiviranta I, et al. Loading and gait symmetry during level and stair walking in asymptomatic subjects with knee osteoarthritis: importance of quadriceps femoris in reducing impact force during heel strike? The Knee. 2007;14(3):231–8. [DOI] [PubMed] [Google Scholar]
- 30.Kobsar D, Barden JM, Clermont C, Wilson JLA, Ferber R. Sex differences in the regularity and symmetry of gait in older adults with and without knee osteoarthritis. Gait Posture. 2022;95:192–7. [DOI] [PubMed] [Google Scholar]
- 31.Corrigan P, Felson DT, Lewis CL, Neogi T, LaValley MP, Gross KD, et al. Relation of temporal asymmetry during walking to 2-year knee pain outcomes in those with mild-to-moderate unilateral knee pain: an exploratory analysis from the Multicenter Osteoarthritis (MOST) Study. Arthritis Care Res (Hoboken). 2022. [Google Scholar]
- 32.Yogev G, Plotnik M, Peretz C, Giladi N, Hausdorff JM. Gait asymmetry in patients with Parkinson’s disease and elderly fallers: when does the bilateral coordination of gait require attention? Experimental brain research. 2007;177(3):336–46. [DOI] [PubMed] [Google Scholar]
- 33.DeVita P, Rider P, Hortobágyi T. Reductions in knee joint forces with weight loss are attenuated by gait adaptations in class III obesity. Gait & posture. 2016;45:25–30. [DOI] [PubMed] [Google Scholar]
- 34.Lyle MA, Jensen JC, Hunnicutt JL, Brown JJ, Chambliss CP, Newsome MA, et al. Associations of Strength and Spatiotemporal Gait Variables With Knee Loading During Gait After Anterior Cruciate Ligament Reconstruction. J Athl Train. 2022;57(2):158–64. [DOI] [PMC free article] [PubMed] [Google Scholar]
- 35.Edd SN, Bennour S, Ulrich B, Jolles BM, Favre J. Modifying Stride Length in Isolation and in Combination With Foot Progression Angle and Step Width Can Improve Knee Kinetics Related to Osteoarthritis; A Preliminary Study in Healthy Subjects. J Biomech Eng. 2020;142(7). [DOI] [PubMed] [Google Scholar]
- 36.Milner CE, Meardon SA, Hawkins JL, Willson JD. Walking velocity and step length adjustments affect knee joint contact forces in healthy weight and obese adults. J Orthop Res. 2018;36(10):2679–86. [DOI] [PubMed] [Google Scholar]
- 37.Weiss A, Sharifi S, Plotnik M, van Vugt JPP, Giladi N, Hausdorff JM. Toward Automated, At-Home Assessment of Mobility Among Patients With Parkinson Disease, Using a Body-Worn Accelerometer. Neurorehabilitation and Neural Repair. 2011;25(9):810–8. [DOI] [PubMed] [Google Scholar]
- 38.Weiss A, Brozgol M, Dorfman M, Herman T, Shema S, Giladi N, et al. Does the Evaluation of Gait Quality During Daily Life Provide Insight Into Fall Risk? A Novel Approach Using 3-Day Accelerometer Recordings. Neurorehabilitation and Neural Repair. 2013;27(8):742–52. [DOI] [PubMed] [Google Scholar]
- 39.Rispens SM, van Schooten KS, Pijnappels M, Daffertshofer A, Beek PJ, van Dieën JH. Identification of Fall Risk Predictors in Daily Life Measurements:Gait Characteristics’ Reliability and Association With Self-reported Fall History. Neurorehabilitation and Neural Repair. 2015;29(1):54–61. [DOI] [PubMed] [Google Scholar]
- 40.Weiss A, Herman T, Giladi N, Hausdorff JM. Objective Assessment of Fall Risk in Parkinson’s Disease Using a Body-Fixed Sensor Worn for 3 Days. PLOS ONE. 2014;9(5):e96675. [DOI] [PMC free article] [PubMed] [Google Scholar]
- 41.Evers LJ, Raykov YP, Krijthe JH, Silva de Lima AL, Badawy R, Claes K, et al. Real-Life Gait Performance as a Digital Biomarker for Motor Fluctuations: The Parkinson@Home Validation Study. J Med Internet Res. 2020;22(10):e19068. [DOI] [PMC free article] [PubMed] [Google Scholar]
- 42.Solomonow-Avnon D, Herman A, Levin D, Rozen N, Peled E, Wolf A. Positive outcomes following gait therapy intervention for hip osteoarthritis: A longitudinal study. Journal of Orthopaedic Research. 2017;35(10):2222–32. [DOI] [PubMed] [Google Scholar]
- 43.Hutchison L, Grayson J, Hiller C, D’Souza N, Kobayashi S, Simic M. Relationship Between Knee Biomechanics and Pain in People With Knee Osteoarthritis: A Systematic Review and Meta-Analysis. Arthritis Care Res (Hoboken). 2023;75(6):1351–61. [DOI] [PubMed] [Google Scholar]
- 44.Costello KE, Felson DT, Jafarzadeh SR, Guermazi A, Roemer FW, Segal NA, et al. Gait, physical activity and tibiofemoral cartilage damage: a longitudinal machine learning analysis in the Multicenter Osteoarthritis Study. British Journal of Sports Medicine. 2023. [DOI] [PMC free article] [PubMed] [Google Scholar]
- 45.Halilaj E, Le Y, Hicks JL, Hastie TJ, Delp SL. Modeling and predicting osteoarthritis progression: data from the osteoarthritis initiative. Osteoarthritis Cartilage. 2018;26(12):1643–50. [DOI] [PMC free article] [PubMed] [Google Scholar]
- 46.Anderson LM, Martin JF, Barton CJ, Bonanno DR. What is the Effect of Changing Running Step Rate on Injury, Performance and Biomechanics? A Systematic Review and Meta-analysis. Sports Medicine - Open. 2022;8(1):112. [DOI] [PMC free article] [PubMed] [Google Scholar]
- 47.Slaght J, Sénéchal M, Hrubeniuk T, Mayo A, Bouchard D. Walking cadence to exercise at moderate intensity for adults: a systematic review. Journal of Sports Medicine. 2017;2017. [DOI] [PMC free article] [PubMed] [Google Scholar]
- 48.Peacock L, Hewitt A, Rowe DA, Sutherland R. Stride rate and walking intensity in healthy older adults. Journal of aging and physical activity. 2014;22(2):276–83. [DOI] [PubMed] [Google Scholar]
- 49.Moe-Nilssen R, Helbostad JL. Estimation of gait cycle characteristics by trunk accelerometry. Journal of biomechanics. 2004;37(1):121–6. [DOI] [PubMed] [Google Scholar]
- 50.Tura A, Raggi M, Rocchi L, Cutti AG, Chiari L. Gait symmetry and regularity in transfemoral amputees assessed by trunk accelerations. Journal of neuroengineering and rehabilitation. 2010;7(1):1–10. [DOI] [PMC free article] [PubMed] [Google Scholar]
- 51.Hausdorff JM. Gait dynamics in Parkinson’s disease: Common and distinct behavior among stride length, gait variability, and fractal-like scaling. Chaos. 2009;19(2):026113. [DOI] [PMC free article] [PubMed] [Google Scholar]
- 52.Torres BDLC López MS, Cachadiña ES Orellana JN. Entropy in the analysis of gait complexity: A state of the art. British Journal of Applied Science & Technology. 2013;3(4):1097. [Google Scholar]
- 53.Ramdani S, Seigle B, Lagarde J, Bouchara F, Bernard PL. On the use of sample entropy to analyze human postural sway data. Medical engineering & physics. 2009;31(8):1023–31. [DOI] [PubMed] [Google Scholar]
- 54.Plotnik M, Giladi N, Hausdorff JM. A new measure for quantifying the bilateral coordination of human gait: effects of aging and Parkinson’s disease. Experimental brain research. 2007;181(4):561–70. [DOI] [PubMed] [Google Scholar]
- 55.Bruijn SM, Bregman DJ, Meijer OG, Beek PJ, van Dieën JH. Maximum Lyapunov exponents as predictors of global gait stability: a modelling approach. Medical engineering & physics. 2012;34(4):428–36. [DOI] [PubMed] [Google Scholar]
Associated Data
This section collects any data citations, data availability statements, or supplementary materials included in this article.
Supplementary Materials
Data Availability Statement
Data from the Multicenter Osteoarthritis Study (MOST) is publicly available at the National Institute on Aging, Aging Research Biobank at: https://agingresearchbiobank.nia.nih.gov/studies/most/