Abstract
Sterile inflammation, also known as “inflammaging”, is a hallmark of tissue aging. Cellular senescence contributes to tissue aging in part through the secretion of proinflammatory factors known as the senescence-associated secretory phenotype (SASP). Thioredoxin reductase 1 (TXNRD1) genetic variability is associated with aging and age-associated phenotypes such as late-life survival, activity of daily living, and physical performance at old age. TXNRD1’s role in regulating tissue aging has been attributed to its enzymatic role in regulating cellular redox. Here we show that TXNRD1 drives the SASP and inflammaging through the cyclic GMP-AMP synthase (cGAS)-stimulator of interferon genes (STING) innate immune response pathway independently of its enzymatic activity. TXNRD1 localizes to cytoplasmic chromatin fragments and interacts with cGAS in a senescence status dependent manner, which is necessary for the SASP. TXNRD1 enhances the enzymatic activity of cGAS. TXNRD1 is required for both the tumor-promoting and immune-surveillance functions of senescent cells, which are mediated by the SASP in vivo in mouse models. Treatment of aged mice with a TXNRD1 inhibitor that disrupts its interaction with cGAS, but not an inhibitor of its enzymatic activity alone, downregulated markers of inflammaging in several tissues. In summary, our results report TXNRD1 promotes the SASP via the innate immune response with implication in inflammaging. This suggests that TXNRD1 and cGAS interaction is a relevant target for selectively suppressing inflammaging.
Cellular senescence is a stable growth arrest in response to various stresses including activation of oncogenes such as RAS, critically shortened telomeres induced by extensive cell passaging, and cancer therapeutics such as cisplatin or etoposide1,2. A defining characteristic of senescent cells is the secretion of a mix of factors termed the senescence-associated secretory phenotype (SASP), comprised of pro-inflammatory cytokines, chemokines, growth factors and other components1,2. The induction of cytoplasmic chromatin fragments (CCFs) plays a critical role in driving the SASP3–6. Senescence contributes to tissue aging and age-associated diseases1. SASP components fulfill many functions, but are classically associated with chronic inflammation, a hallmark of aging1,7,8. Thioredoxin reductases (TXNRDs) play a central role in cellular redox regulation, thereby suppressing oxidative stress9. In mammals, there are three isoforms of TXNRDs, namely cytosolic TXNRD1, mitochondrial TXNRD2 and testis specific TXNRD39. Genetic variabilities of TXNRD1 correlated with functional activities at very old age10–13. Lower expression of TXNRD1 was associated with frailty14, a geriatric syndrome characterized by diminished functional reserve and increased vulnerability to low power stressors15. It is assumed that the role of TXNRD1 in tissue aging is linked to its enzymatic activity because oxidative damage contributes to tissue aging and inflammation16.
Results
TXNRD1 localizes to CCFs to promote the cGAS-STING signaling
We purified CCFs and performed LC-MS/MS analysis in control and oncogenic RASG12V-induced senescent (OIS) IMR90 embryonic human lung fibroblasts (Extended Data Fig. 1a–d). This analysis identified 512 proteins that are enriched in CCFs (>5-fold in two biologically independent experiments) (Supplementary Table 1). Pathway analysis with DAVID revealed enrichment of 15 domains (FDR<10%, at least 2-fold enrichment, at least 10 proteins) with two being thioredoxin-related (Fig. 1a and Extended Data Fig. 1e). Given the implication of TXNRD1 in tissue aging10–14 and the critical role it plays in the thioredoxin pathway9, we chose TXNRD1 for validation. We observed that TXNRD1 is present in purified CCFs and is localized into CCFs (Fig. 1b–d). Similar observations were made in both OIS and replicative senescent (RS) IMR90 cells (Extended Data Fig. 2a–c), OIS BJ primary human fibroblasts (Extended Data Fig. 2d–e) and cisplatin-induced senescent ovarian cancer PEO1 cells (Supplementary Fig. 1). TXNRD1 is downregulated at protein and mRNA levels during both OIS and RS (Fig. 1e and Supplementary Fig. 2), which indicates that localization of TXNRD1 into CCFs is not due to TXNRD1 upregulation.
Figure 1: TXNRD1 localizes into CCFs and is required for cGAS-STING activation during senescence.
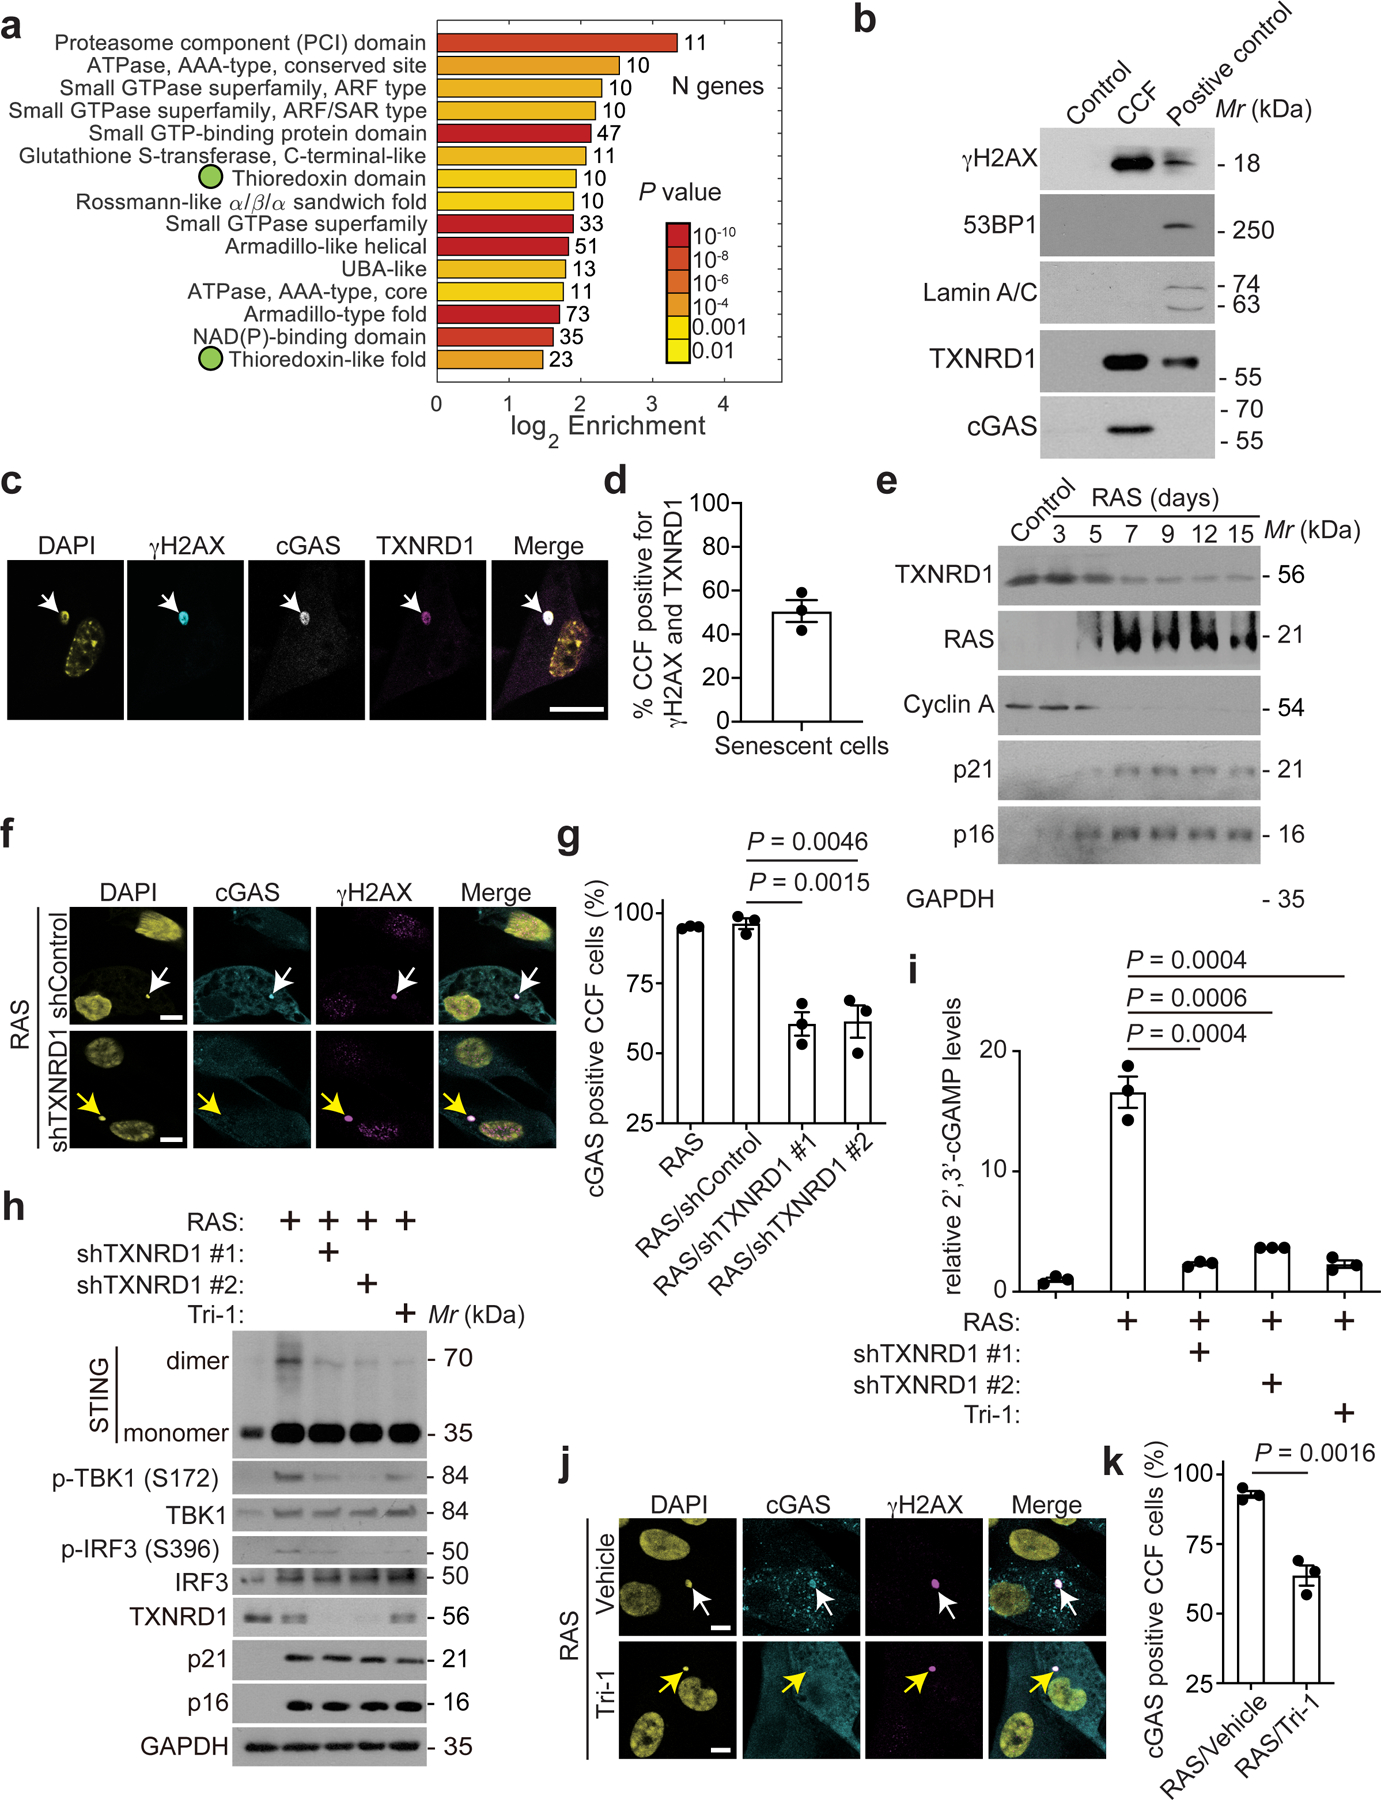
a, The top 15 domains enriched by CCFs proteins isolated from oncogenic RAS-induced senescent IMR90 cells. Two green dots indicate thioredoxin-related domains.
b, Immunoblot of the indicated proteins in CCFs isolated from oncogenic RAS-induced IMR90 cells. Proliferating cells having gone through the same purification procedure was used as a negative control. Whole cell lysate from etoposide induced senescent IMR90 cells was used as a positive control.
c,d, Immunostaining of the indicated proteins in oncogenic RAS-induced senescent IMR90 cells (c). The arrow indicates an example of γH2AX, cGAS and TXNRD1 co-localized CCFs. CCFs that are positive for γH2AX and also positive for TXNRD1 were quantified (d). Scale bar = 10 μm.
e, Immunoblot of the indicated proteins in control proliferating and oncogenic RAS-induced senescent cells IMR90 cells harvested at the indicated time points.
f,g, Immunostaining for cGAS and γH2AX in oncogenic RAS-induced senescent IMR90 cells with or without TXNRD1 knockdown (f). White arrow indicates an example of cGAS and γH2AX positive CCFs in control cells, while the yellow arrow indicates an example of cGAS negative, γH2AX positive CCFs in TXNRD1 knockdown cells. γH2AX-positive CCFs that are positive for cGAS from the indicated groups were quantified (g). Scale bar = 10 μm.
h,i, Immunoblot of the indicated protein in control proliferating and oncogenic RAS-induced senescent IMR90 cells with or without TXNRD1 knockdown or treatment with a pharmacological TXNRD1 inhibitor Tri-1 (5 μM) (h). In addition, cellular 2’ 3’-cGAMP levels were measured in the indicated cells (i).
j,k, Immunostaining for cGAS and γH2AX in oncogenic RAS-induced senescent IMR90 cells treated with vehicle control or TXNRD1 inhibitor Tri-1 (5 μM) (j). White arrow indicates an example of cGAS and γH2AX positive CCFs in control cells, while the yellow arrow indicates an example of cGAS negative, γH2AX positive CCFs in Tri-1 treated cells. γH2AX-positive CCFs that are positive for cGAS from the indicated groups were quantified (k). Scale bar = 10 μm.
Data represent mean ± s.e.m. n = 3 biologically independent experiments unless otherwise stated. P-values were calculated using a two-tailed t test.
Given the importance of CCFs in activating the cGAS-STING pathway3–6, we examined the effects of TXNRD1 knockdown on the localization of cGAS into CCFs (Fig. 1f–g and Extended Data Fig. 3a). TXNRD1 knockdown significantly impaired localization of cGAS into CCFs without affecting CCFs formation per se (Extended Data Fig. 3b). TXNRD1 knockdown does not affect cGAS expression (Extended Data Fig. 3a). Consistently, TXNRD1 knockdown reduced STING dimerization and cellular levels of 2’,3’-cGAMP, the enzymatic product of cGAS (Fig. 1h–i). To validate results obtained by TXNRD1 knockdown using an orthogonal approach, we treated OIS cells using Tri-1, a selective TXNRD1 inhibitor17. Similar impairment of cGAS’ localization into CCFs, reduction in STING dimerization and 2’,3’-cGAMP levels were observed with Tri-1 treatment (Fig. 1h–k). TXNRD1 knockdown or Tri-1 treatment did not affect senescence per se as determined by markers of senescence such as SA-β-Gal activity, expression of p21 and p16, and senescence-associated growth arrest (Extended Data Fig. 3c–e). This result indicates that the observed suppression of the cGAS-STING pathway by TXNRD1 inhibition is not a consequence of senescence bypass. Notably, TXNRD1 knockdown or Tri-1 treatment itself did not induce senescence (Supplementary Fig. 3). Similar observations were made in cisplatin-induced senescent PEO1 cells (Extended Data Fig. 4). In contrast, TXNRD1 knockdown or Tri-1 treatment did not affect 2’,3’-cGAMP levels induced by transfection of interferon-stimulatory DNA that activates cGAS signaling18,19 (Supplementary Fig. 4). This suggests that regulation of cGAS activity by TXNRD1 depends on the formation of the CCF and the localization of TXNRD1 into CCFs. Together, we conclude that TXNRD1 localizes to CCFs and is required for cGAS-STING activation during senescence.
TXNRD1 promotes the SASP independently of its enzymatic activity
We next examined the effects of TXNRD1 inhibition on SASP gene expression by performing RNA-seq analysis in OIS cells with or without TXNRD1 inhibition at the time of senescent induction (Extended Data Fig. 5a). The SASP gene signature was significantly enriched by the differentially expressed genes that are commonly downregulated by TXNRD1 knockdown or Tri-1 treatment (Fig. 2a and Extended Data Fig. 5b), which was validated by RT-qPCR analysis of selected SASP genes (Extended Data Fig. 5c–d). Similar findings were also made by knocking out TXNRD1 using sgRNA in a heterogeneous knockout population of OIS IMR90 cells (Extended Data Fig. 5e–f). We observed a similar decrease in expression of SASP genes by TXNRD1 inhibition in fully established senescent cells (Fig. 2b and Supplementary Fig. 5). Furthermore, secretion of SASP factors induced during OIS was significantly suppressed by either TXNRD1 knockdown or Tri-1 treatment in fully established senescent cells using an antibody array (Fig. 2c).
Figure 2: TXNRD1 regulates SASP independently of its enzymatic activity.
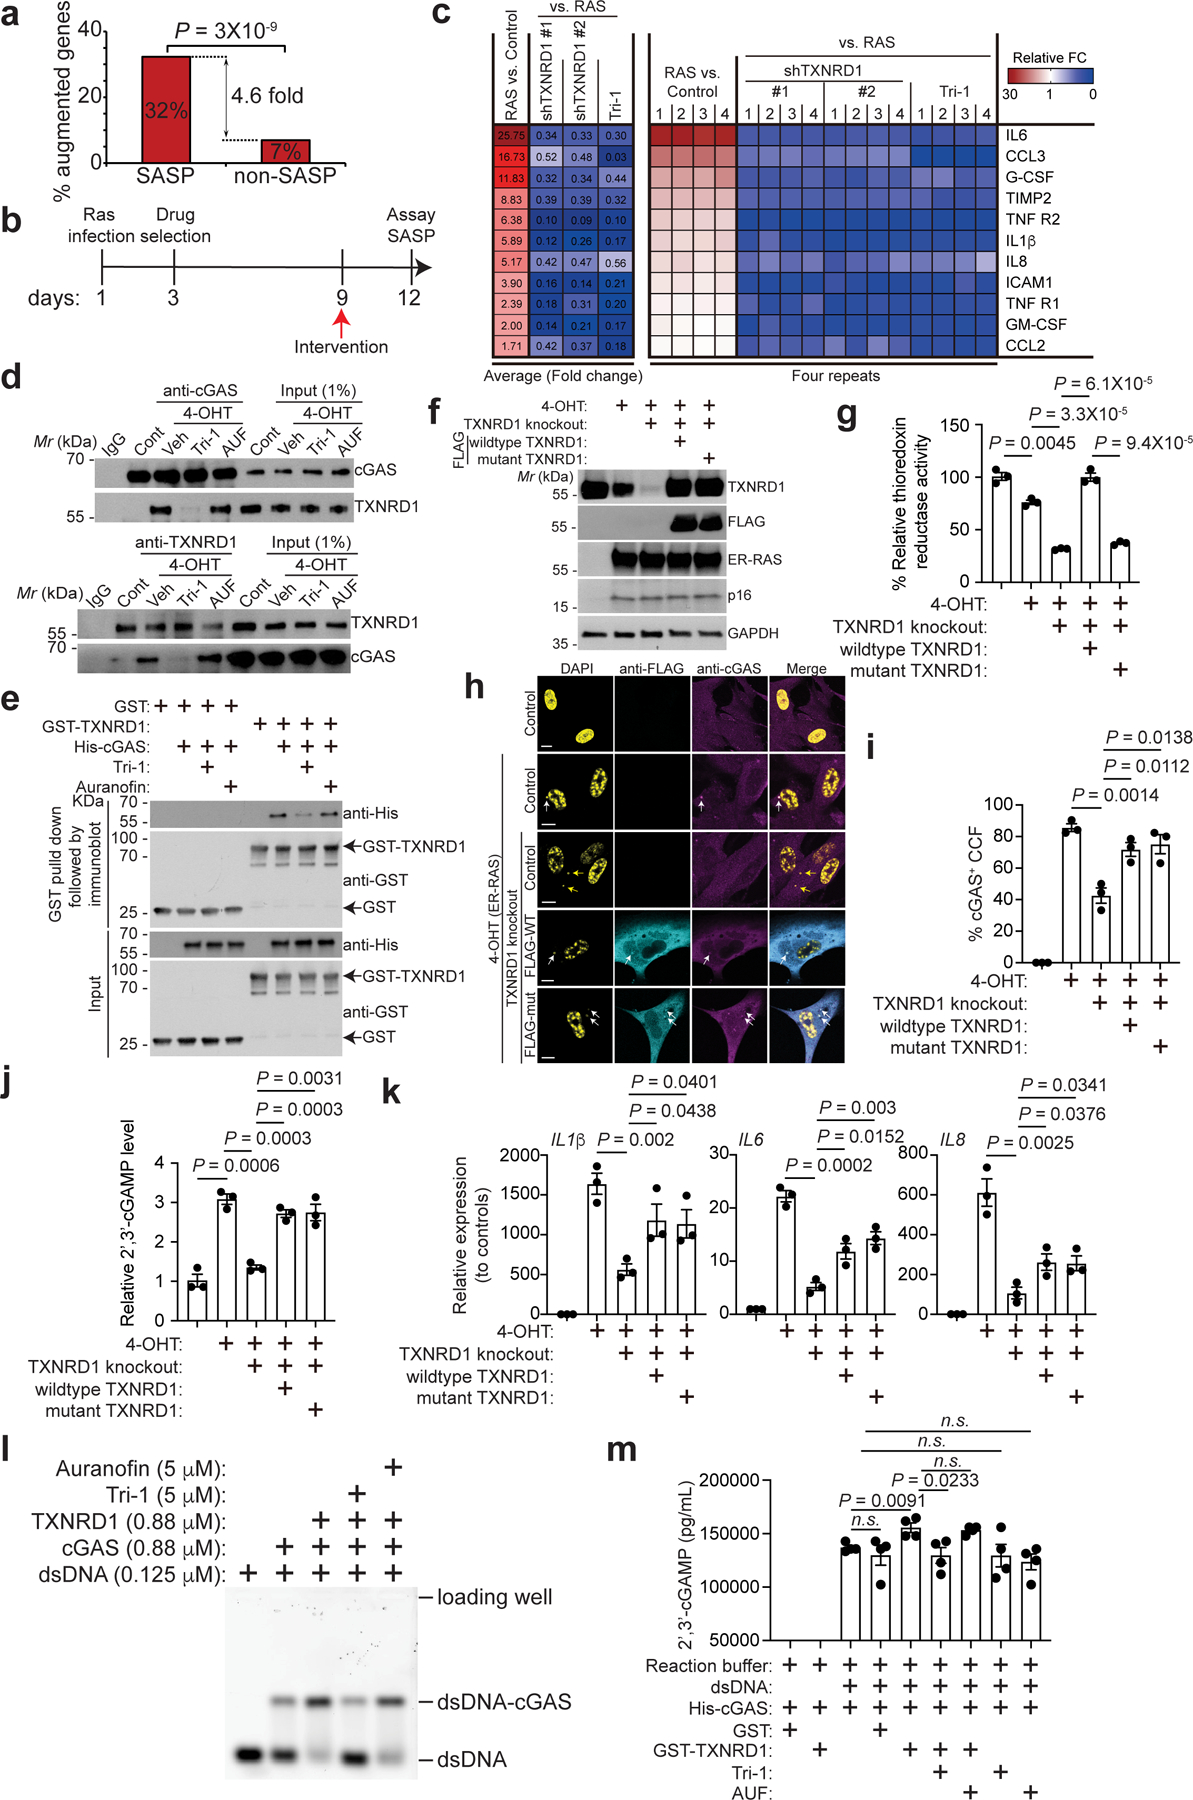
a, Enrichment of the SASP genes among genes that were significantly downregulated by both TXNRD1 knockdown and TXNRD1 inhibitor Tri-1 treatment in oncogenic RAS-induced senescent IMR90 cells determined by RNA-seq analysis.
b, Schematic of experimental design for determining the effects of TXNRD1 inhibition in fully established senescent IMR90 cells.
c, The secretion of soluble factors under the indicated conditions were detected by antibody arrays. The heatmap indicates the fold change (FC) in comparison to the control or RAS-induced senescent condition. The relative expression levels per replicate and average fold change differences are shown (n = 4 biologically independent experiments).
d, Co-immunoprecipitation analysis of TXNRD1 and cGAS was performed in control proliferating and oncogenic RAS-induced senescent IMR90 cells with or without the indicated TXNRD1 inhibitors treatments.
e, GST pull-down assay using purified His-cGAS and GST-TXNRD1 with or without Tri-1 or auranofin in the reaction. GST was used a negative control.
f-k, Immunoblot of the indicated proteins in ER-RAS inducible IMR90 cells (by 4-OHT treatment) with or without endogenous TXNRD1 knockout, and rescued by ectopic expression of FLAG-tagged wild-type or C59S/C54S mutant TXNRD1 (f). And thioredoxin reductase activity was measured in the indicated cells (g). Images of immunostaining for FLAG and cGAS in the indicated cells (h). White arrows indicate examples of cGAS positive CCFs, while yellow arrows indicate examples of cGAS negative CCFs. Notably, both wildtype and C59S/C54S mutant TXNRD1 localize into CCFs as determined by FLAG staining. cGAS-positive CCFs from the indicated groups were quantified (i). 2’ 3’-cGAMP levels in the indicated cells were measured (j). Expression of the indicated SASP genes was determined by qRT-PCR in the indicated cells (k). Scale bars = 10 μm.
l, Electrophoretic mobility shift analysis of cGAS binding to dsDNA with the indicated treatments.
m, 2’ 3’-cGAMP production in the indicated groups was measured by ELISA. n = 4 biologically independent experiments.
Data represent mean ± s.e.m. n = 3 biologically independent experiments unless otherwise stated. P-values were calculated using a two-tailed t test.
Since TXNRD1 co-localizes with cGAS in CCFs, we determined whether TXNRD1 interacts with cGAS in senescent cells. Co-immunoprecipitation analysis revealed that TXNRD1 and cGAS interact with each other in both RS and OIS but not proliferating cells (Fig. 2d and Supplementary Fig. 6). cGAS directly binds to TXNRD1 as determined by the GST pull-down assay (Fig. 2e). We observed that Tri-1 impaired the interaction between cGAS and TXNRD1 in both OIS and RS cells (Fig. 2d and Supplementary Fig. 6) and between purified cGAS and TXNRD1 (Fig. 2e). These results indicate that in addition to suppressing the enzymatic activity of TXNRD117, Tri-1 may exert its function by disrupting the interaction between TXNRD1 and cGAS. To differentiate these two functions of Tri-1, we examined auranofin, another inhibitor of the TXNRD1 enzymatic activity20, in its ability to disrupt the interaction between TXNRD1 and cGAS. Using concentrations of Tri-1 and auranofin with comparable inhibition of the enzymatic activity of TXNRD1 (Supplementary Fig. 7a), Tri-1, but not auranofin, disrupted the interaction between TXNRD1 and cGAS (Fig. 2d–e and Supplementary Fig. 6). We examined the effects of both Tri-1 and auranofin on the SASP gene expression. While Tri-1 produced a degree of inhibition of the SASP genes that is comparable to G140, an inhibitor of the cGAS21 (Supplementary Fig. 7b), auranofin failed to decrease the SASP gene expression (Supplementary Fig. 7b).
We next knocked out TXNRD1 in IMR90 cells expressing an inducible H-RASG12V and replaced with FLAG-tagged wildtype or a mutant TXNRD1 (C59S/C63S)22 that is defective in its enzymatic activity (Fig. 2f), which was validated by directly measuring thioredoxin reductase activity (Fig. 2g). Both wildtype and mutant TXNRD1 localized to CCFs and rescued the cGAS’ localization into CCFs in TXNRD1 knockout cells (Fig. 2h–i). Notably, both wildtype and mutant TXNRD1 can bind to cGAS (Supplementary Fig. 7c). Consistently, both wildtype and mutant TXNRD1 were equally effective in rescuing the decrease in 2’,3’-cGAMP levels and the suppression of the SASP genes induced by TXNRD1 knockout (Fig. 2j–k). Markers of senescence such as SA-β-Gal activity and growth arrest were not affected by either wildtype or mutant TXNRD1 (Supplementary Fig. 8). Finally, as a negative control, we knocked down thioredoxin (TXN), the substrate of TXNRD1 enzymatic activity9 (Extended Data Fig. 6a). TXN knockdown did not affect cGAS’ localization into the CCFs or the 2’3’-cGAMP levels induced during OIS (Extended Data Fig. 6b–d). Together, we conclude that TXNRD1 regulates the SASP in a manner that is independent of its enzymatic activity.
We next determined whether TXNRD1 affects the DNA binding affinity of cGAS using electrophoretic mobility-shift assay (EMSA). Our analysis revealed that TXNRD1 enhanced the high-molecular-weight of cGAS bound dsDNA, which was impaired by Tri-1 treatment (Fig. 2l and Supplementary Fig. 9a–b). Auranofin that did not affect the interaction also failed to impair the observed enhancement of cGAS binding to dsDNA induced by TXNRD1 (Fig. 2l). Tri-1 alone did not affect binding of cGAS to dsDNA (Supplementary Fig. 9c), which limited the possibility that Tri-1 interferes the binding of cGAS to dsDNA. We next examined the effects of TXNRD1 on the enzymatic activity of cGAS. 2’,3’-cGAMP production by cGAS determined by ELISA was enhanced by TXNRD1, which can be suppressed Tri-1 but not auranofin (Fig. 2m). This result supports that Tri-1 inhibits the enhancement of cGAS activity induced by TXNRD1 through disrupting its interaction with cGAS. Next, we assembled mononucleosome with linker DNA that can trigger cGAS activity23,24,25. Addition of mononucleosome blocked the interaction between TXNRD1 and cGAS, suggesting that it competitively binds to cGAS with a higher affinity compared to TXNRD1 (Supplementary Fig. 10a). In contrast, free dsDNA induced cGAS activity is enhanced by TXNRD1 (Fig. 2l–m), which correlated with an enhanced binding between cGAS and TXNRD1 (Supplementary Fig. 10b). These data support our model whereby TXNRD1 enhances cGAS activity in the cytoplasmic CCF. Together, we conclude that TXNRD1 promotes the DNA binding affinity of cGAS to enhance its enzymatic activity in cytoplasm.
TXNRD1 is required for the function of the SASP
The functional roles of the SASP in cancer are context-dependent26,27. SASP promotes the growth of tumor cells28. To establish the role of TXNRD1-regulated SASP in a physiological context, we treated ovarian cancer cells with conditioned media collected from senescent cells with or without knockdown of TXNRD1 or treatment with Tri-1. The growth-promoting effects of conditioned media from senescent cells were significantly reduced by inhibiting TXNRD1 (Extended Data Fig. 7a). Consistently, the tumor growth-stimulating effects of co-injected senescent fibroblasts were significantly impaired by TXNRD1 or pre-treated with Tri-1 in vivo in xenograft models (Fig. 3a and Extended Data Fig. 7b–c).
Figure 3: TXNRD1 is required for the pro-tumorigenic and immune surveillance function of the SASP.
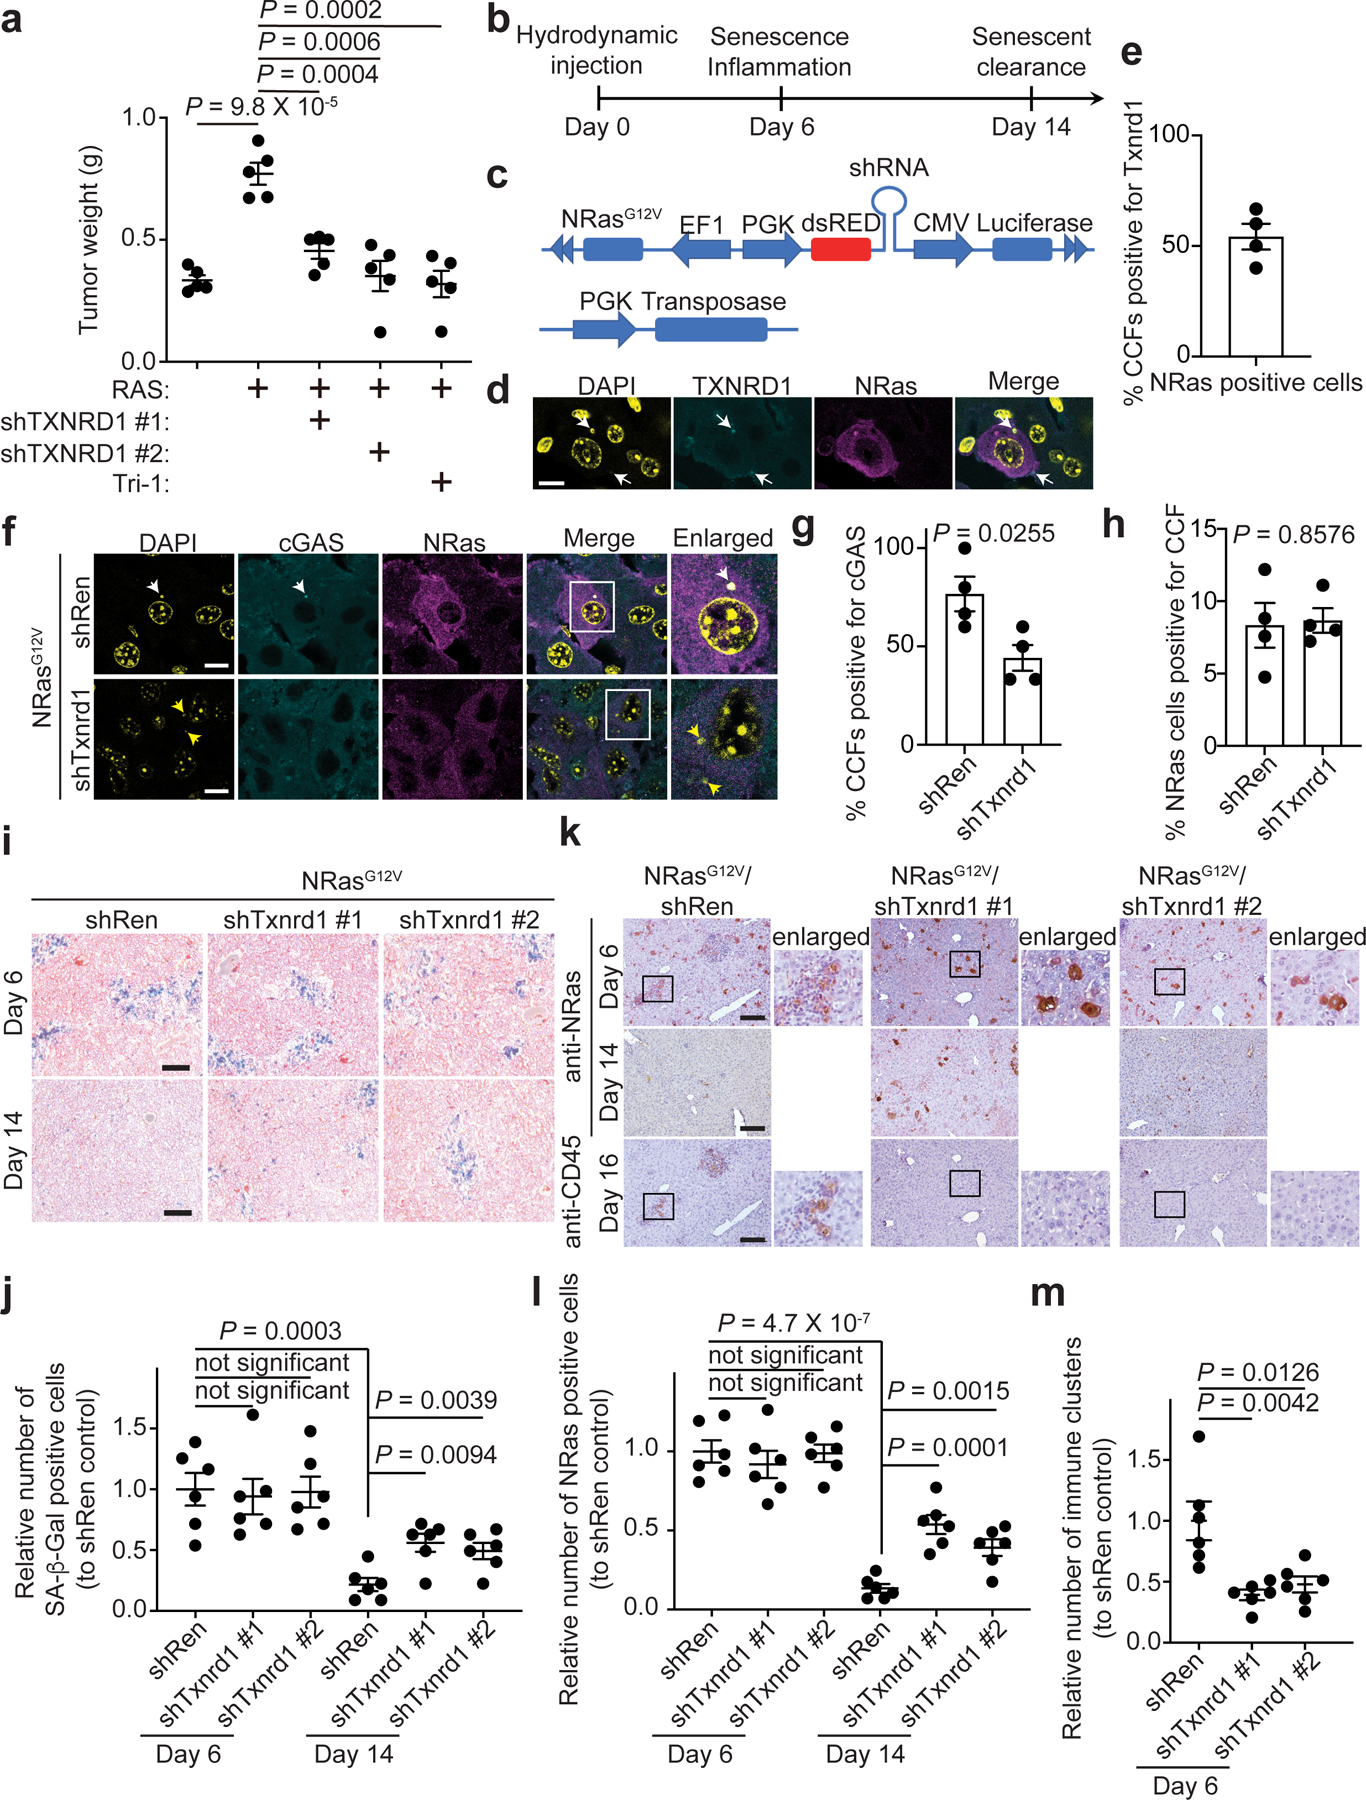
a, Tumor growth stimulated by co-injected senescent IMR90 fibroblasts in a xenograft mouse model was inhibited by TXNRD1 knockdown or Tri-1 treatment. TOV21G cells were subcutaneously injected with the indicated senescent IMR90 cells into NSG female mice. The tumor weight was measured at the end of the experiment (n = 5 biologically independent mice per group).
b,c, Schematic of the experimental design (b) and the transposon-based constructs (c) for hydrodynamic tail vein injection mouse model.
d,e, Immunostaining for Txnrd1 and NRas in mouse livers in the hydrodynamic tail vein injection model. DAPI counter staining was used to visualize the nuclei. The arrows indicate examples of Txnrd1 positive CCFs in NRas-expressing hepatocytes (d). Percentages of CCFs positive for Txnrd1 were quantified from 4 biologically independent mice (e). Scale bars = 10 μm.
f-h, Immunostaining for cGAS and NRas in mouse livers from indicated groups. DAPI counter staining was used to visualize the nuclei. The white arrow indicates an example of a cGAS positive CCFs, while yellow arrows indicate examples of cGAS negative CCF in NRas-expressing hepatocytes (f). Percentages of CCFs positive for cGAS (g) and percentages of NRas-expressing cells positive for CCFs (h) were quantified from 4 biologically independent mice. Scale bars = 10 μm.
i,j, Images of SA-β-gal staining of the liver tissues from the indicated groups at day 6 and 14 post injection (i), and the number of SA-β-gal-positive cells in the indicated groups was quantified (j). n = 6 biologically independent mice per group. Scale bars = 100 μm.
k-m, Images of immunohistochemical staining for NRas and CD45 expression in each of the indicated groups at the indicated time points. Magnified views of the region in the black square are shown (k). Comparison of the NRas-positive cells at day 6 and the remaining NRas-positive cells at day 14 indicated immune clearance (l). Number of clusters of immune cells at day 6 was quantified in the indicated groups(m). n = 6 biologically independent mice per group. Scale bars = 50 μm.
Data represent mean ± s.e.m. P-values were calculated using a two-tailed t test.
SASP promotes the surveillance of premalignant OIS cells through immune clearance during tumor initiation26,27. To explore the role of TXNRD1-regulated SASP in immune surveillance, we used hydrodynamic tail vein injection of a vector expressing sleeping beauty (SB) transposase and transposon vector expressing both oncogenic NRasG12V and shTxnrd1 or a negative control shRenilla (shRen) that causes stable integration of the transposon selectively into hepatocytes (Fig. 3b–c and Extended Data Fig. 7d). Oncogenic NRasG12V acutely triggers senescence and SASP in hepatocytes, which activates immune surveillance and clearance of premalignant hepatocytes29. At day 6 post injection, NRasG12V induced senescence and we observed Txnrd1 positive CCFs in NRas-expressing hepatocytes (Fig. 3d–e). We observed a decrease in cGAS positive CCFs by shTxnrd1 compared with controls in NRas-expressing hepatocytes (Fig. 3f–g) and this was not due to a decrease in CCF formation (Fig. 3h). Similar numbers of NRas-expressing and SA-β-gal positive cells were observed in both control shRen and shTxnrd1-expressing groups (Fig. 3i–j). This suggests a similar efficacy in delivering the transposon vectors in these groups. Expression of shTxnrd1 did not affect SA-β-gal positive cells (Fig. 3i–j). However, shTxnrd1 significantly decreased immune cell clusters (Fig. 3k–m). By day 14, livers from shRen-control expressing mice showed a significant reduction in NRas-expressing and SA-β-gal positive hepatocytes (Fig. 3i–l), which is consistent with immune-mediated clearance of NRas-expressing senescent cells29. In contrast, shTxnrd1-expressing groups retained significantly more NRas and SA-β-gal positive cells (Fig. 3i–l). This correlates with a significant lower number of immune cell clusters in shTxnrd1 groups compared to shRen-expressing groups (Fig. 3m). Together, we conclude that TXNRD1 are required for SASP-mediated immune clearance of senescent cells in vivo.
Disrupting the TXNRD1-cGAS interaction suppresses age-associated inflammation
The cGAS-STING pathway drives ageing-related inflammation and neurodegeneration30. There is evidence to indicate that the cGAS-STING pathway promotes inflammation through inflammasome formation via NFκb as evidenced by upregulation of NLRP3 and other regulators of the pathway such as Caspase 131–33. This correlated with positive NLRP3 staining both in vitro in cell culture and in vivo in mouse tissues31,32. Consistently, knockdown of key NLRP3 inflammasome regulators such as Caspase 1 and GSDMD34 suppressed the SASP in senescent cells (Extended Data Fig. 8a–c). Indeed, Tri-1, but not auranofin, suppressed NLRP3 positivity during both RS and OIS (Fig. 4a–b and Extended Data Fig. 8d–e). TXNRD1 knockdown reduced the inflammasome formation as determined by apoptosis-associated speck-like (ASC) staining35,36 (Extended Data Fig. 8f–g).
Figure 4: Pharmacological intervention of TXNRD1-cGAS interaction suppresses age-associated inflammation.
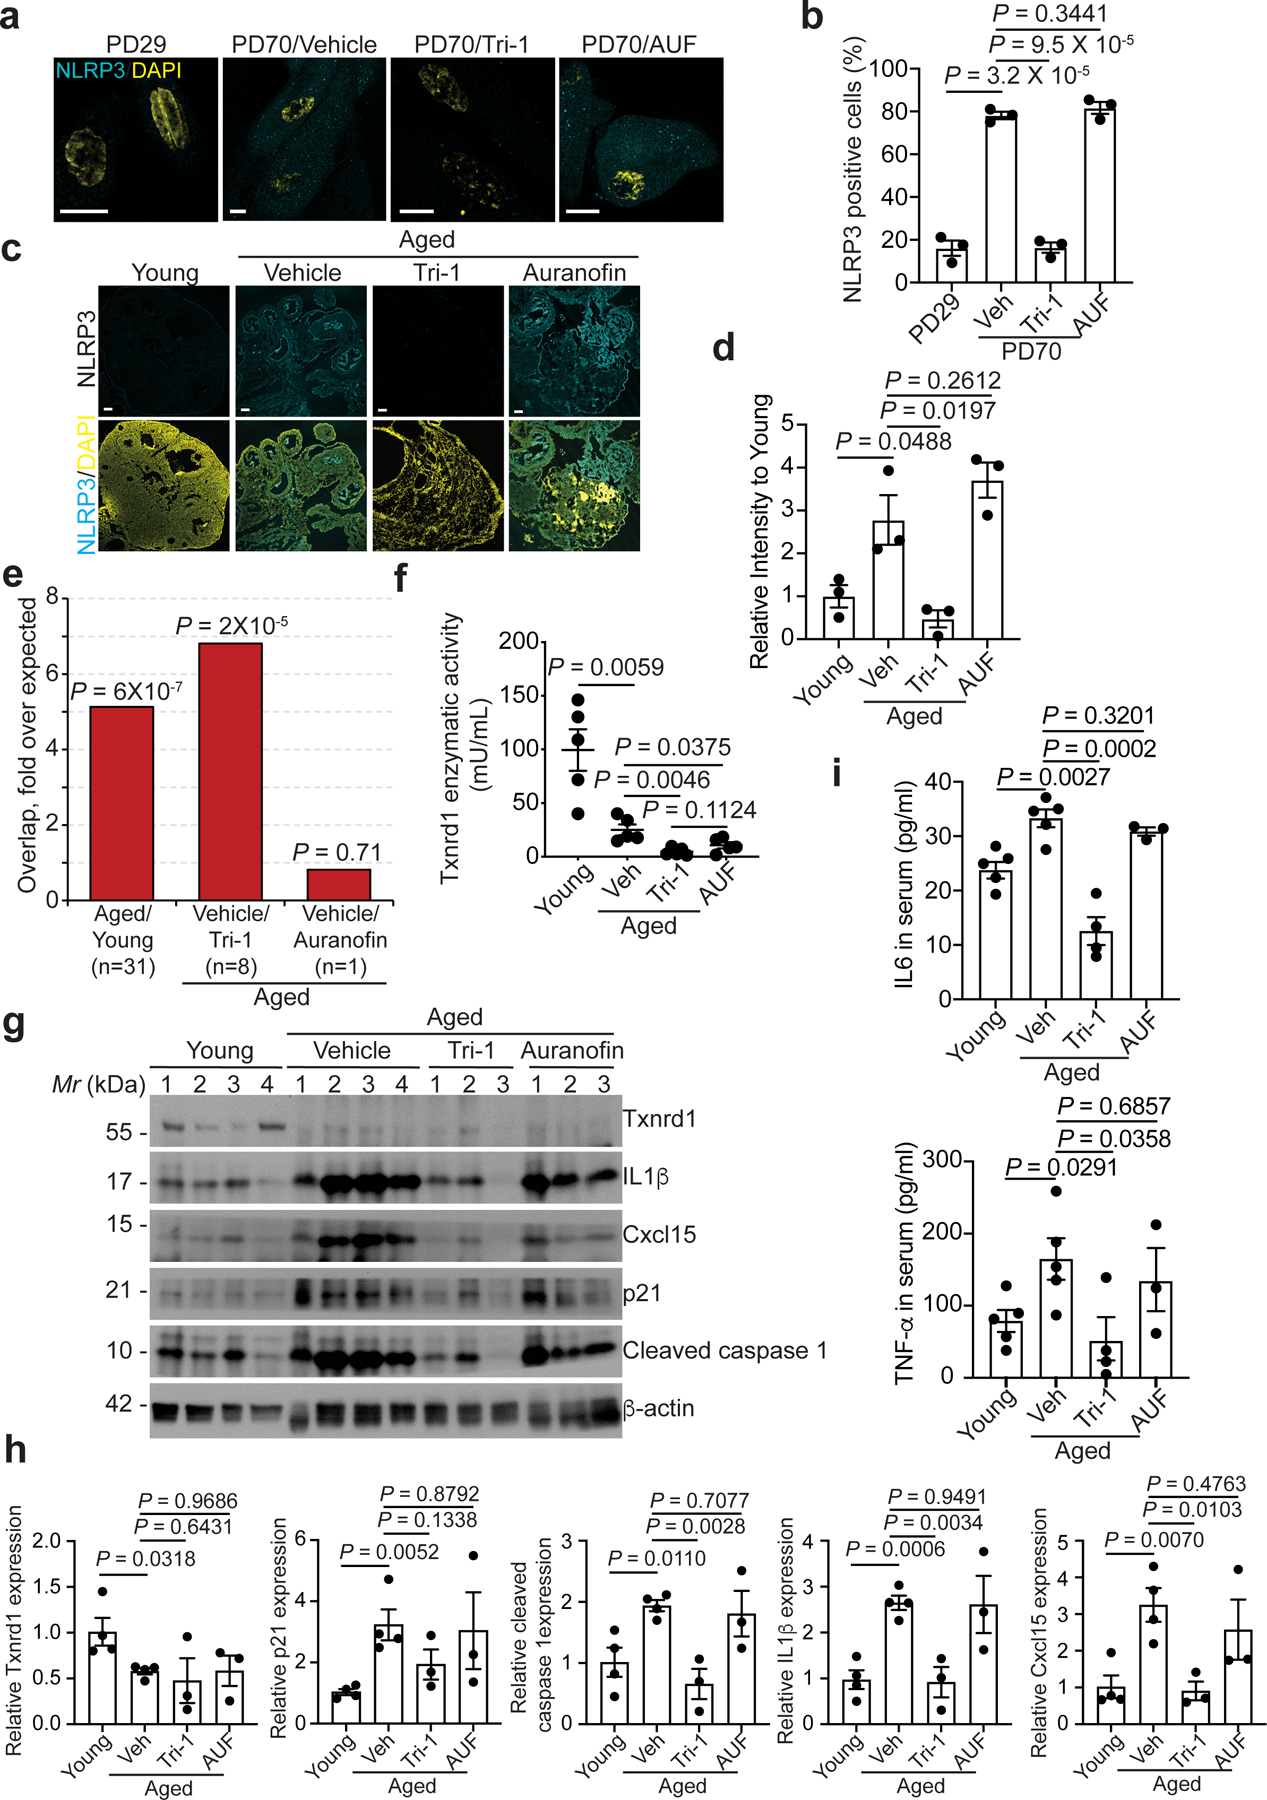
a,b, Images of immunostaining for NLRP3 in young (PD29) and replicative senescent (PD70) IMR90 cells (a). The number of cells positive for NLRP3 staining was quantified (b). n = 3 biologically independent experiments. Scale bars = 10 μm.
c,d, Images of immunostaining for NLRP3 in the ovary tissues from young (4 months) and aged mice (22 months) with or without Tri-1 and auranofin treatments (c). The intensity of NLRP3 staining in the indicated groups was quantified using NIS elements Ar software (d). n = 3 biologically independent mice per group. Scale bars = 100 μm.
e, Genes that were significantly upregulated in ovary tissues from aged mice compared with young mice are enriched for the SASP genes. In addition, genes that were significantly suppressed by Tri-1, but not auranofin, treatment in ovary tissues from aged mice are enriched for the SASP genes. n indicates number of SASP genes changed in the indicated conditions.
f, Inhibition of the Txnrd enzymatic activity by Tri-1 and auranofin in the ovary tissues of aged mice (22 months). n = 5 biologically independent mice per group.
g,h, Immunoblot of the indicated proteins in the ovary tissues harvested from young mice (4 months), and aged mice (22 months) with or without Tri-1 or auranofin treatments (h). The intensity of the indicated proteins was quantified by NIH ImageJ software and normalized against a loading control β-actin expression (i). n = 4 biologically independent mice per group in young and aged control groups, n = 3 biologically independent mice per group in treated aged groups.
i, Serum levels of IL6 and TNF-α from the indicated young (4 months) or aged mice (22 months) treated with or without Tri-1 or auranofin were determined by ELISA. n=5 young, 5 aged/veh, 4 aged/Tri-1, and 3 aged/AUF biologically independent mice.
Data represent mean ± s.e.m. P-values were calculated using a two-tailed t test.
Given the role of TXNRD1 in regulating the SASP that contributes to inflammaging, we explored the implication of this mechanism during tissue aging. We examined Txnrd1 expression in ovary of young and aged mice. Txnrd1 levels were decreased in aged compared with young ovary tissues examined (Extended Data Fig. 8h–j). Similar to a previous report37, we showed that NLRP3 positivity was upregulated in aged mouse ovaries compared with young ones (Fig. 4c–d). Treatment with Tri-1, but not auranofin, reduced NLRP3 positivity in aged mouse ovaries (Fig. 4c–d). We next determined the effect of Tri-1 on expression of the SASP genes in vivo. RNA-seq analysis revealed that SASP genes were significantly enriched by genes upregulated in aged mouse ovaries compared with young ones (Fig. 4e and Extended Data Fig. 9a). SASP genes were significantly enriched by genes downregulated by Tri-1 in aged mouse ovaries (Fig. 4e and Extended Data Fig. 9b). Notably, auranofin treatment failed to significantly affect SASP genes in aged mouse ovaries (Fig. 4e). Both Tri-1 and auranofin comparably inhibited the Txnrd1 enzymatic activity in vivo in the ovaries of the treated aged mice (Fig. 4f). This indicates that the observed effects are independent of Txnrd1’s enzymatic activity. As expected, both Tri-1 and auranofin suppressed TXNRD1 regulated genes (Extended Data Fig. 9c). Notably, neither Tri-1 nor auranofin affected either p16 or p53 signatures that are activated in aged mouse ovaries compared with young ones (Extended Data Fig. 9d–e). We validated that Tri-1 suppressed the SASP genes such as IL1β, IL6 and Cxcl15 (mouse homolog of IL8) observed in aged mouse ovaries (Extended Data Fig. 10a). Likewise, we showed that the expression of IL1β and Cxcl15 was reduced by Tri-1 but not auranofin in aged mouse ovaries (Fig. 4g–h and Extended Data Fig. 10b–c). In contrast, expression of p16 and p21 was not affected by either Tri-1 or auranofin treatment (Fig. 4f–g and Extended Data Fig. 10d). NLRP3 expression leads to cleaved caspase 1 expression38. Consistent with the finding that Tri-1, but not auranofin, treatment suppressed NLRP3 in aged mouse ovaries, cleaved caspase 1 expression was suppressed by Tri-1 but not auranofin (Fig. 4g–h). Similar observations were also made in colon and uterus of aged compared with young mice (Supplementary Fig. 11 and 12). To determine whether Tri-1 can reverse the age-associated inflammation systematically, we measured serum levels of IL6 and TNF-α, two well established markers of age-associated inflammation39 40. Tri-1, but not auranofin, treatment decreased serum levels of IL6 and TNF-α in aged mice (Fig. 4i). Collectively, these data suggest that targeting the interaction between TXNRD1 and cGAS reduces age-associated inflammation.
Discussion
Oxidative stress is thought to play a major role in tissue aging and age-related diseases16. The thioredoxin system, a ubiquitous thiol oxidoreductase pathway, is among the most important antioxidant mechanisms in cells9. Indeed, thioredoxin overexpression extends lifespan41. Consistently, we showed that TXNRD1 expression is downregulated during tissue aging in mouse ovary, colon and uterus. This supports that TXNRD1 downregulation may contribute to tissue aging by increasing reactive oxygen species (ROS). Notably, inhibition of ROS suppresses the SASP42. However, we show here that TXNRD1 inhibition either genetically or using a small molecule inhibitor Tri-1 reduced the SASP. Together, these results suggest a two-pronged role played by TXNRD1 in tissue aging. Specifically, TXNRD1 downregulation may contribute to tissue aging by increasing oxidative stress, while its localization into CCFs promotes the innate immune cGAS-STING pathway. In addition, we previously showed that Topoisomerase 1-DNA covalent cleavage complex (TOP1cc) is both necessary and sufficient for cGAS-mediated CCF recognition and SASP during senescence43. This depends on the stabilization of TOP1cc on DNA whose formation occurs in nuclei. Thus, TXNRD1 likely functions in cytoplasm downstream of TOP1cc that started in nuclei in the context of the cGAS-CCF-SASP regulation. A recent study shows that the cGAS-STING pathway drives ageing-related inflammation and neurodegeneration30. However, the relevance of TXNRD1-CCFs axis in general aging would need further characterization by future studies.
TXNRD1’s role in promoting the SASP is independent of its enzymatic activity and, instead, depends on its interaction with cGAS. This creates a unique opportunity to target the interaction between TXNRD1 and cGAS to selectively suppress inflammaging, while maintaining its potential anti-aging role in regulating cellular redox. As a proof-of-principle to this concept, we showed that treatment of aged tissues with Tri-1 that simultaneously inhibits TXNRD1 enzymatic activity and disrupts its interaction with cGAS reduced inflammaging. In contrast, auranofin that suppresses TXNRD1 enzymatic activity at comparative levels but not its interaction with cGAS failed to reduce inflammaging. These results also suggest that TXNRD1’s enzymatic activity independent role in the cGAS-STING pathway dominates over its enzymatic function in determining the inflammaging. Inhibition of cGAS activity is systematic and thus may have unintended side effects. Thus, targeting the interaction between TXNRD1 and cGAS to suppress the SASP driven by cGAS signaling is advantageous because the interaction only occurs in senescent cells. In summary, our results establish an enzymatic activity independent role of TXNRD1 in regulating SASP via the cGAS-STING pathway that has important implications for both tissue aging and cancer.
Methods
Study approval and animal housing
All of the protocols were approved by the Institutional Animal Care and Use Committee (IACUC) of the Wistar Institute (protocol numbers: 201205 and 201126). All animal experiments were carried out in accordance with the relevant guidelines. Mice were maintained at 22–23°C with 40–60% humidity and a 12 hrs light - 12 hrs dark cycle.
Cells and culture conditions
IMR90 and BJ human fibroblasts were cultured under 2% O2 in DMEM medium supplemented with 10% fetal bovine serum (FBS), glutamine, sodium pyruvate, non-essential amino acids and sodium bicarbonate. PD26 IMR90 cells were used unless otherwise stated. TOV21G human ovarian cancer cells were cultured in RPMI 1604 medium supplemented with 10% FBS and 1% penicillin–streptomycin under 5% CO2. PEO1 human ovarian cancer cells were cultured in RPMI1640 medium with 10% FBS and 1% penicillin-streptomycin under 5% CO2. NIH3T3 cells were cultured in DMEM medium with 10% FBS and 1% penicillin–streptomycin under 5% CO2. 293FT and Phoenix cells were cultured in DMEM medium supplemented with 10% FBS and 1% penicillin–streptomycin under 5% CO2. These cell lines were authenticated at The Wistar Institute’s Genomics Facility using short-tandem-repeat DNA profiling. Regular mycoplasma testing was performed using the LookOut mycoplasma PCR detection kit (Sigma, cat. no. MP0035).
Retrovirus and lentivirus production and infection
Retrovirus production was performed using Phoenix cells44. Lentivirus production was performed using packaging plasmids in 293FT cells. Transfection was performed using Lipofectamine 2000 (Thermo Fisher, cat. no. 11668019) based on the manufacturer’s instructions. The infected cells were purified based on expression of the puromycin resistance gene using puromycin (1 μg ml–1).
Colony-formation assay
For colony-formation, cells were plated (at 3,000 cells per well) in six-well plates. After 10 days’ culture, the plates were stained with 0.05% crystal violet. The integrated intensity was analyzed using the NIH ImageJ software (1.48v).
RNA-sequencing
For cell-based RNA-sequencing analysis, RNA was extracted using RNeasy mini Kit (Qiagen, cat. no. 74106) and digested with DNase I (Qiagen, cat. no. 79254). KAPA RNA HyperPrep kit (Roche, cat. no: 07962312001) was used for library preparation. For tissue-based RNA-sequencing, RNA was extracted using TRIzol reagent (Thermo Fisher, cat. no. 15596018). Lexogen QuanSeq3’ mRNA-seq library prep kit (Lexogen, cat. no. 015.96) was used for library preparation. The sequencing was performed using an Illumina NextSeq 500 system in a 75-bp paired-end run at the Wistar Genomics Facility.
Reverse-transcriptase qPCR (RT-qPCR)
Reverse-transcription was performed using a high-capacity cDNA reverse transcription kit (Thermo Fisher, cat. no. 4368814). QuantStudio 3 real-time PCR system was used to perform quantitative PCR. The amplification signal of qPCR was acquired by QuanStudioTM Software V1.3. The primers used in the present study are listed in Supplementary Table 2.
Reagents, plasmids, and antibodies
The following reagents were obtained from the indicated suppliers with the indicated catalog numbers: Interferon stimulatory (ISD)2 double-strand DNA: InvivoGen (cat. no. tlrl-isdn); human recombinant TXNRD1 protein: LSBio (cat. no. LS-G793); human recombinant cGAS protein: Cayman (cat. no. 22810); Tri-1: MedChemExpress (cat. no. HY-125006); auranofin: MedChemExpress (cat. no. HY-B1123); etoposide: Sigma (cat. no. E1383); G140: Invivogen (cat. no. inh-g140); Cytochalasin B: Sigma (cat. no. C6762); Spermine: Sigma (cat. no. S3256); Formaldehyde solution: Sigma (cat. no. F8775); and Paraformaldehyde (PFA): Sigma (cat. no. 158127).
The following plasmids were obtained from Addgene: pBABE-puro-H-RASG12V, pBABE-puro-Empty and pLNC-ER:Ras. The shRNAs against the following human genes were obtained from the Molecular Screening Facility at the Wistar Institute: shTXNRD1 #1, TRCN0000046534; shTXNRD1 #2, TRCN0000046535 and shTXN: TRCN0000064278. sgRNAs were cloned into LentiCRISPR v2 (Addgene #52961) linearized with BsmBI. The oligonucleotides used for sgRNAs are listed in Supplementary Table 2. The Transposon-based plasmid pKT2-NRasV12-DsRed2-miR-30-shRenilla-Luciferase and pPGK-Transpose plasmids were previously reported45. miR-30-based shRNA sequences for mouse Txnrd1 #1 (5′- CGGTAGGAAGAGATTCTTGTA −3′) and Txnrd1 #2 (5′- GCAGCCAAATTTGACAAGAAA-3′) were subcloned into plasmid pKT2-NRasV12-DsRed2-miR-30-shRNA-Luciferase. Sanger DNA sequencing was used to verify all the plasmids. Human wildtype and mutant TXNRD1 genes were synthesized at GeneScript Biotech Corp and were inserted into the either pGEX-4T-1 plasmid at BamHI/XhoI sites or lentiviral plasmid pLVX-Puro (Takara, cat. no. 632164) at BamHI/XbaI sites using standard molecular cloning protocols.
For western blots, the following antibodies were used: mouse anti-TXNRD1 (B-2) (Santa Cruz Biotechnology, cat. no. SC-28321; 1:200); rabbit anti-TXNRD1 (Bethyl, cat. no. A304–791A; 1:2000); mouse anti-cGAS (D-9) (Santa Cruz Biotechnology, cat. no. sc-515777, 1:200); rabbit anti-STING (D2P2F) (Cell Signaling Technology, cat. no. 13647S, 1:1000); mouse anti-p16INK4a (DCS50.1) (Abcam, cat. no. ab16123, 1:500); mouse anti-p21 (817) (Santa Cruz Biotechnology, cat. no. sc-817; 1:200); mouse anti-RAS (18/Ras) (BD Biosciences, cat. no. 610001; 1:1000); rabbit anti-Cyclin A (H-432) (Santa Cruz, cat. no. sc-751, 1:200); rabbit anti-IL1β (D3A3Z) (Cell Signaling Technology, cat. no. 83186, 1:1000); rabbit anti-Caspase 1 (Proteintech, cat. no. 22915–1-AP, 1: 500); mouse anti-IL8 (Clone # 1028336) (R&D, cat. no. MAB208, 1:1000); rabbit anti-FLAG (D6W5B) (Cell Signaling Technology, cat. no. 14793, 1:1000); rabbit anti-γH2AX (20E3) (Cell Signaling Technology, cat. no. 9718S, 1:1000); rabbit anti-53BP1(EPR2172(2)) (Abcam, cat. no. ab175933, 1:1000); mouse anti-Lamin A/C (4C11) (Cell Signaling Technology, cat. no. 4777S, 1:1000); mouse anti-TXN (D-4) (Santa Cruz, cat. no. sc-271281, 1:200); rabbit anti-GAPDH (D16H11) (Cell Signaling Technology, cat. no. 5174S, 1:3000); mouse anti-b-actin (clone AC-15) (Sigma, cat. no. A1978, 1:5000), and rabbit anti-GST (Thermo Fisher, cat. no. CAB4169, 1:2000).
The following HRP-conjugated secondary antibodies were used: anti-mouse IgG (Cell Signaling Technology, cat. no. 7076S, 1:5000), and anti-rabbit IgG (Cell Signaling Technology, cat.no. 7074P2, 1:5000).
For immunofluorescence, the following antibodies were used: mouse anti-γH2AX (clone JBW301) (Millipore, cat. no. 07–131; 1:100), rabbit anti-NLRP3 (SC06–23) (Thermo Fisher, cat. no. MA5–32255; 1:100), mouse anti-cGAS (D-9) (Santa Cruz Biotechnology, cat. no. sc-515777; 1:50), mouse anti-TXNRD1 (B-2) (Santa Cruz Biotechnology, cat. no. SC-73408; 1:50), mouse anti-cGAS (Santa Cruz Biotechnology, cat. no. sc-515777, 1:50), rabbit anti-FLAG (D6W5B) (Cell Signaling Technology, cat. no. 14793; 1:400), and rabbit anti-PYCARD (Invitrogen, cat. no. PA5–50915; 1:100).
The following Alexa fluor secondary antibodies were used: Alexa Fluor™ 488 goat anti-rabbit IgG (Invitrogen, cat. no. A-11008, 1:400), Alexa Fluor™ 647 donkey anti-mouse IgG (Invitrogen, cat. no. A-32787, 1:400), Alexa Fluor™ 488 goat anti-mouse IgG (Invitrogen, cat. no. A-10680, 1:400), and Alexa Fluor™ 555 goat anti-rabbit IgG (Invitrogen, cat. no. A-21428, 1:400).
For immunohistochemistry, the following antibodies were used: mouse anti-CD45 (F155) (BD Pharmingen, cat. no. 550539; 1:100), and mouse anti-NRas (F155) (Santa Cruz Biotechnology, cat. no. sc-31; 1:100).
For immunoprecipitation, the following antibodies were used: rabbit anti-TXNRD1 (Bethyl, cat. no. A304–791A; 2 μg/mg lysate), mouse anti-cGAS (D-9) (Santa Cruz Biotechnology, cat. no. sc-515777, 2 μg/mg lysate), and rabbit anti-FLAG (D6W5B) (Cell Signaling Technology, cat. no. 14793, 1:50).
Senescence induction and SA-β-gal staining
For inducible ER-RAS model, IMR90 cells infected with lentivirus encoding a 4-hydroxy-tamoxifen (4-OHT) inducible ER:RAS construct (pLNC-ER:Ras, Addgene #67844) were selected with G418 (400 μg/ml, Gibco) for four-weeks. Cells were cultured in medium supplemented with G418 (200 μg/ml). To induce senescence, cells were treated with 4-OHT (100 nM). Oncogenic H-RASG12V-induced senescence was performed as we published44. For therapy-induced senescence, etoposide (100 μM, 48 hrs, followed by drug-free culture for 6 days) or cisplatin (250 μM, 48 hrs, followed by drug-free culture for 4 days) was used. For SA-β-gal staining, 2% formaldehyde and 0.2% glutaraldehyde in PBS were used to fix the cells. The cells were then stained at 37°C in a non-CO2 incubator in X-gal solution (150 mM NaCl, 40 mM Na2HPO4, pH 5.7, 2 mM MgCl2, 5 mM K3Fe(CN)6, 5 mM K4Fe(CN)6 and 1 mg ml−1 X-gal) overnight. For tissue SA-β-gal staining, frozen sections were fixed and stained at pH 5.5 for 5 – 8 hrs.
CCFs purification
For CCFs purification, 5 × 10⁸ cells were used to incubate in DMEM containing 10 μg/ml cytochalasin B for 30 min at 37 °C. The cell pellet was dounced and homogenized in pre-chilled lysis buffer (10 mM Tris-HCl, 2 mM magnesium acetate, 3 mM CaCl2, 0.32 M sucrose, 0.1 mM EDTA, 1 mM DTT, 0.1% NP-40, 0.15 mM spermine, 0.75 mM spermidine, 10 μg/ml cytochalasin B, pH 8.5, 4 °C). After fixation using 1% formaldehyde for 10 min, an equal volume of 1.6 M sucrose buffer (10 mM Tris-HCl, 5 mM magnesium acetate, 0.1 mM EDTA, 1 mM DTT, 0.3% BSA, 0.15 mM spermine, 0.75 mM spermidine, pH 8.0, 4 °C) was added. In a 50 ml tissue culture tube, 10 ml homogenate was added on the top of sucrose buffer gradient (20 ml and 15 ml containing 1.8 M and 1.6 M of sucrose, respectively). The gradient was subjected to centrifugation (12,000 × g) for 20 min at 4 °C. After removing top 3 ml of the gradient, the next 15 ml CCFs-containing fraction was diluted with an equal volume of ice-cold PBS. The solution was filtered through 5 μm low protein-binding durapore (PVDF) membrane (Millipore, cat. no. SLSV025LS). 5-fold ice-cold PBS was added into the CCFs fractions, which was subjected to centrifugation (12,000 × g) for 15 min at 4 °C. The pellet was collected and suspended in 200 μl ice-cold PBS buffer for subsequent analysis.
LC-MS/MS analysis of CCFs
Samples were fractionated into 3 gel regions, digested in-gel with trypsin and analyzed by LC-MS/MS using a Q Exactive Plus mass spectrometer (ThermoFisher Scientific) in-line with a NanoACQUITY UPLC system (Waters). Peptides were subjected to reversed phase separation via a 2-h gradient on a BEH C18 nanocapillary analytical column (Waters, 75 μm i.d. × 25 cm, 1.7 μm particle size). The mass spectrometer was set to scan m/z from 400 to 2000 at 70,000 resolution in positive ion mode. Data-dependent MS/MS scans were performed on the 20 most abundant ions above the threshold of 20,000 at 17,500 resolution. Single and unassigned charged ions were excluded from MS/MS analysis, and peptide match was set as preferred. Protein and peptide identifications were accomplished using MaxQuant 1.6.15.046 by searching against the UniProt human protein database (10/10/2019). Search parameters include full tryptic specificity, two missed cleavages, static carbamidomethylation of Cys, and variable oxidation of Met and protein N-terminal acetylation. Protein and peptide lists were generated with a false discovery rate of less than 1%.
Conditioned medium
DMEM medium with 0.5% FBS was used to culture senescent cells for 7 days. To generate conditioned medium, the collected medium was filtered and mixed with DMEM containing 40% FBS at a ratio of 6:1. To stimulate tumor cell growth, control or RAS-induced senescent cells were cultured in serum-free DMEM for 12 hrs. To generate conditioned medium, the collected medium was filtered and mixed with DMEM + 2% FBS at a ratio of 3:1. TOV21G ovarian cancer cells were cultured in the conditioned medium with refreshing on a daily basis and cell numbers were counted on day 7.
Antibody array analysis
Quantibody Human Inflammation Array 3 (RayBiotech, cat. no. QAH-INF-3) was used to perform analysis for secreted factors according to the manufacturer’s instructions. Cells were washed a PBS and cultured in serum-free DMEM for 48 hrs to generate medium containing secreted factors. The collected medium was filtered (0.2 μm) and incubated overnight on the array at 4 °C. Next day, the array was washed five times with Wash Buffer I followed by Wash Buffer II twice at room temperature. The biotinylated antibody cocktail was used to incubate the array for 2 hrs at room temperature. The array was washed three times with Wash Buffer I followed by Wash Buffer II twice at room temperature. Cy3 equivalent dye-conjugated streptavidin was used to incubate the array for 1 hr at room temperature. The array was washed three times with Wash Buffer I followed by Wash Buffer II twice at room temperature. Amersham Typhoon laser scanner was used to measure the signal that was quantified with NIH ImageJ software (1.48v). Cell number from which the conditioned medium was collected was used for normalization.
ISD transfection
IMR90 fibroblasts were transfected with 1 μg/ml ISD using Lipofectamine 2000 reagent. 24 hours post transfection, cells were harvested and equal number of cells with different treatments were lysed followed by 2’ 3’-cGAMP measurement using the ELISA Kit.
2’ 3’-cGAMP measurement
To measure 2′ 3′-cGAMP levels, 2′ 3′-cGAMP ELISA Kit (Cayman Chemical, cat. no. 501700) was used following the manufacturer’s instructions. 2 × 10⁶ cells were incubated in 200 μl lysis buffer (Thermo Fisher, cat. no. 78501) on ice for 30 min. The lysis was subjected to centrifugation for 30 min at 12,000 g and the supernatant was used for measurement.
cGAS activity assay
Recombinant cGAS (Cayman Chemical, cat. no. 22810, 0.3 μg) was incubated, in the presence or absence of recombinant TXNRD1 (0.3 μg) and/or Tri-1 (2.5 nmol) as indicated, with Cy3-labeled (ISD)2 dsDNA (1 pmol) in 20 μl in cGAMP synthesis buffer (20 mM HEPES pH 7.5, 5 mM MgCl2, 2 mM ATP, 2 mM GTP) at 37 °C for 90 min. 2’ 3’-cGAMP was extracted with 80% methanol and analyzed using the ELISA kit (Cayman Chemical, cat. no. 501700).
Immunoblotting and immunofluorescence
For immunoblotting, 1 X sample buffer (10% glycerol, 2% SDS, 0.01% bromophenol blue, 0.1 M dithiothreitol and 62.5 mM Tris-HCl pH 6.8) was used for protein preparation. Protein separation was performed by SDS–PAGE. Polyvinylidene fluoride membrane (Millipore) was used for protein transfer. 5% non-fat milk in TBS/0.1% Tween 20 (TBST) was used for membrance blocking (1 hr at room temperature). Primary antibody was incubated at 4°C overnight in 4% BSA/TBS + 0.025% sodium azide. TBST was used to wash membrance for 10 min at room temperature. Following incubation with HRP-conjugated secondary antibodies, the membrane was washed in TBST for 10 min at room temperature for four times. To visualize the signal, SuperSignal West Pico PLUS Chemiluminescent Substrate (Thermo Fisher) was used.
For immunofluorescence staining, 4% PFA was used to fix cells or tissue for 15 min at room temperature. After permeabilization with 0.2% Triton X-100 in PBS for 20 min, the fixed cells or tissues were blocking with 1% BSA in PBS for 20 min at room temperature. Primary antibody incubation was performed at 4°C overnight. After Alexa Fluor-conjugated secondary antibody (Life Technologies) incubation for 1 hr at room temperature, 1 μg ml−1 4,6-diamidino-2-phenylindole (DAPI) was used for couter staining (5 min at room temperature). Leica TCS SP5 II scanning confocal microscope was used for imaging. Leica Application Suite X (LAS X) software and NIS elements Ar software were used for analysis.
Co-immunoprecipitation (Co-IP)
For endogenous TXNRD1 and cGAS interaction, ice-cold lysis buffer containing 20 mM Tris pH 8.0, 137 mM NaCl, 1% NP-40 and 2 mM EDTA, supplemented with protease inhibitor cocktail (Roche, cat. no. 4693116001) was used with gentle rotation at 4 °C for 30 min. The supernatant was incubated with anti-TXNRD1 antibody at 4 °C overnight, followed by adding 20 μl protein A/G-coupled agarose beads. The lysate beads mixture was incubated at 4 °C with gentle rotation for 2 hr. The mixture was then washed three times using a magnetic stand before adding 2 X SDS loading buffer for immunoblot analysis.
Recombinant protein purification
Sequence encoding the human TXNRD1 (NM182729) was inserted into pGEX-4T-1 vector, in which TXNRD1 contained an N-terminal GST tag followed by a precession protease cleavage site. Recombinant protein was expressed in Escherichia coli BL21 (DE3) pRIL strain. The cells were grown at 37 °C until the OD600 reached 0.6, and then were induced by addition of 0.5 mM isopropyl β-d-1-thiogalactopyranoside (IPTG) at 16 °C for 16 hrs. GST-fusion TXNRD1 was purified by glutathione beads and eluted with 20 mM reduced glutathione. Then the tagged protein was further purified by size exclusion chromatography (SEC) using a Superdex 200 10/300 GL (GE Healthcare) column with a buffer contain 20 mM HEPES-NaOH (pH7.5), 400 mM NaCl. To get GST protein, tobacco etch virus (TEV) protease was supplemented with a molar ratio of enzyme:substrate = 1:30 and incubated at 4 °C overnight. The cleaved product was further purified by reverse GST column and an additional round SEC with the same buffer as tagged protein. The final product was analyzed by sodium dodecyl sulfate polyacrylamide gel electrophoresis (SDS–PAGE) and concentrated with an Amicon Ultra Centrifugal concentrator (Millipore).
Mononucleosome reconstitution
The DNA for the in vitro nucleosome assemblies was obtained by PCR as previously reported47. Briefly, Cy5-labelled primers were used to amplify a 228 bp-long region occupied by a single nucleosome (mm9 chr12: 45445246–45445473) named NRCAM_228 bp:
5’-GACCAACAGATCCCCCATCAAGGAGTGGCACAGTATCAATTACTTCTGAAACAGATGACTCCCAGCAGCTGCTGCCTGTGGCCCACAGGGCTTCCTGCCCTGCATGACAGCTGCACATCACATCCTGTGGTCATACTACTTCAGCCGCTTCTACGGCCAGATACAAAAGTGGGTGGGGAACATAGGCAAGCCTACCAGTTCCAAGGTGTTATAAATCCCAGACGCATT-3’
The amplified DNA product was purified by ion exchange chromatography (IEX) to eliminate proteins and oligonucleotides using Cytiva’s ÄKTApure FPLC machine and a Capto HiRes Q 5/50 column. Buffer A (20 mM Tris-HCl pH 7.0) and Buffer B (20 mM Tris-HCl pH 7.0, 2 M NaCl) were used in a gradient from 25 % to 45 % of the latter over 40 column volumes (CV). The fractions containing the DNA of interest were then pooled, ethanol precipitated, and re-suspended in TE to concentrate the DNA and eliminate excess salt. Nucleosomes were then assembled by slow salt dialysis. Initially, the NRCAM_228 bp DNA was mixed with recombinant core histones (H3, H4, H2A, and H2B) purified from E. coli and reconstituted into octamers at a 1:1.5 DNA:octamer molar ratio in an initial buffer containing 10 mM Tris-HCl pH 7.5, 1 mM EDTA, 0.1 % BME, and 2 M NaCl. The sample was then injected in a 7,000 MWCO dialysis cassette (ThermoFisher’s Slide-A-Lyzer) and submerged in a dialysis buffer containing 2M NaCl (10 mM Tris-HCl pH 7.5, 1 mM EDTA, 1 mM BME, 2 M NaCl). Then, the dialysis solution was slowly diluted with dialysis buffer containing no NaCl at 4 °C overnight until the final NaCl concentration reached 600 mM. The dialysis solution was then replaced by fresh dialysis buffer containing 10 mM NaCl twice, followed by incubation at 4 °C for 1 hr each time. The final product was concentrated using a 50,000 MWCO centrifugal filter unit (MilliporeSigma’s Amicon Ultra) and quantified using Thermo Fischer’s Nanodrop.
GST pull-down assay
GST pull-down assay was performed using Pierce™ GST Protein Interaction Pull-Down Kit (Thermo Fisher, cat. no. 21516). Briefly, equal amount of GST tag or GST-TXNRD1 proteins were immobilized to glutathione agarose by incubation at 4 °C overnight with gentle rotation. After a total of five washes, recombinant cGAS protein with or without either dsDNA or mononucleosome was added and incubated at 4 °C for at least 1 hr with gentle rotation. After a total of five washes, 250 μl glutathione elution buffer was added and incubated at room temperature for 5 min with gentle rotation. Eluted samples were analyzed by immunoblotting. For groups with Tri-1 treatment, Tri-1 was added 1 hr before cGAS addition and incubated at 4 °C with gentle rotation.
Thioredoxin reductase assay
The enzymatic activity measurement was performed using Thioredoxin Reductase Assay Kit (Colorimetric) (Abcam, cat. no. ab83463). Briefly, 20 mg mouse ovary tissues or 2 × 10⁶ cells were homogenized in 100 μl cold Assay Buffer on ice. The lysates were centrifuged at 10,000 × g for 15 min at 4 °C and the supernatant was collected for assay. 200 μg protein of each sample was added into each well, the thioredoxin reductase assay was performed following the manufacturer’s instructions.
Electrophoretic mobility shift assays
Recombinant cGAS was incubated, in the presence or absence of recombinant TXNRD1, Tri-1 or auranofin, with Cy3-labeled (ISD)2 dsDNA in the reaction buffer (25 mM HEPES, 150 mM NaCl, 5 % glycerol) at room temperature for 20 min. The mixtures were loaded on 1% agarose gel using an electrophoresis buffer (45 mM Tris, 45 mM boric acid, pH 10.0). The gels were then subjected to analysis using Amersham Typhoon laser scanner.
In vivo mouse models
For xenograft mouse model, TOV21G:senescent fibroblasts at a ratio of 1:1 were mixed and a total of 2 × 10⁶ cells were suspended in 100 μl PBS:Matrigel (1:1). The cells were injected subcutaneously into the right dorsal flank of female immunocompromised non-obese diabetic/severe combined immunodeficiency (NOD/SCID) gamma (NSG) mice (6–8-week-old). Tumor size was measured at the indicated time points. Tumor size was determined using the following equation: tumor size (mm3) = [d2 × D]/2 with d=shortest and D=longest diameters.
For hydrodynamic tail-veil injection, endotoxin-free transposon-based construct expressing N-RasG12V (25 μg) together with endotoxin-free transposase plasmid (5 μg) were mixed for injection. Female C56BL/6 mice (eight-week-old, Charles Rivers Laboratory) were injected at a volume of 10% of the mouse body weight within 5 – 8 seconds29,48. Mouse livers were collected 6- or 14-days post injection and embedded in OCT (Fisher, cat. no. 23–730-571) followed by flesh frozen.
For the TXNRD1 inhibitors treatment, the aged mice (22 months) were obtained from National Institute on Aging-aged rodent colonies and were randomly grouped into three groups, injected intraperitoneally once every 3 days with 10 mg kg−1 Tri-1 in solvent (10% DMSO + 90% corn oil), or 5 mg kg−1 auranofin in solvent, or solvent alone in a 100 μl volume for 7 times. The mice were euthanized, and the tissues were harvested. The investigators were blinded to group allocation during data collection and analysis.
Mouse serum levels of IL6 and TNF-α measurement
Mouse serum levels of IL6 and TNF-α were determined using ELISA kits (Proteintech, cat. no. KE10007 and KE10002). Briefly, mouse serum was diluted at 1:8 for IL6 measurement and 1:16 for TNF- α measurement. 100 μL of diluted serum was added to each well and incubated at 37 °C for 2 hrs. After a total of four washes, 100 μL of detection antibody solution was added to each well and incubated at 37 °C for 1 hr. After a total of four washes, 100 μL of Streptavidin-HRP solution was added to each well and incubated at 37 °C for 40 min. After a total of four washes, 100 μL of TMB substrate solution was added to each well and incubated at room temperature for 15–20 min with protection from light. 100 μL of Stop solution was added to each well and absorbance at a wavelength of 450 nm was recorded on a microplate reader.
Immunohistochemistry
4% PFA in PBS was used to fix mouse liver tissues at 4 °C. In addition, fresh liver tissues were embedded in OCT compound for cryosection. For antigen retrieval in immunohistochemistry staining, the slides were deparaffinized, rehydrated, quenched in 0.6% hydrogen peroxide in methanol for 15 min and boiled for 40 min in 10 mM citrate (pH 6.0) buffer. The sections were incubated with blocking buffer (5% serum, 1% BSA and 0.5% Tween 20 in PBS) for 1 hr at room temperature and then incubated with primary antibodies overnight at 4 °C. To visualize the signal, the sections were subsequently incubated with biotinylated secondary antibodies, followed by ABC solution and developed with 3,3′-diaminobenzidine (Vector Laboratories). Haematoxylin was used for counterstaining. The slides were then dehydrated and mounted with Permount (Thermo Fisher).
Bioinformatic analysis
RNA-seq data was aligned using bowtie2 v2.5.149 algorithm against hg19 human or mm10 mouse genome version and RSEM v1.2.12 software50 was used to estimate read counts and RPKM values using gene information from human Ensemble transcriptome version GRCh37.p13 or mouse Ensemble transcriptome version GRCm38.89. Raw counts were used to estimate significance of differential expression difference between any two experimental groups using DESeq2 v1.30.151. Overall gene expression changes were considered significant if passed FDR<5% threshold unless stated otherwise. Gene set enrichment analysis was done using QIAGEN’s Ingenuity® Pathway Analysis software v2022 (IPA®, QIAGEN Redwood -City, www.qiagen.com/ingenuity) using “Upstream Regulators” options. Results that passed FDR<5% threshold and had predicted activation state were reported. Proteins from LC-MS/MS experiment that in both independent replicates were detected with at least 5 peptides at intensity level of CCF condition at least 5 fold over control (n=512 proteins) were subject for enrichment analysis using DAVID 202152 and INTERPRO domain results that passed FDR<10%, at least 2-fold enrichment, at least 10 proteins were reported. Significance of overlaps was estimated using Hypergeometric test.
Statistics and Reproducibility
No statistical test was used to pre-determined the sample sizes, but our sample sizes are similar to those reported in previous publications3,43,48. The sample size for each experiment is stated in figure legends. Data distribution was assumed to be normal but this was not formally tested. Experiments were repeated at least three times independently with similar results unless otherwise stated in the figure legends. All statistical analyses were conducted using Excel version 16.79.1 (Microsoft 365) or GraphPad Prism 9 (GraphPad). All bar graphs show mean values with error bars (s.e.m. as defined in figure legends). An unpaired two-tailed Student’s t-test was used for comparison between two groups.
Extended Data
Extended Data Figure 1: Purification of CCFs from oncogene-induced senescent cells.
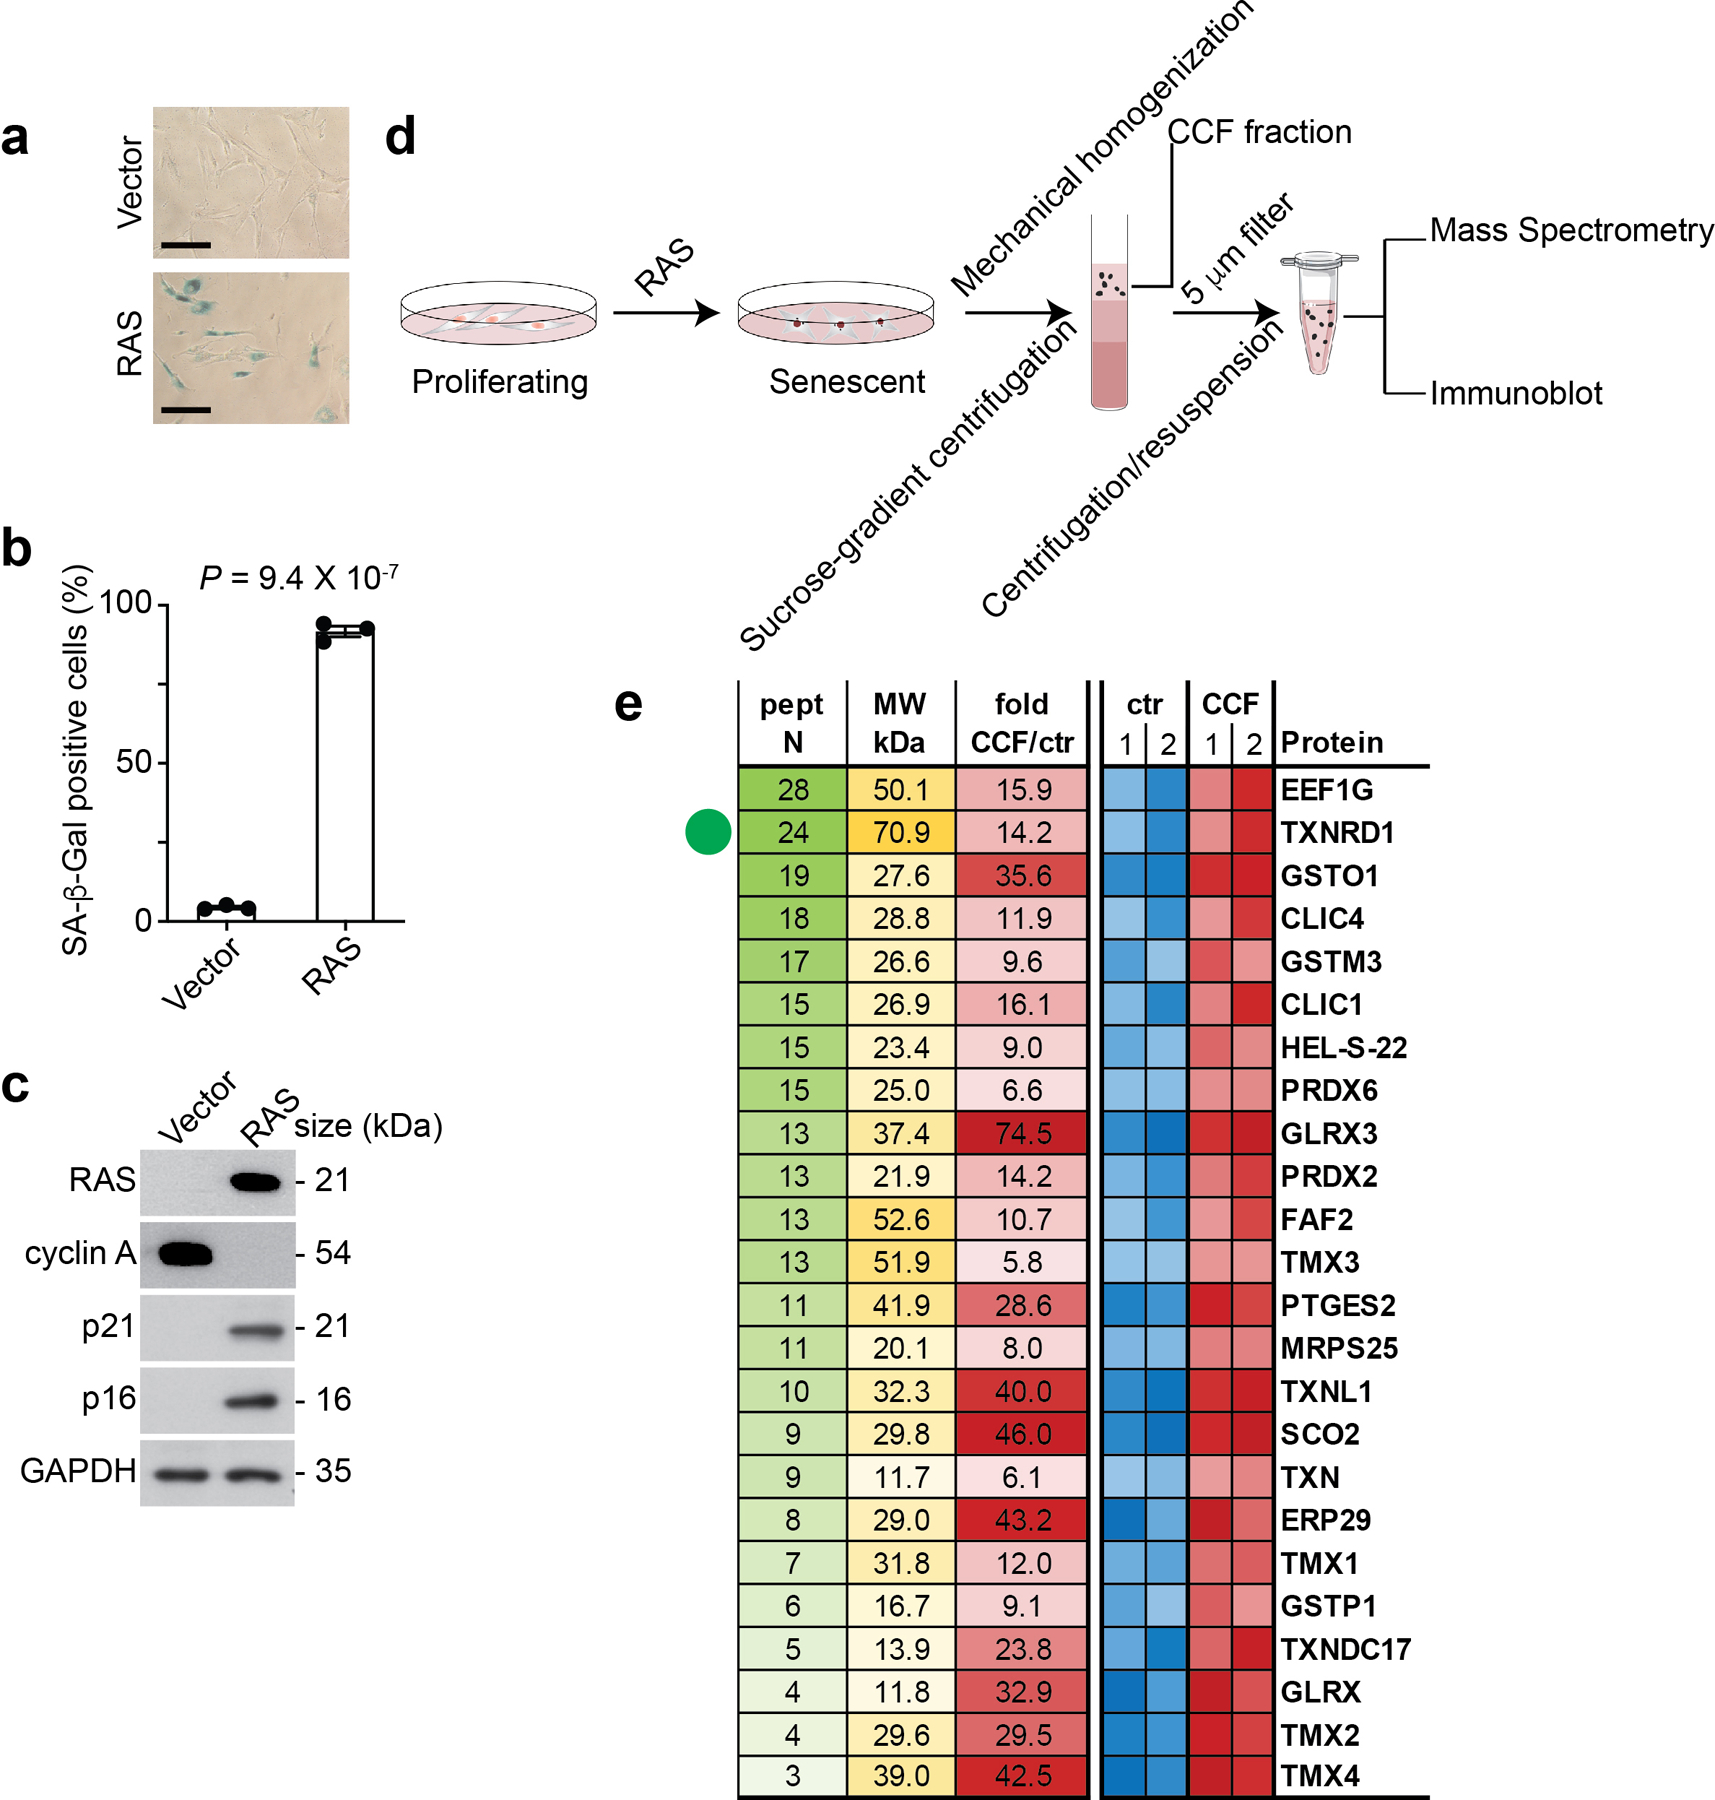
a-c, IMR90 cells were induced into senesce by oncogenic H-RASG12V and were subjected to SA-β-gal staining (a). SA-β-gal positive cells were quantified in the indicated groups (b). Expression of the indicated proteins in the indicated control senescent cells was analyzed by immunoblot (c). Scale bar = 100 μm.
d, Schematics of the protocol used for purification of CCFs.
e, Intensity heatmap of the thioredoxin-related proteins enriched in CCFs. Sorted by number of the detected peptides with two independent biological repeats.
Data represent mean ± s.e.m. n = 3 biologically independent experiments unless otherwise stated. P-values were calculated using a two-tailed t test.
Extended Data Figure 2: TXNRD1 localizes into CCFs during senescence.
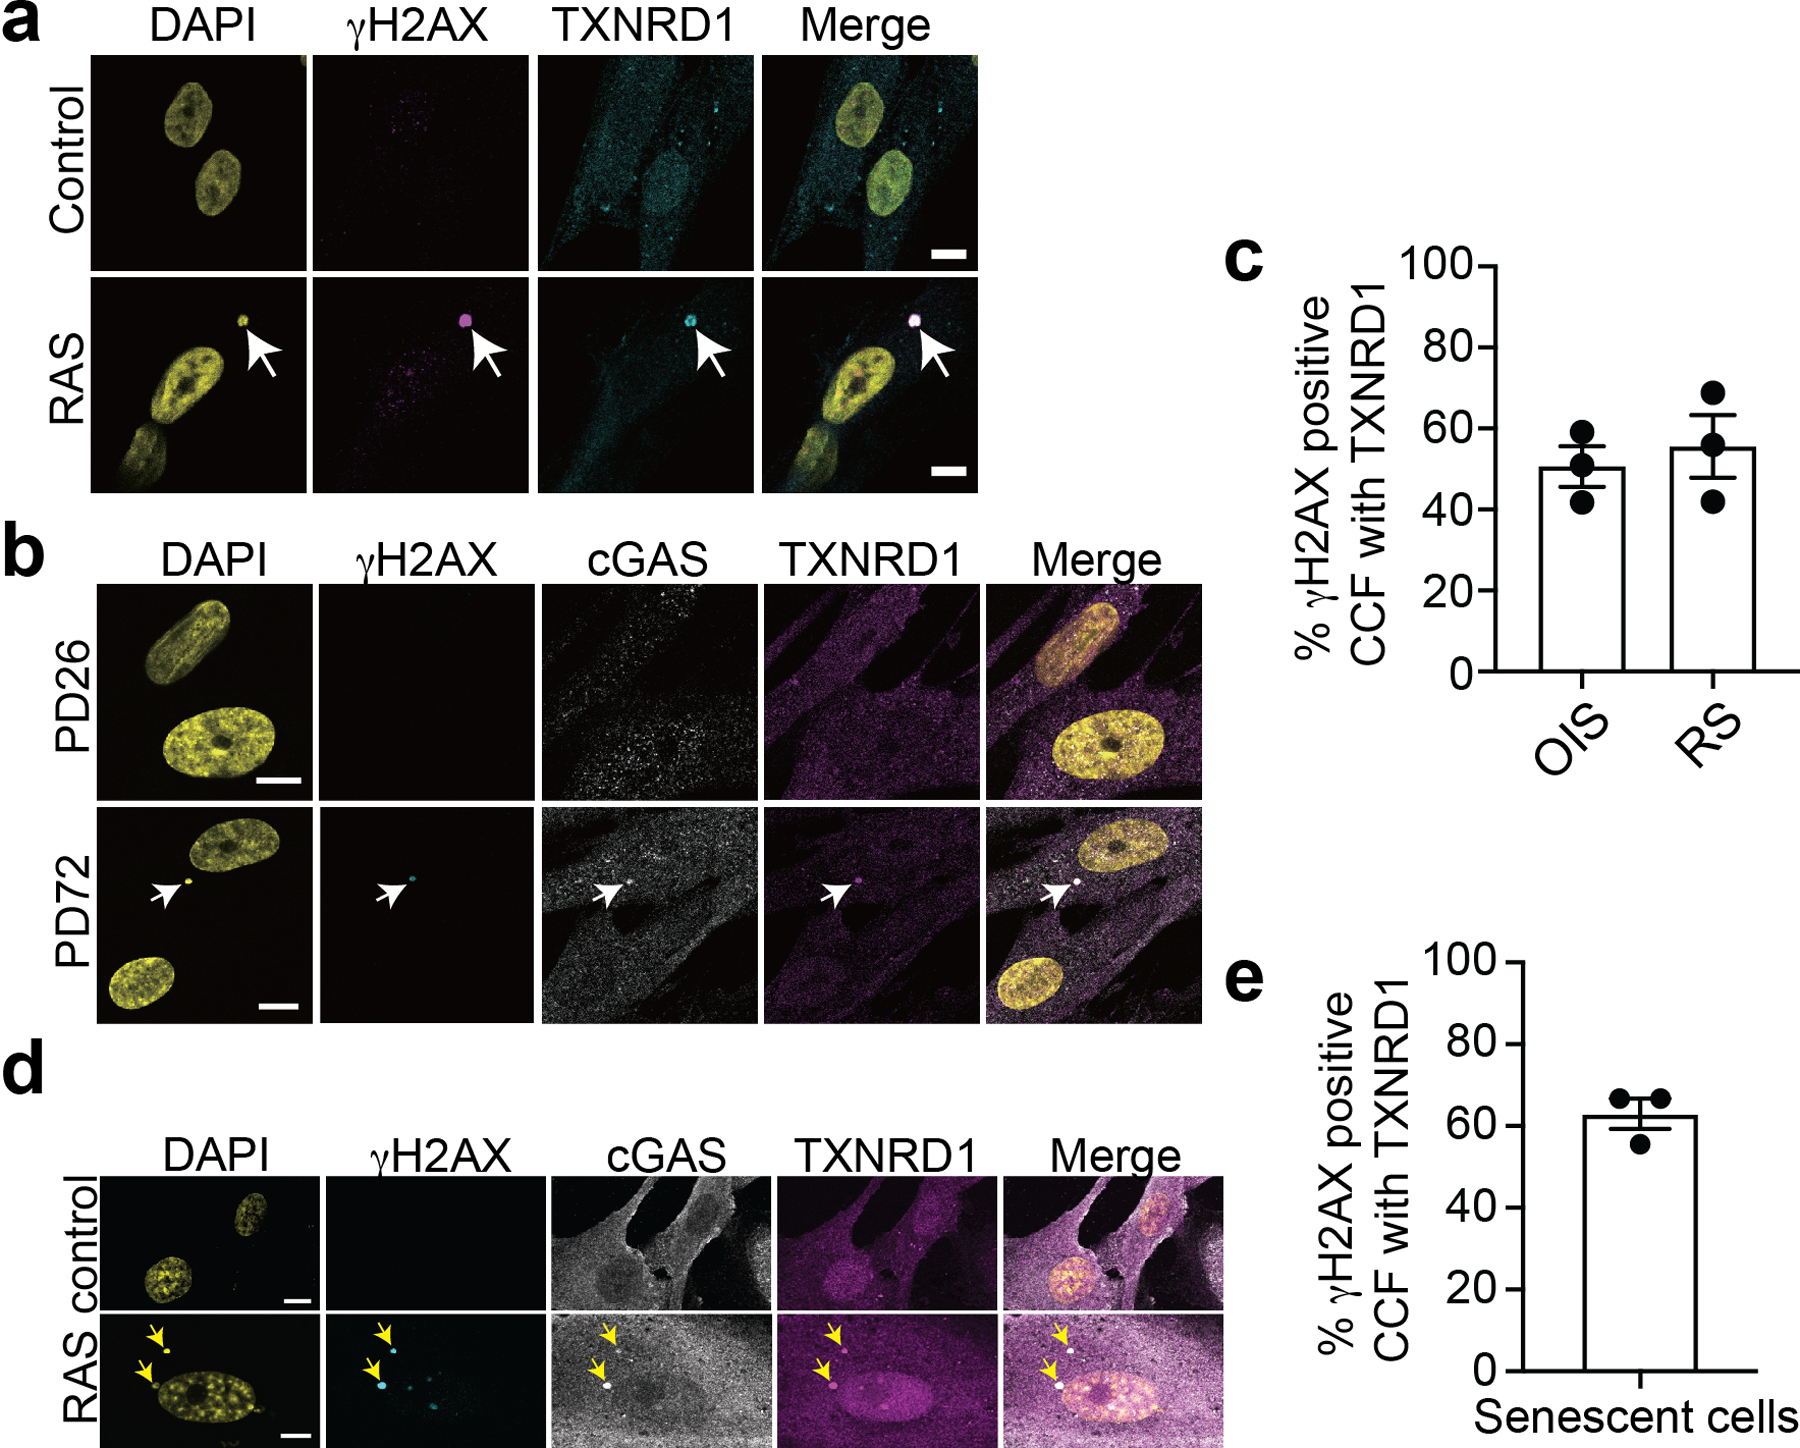
a, Representative images of immunostaining for γH2AX and TXNRD1 in control and oncogenic RAS-induced senescent IMR90 cells. The arrow indicates an example of γH2AX and TXNRD1 positive CCFs in RAS-induced senescent cells. Scale bar = 10 μm
b, Representative images of immunostaining for γH2AX, cGAS and TXNRD1 in young (PD26) and replicative senescent (PD72) IMR90 cells. The arrow indicates an example of γH2AX, cGAS and TXNRD1 positive CCFs in replicative senescent cells. Scale bar = 10 μm
c, Quantification of (a) and (b).
d,e, Representative images of immunostaining for γH2AX, cGAS and TXNRD1 in control and oncogenic RAS-induced senescent BJ human fibroblasts. The arrows indicate examples of γH2AX, cGAS and TXNRD1 positive CCFs in RAS-induced senescent cells (d). γH2AX-positive CCFs that are positive for TXNRD1 in senescent BJ cells were quantified (e). Scale bar = 10 μm
Data represent mean ± s.e.m. n = 3 biologically independent experiments.
Extended Data Figure 3: Inhibition of TXNRD1 doesn’t affect senescence-associated cell growth arrest.
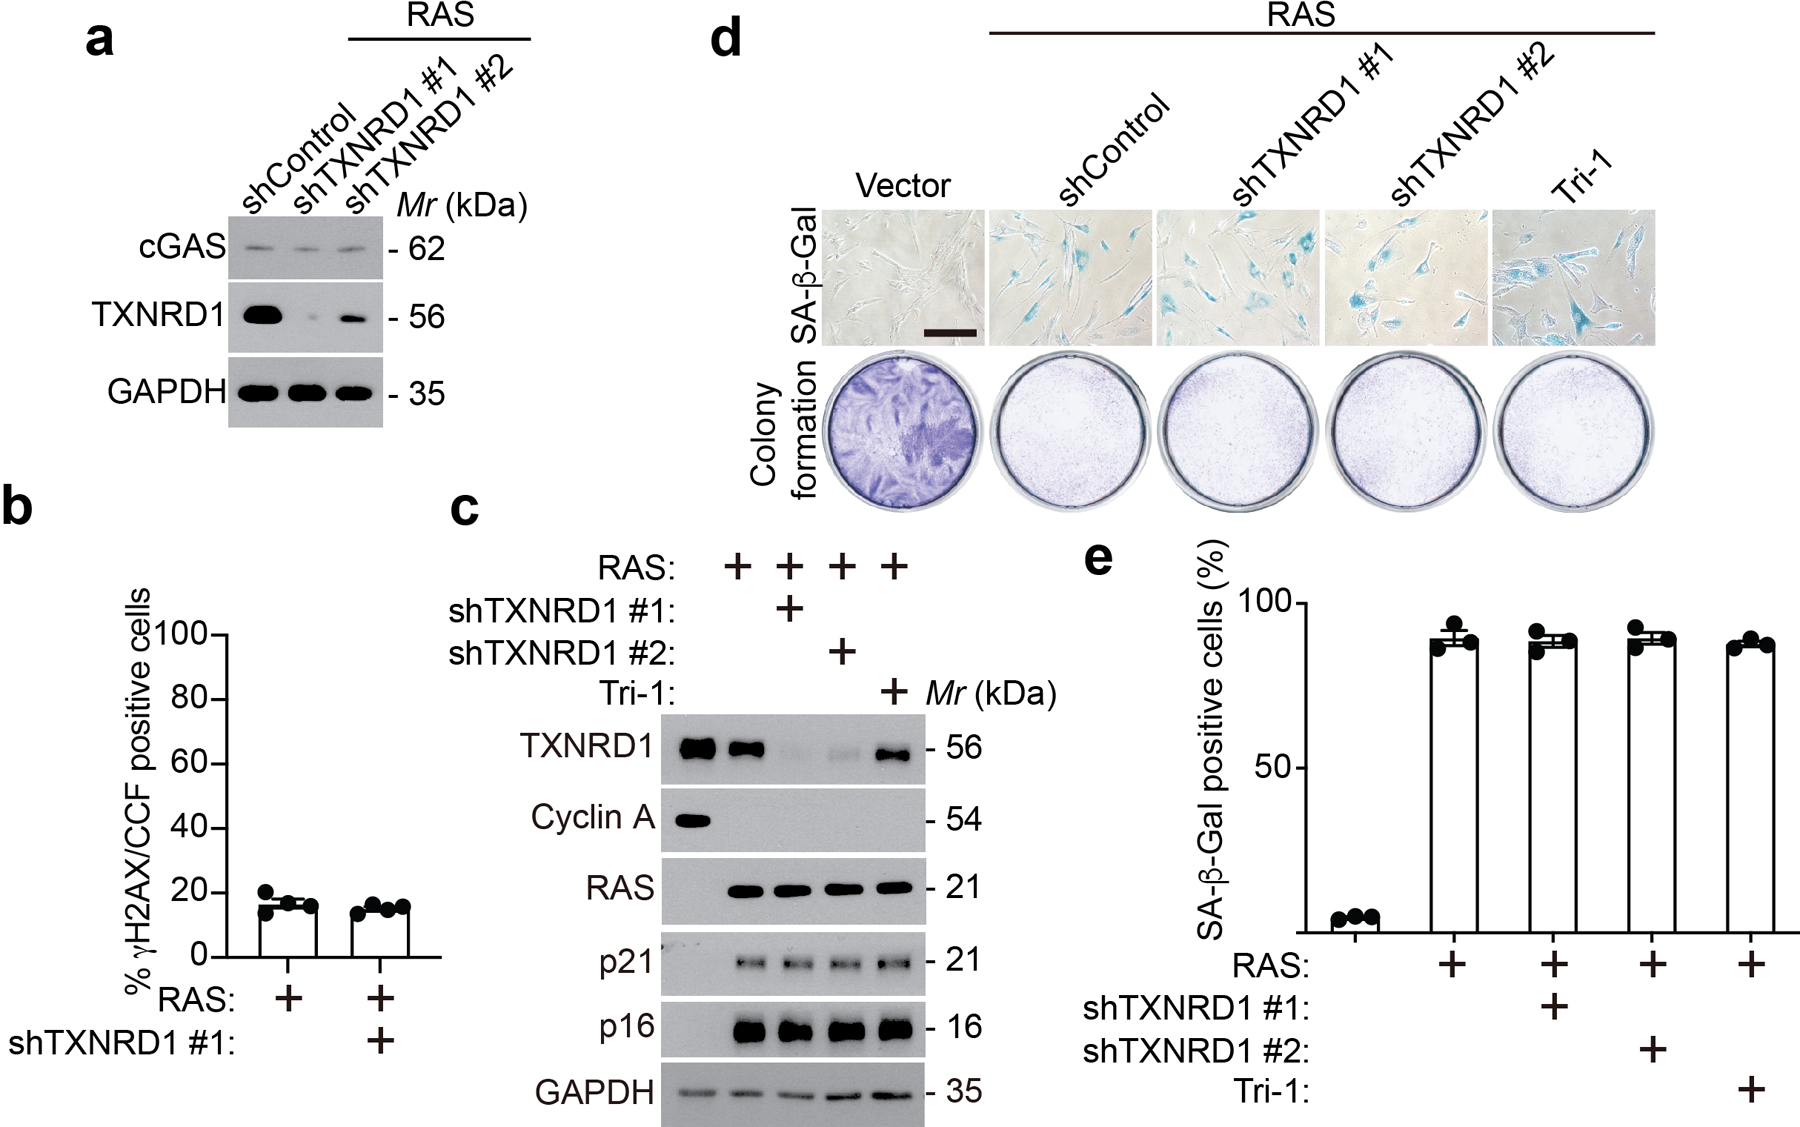
a, Immunoblot of the indicated proteins in oncogenic RAS-induced senescent IMR90 cells with or without TXNRD1 knockdown.
b, γH2AX positive CCFs were quantified in oncogenic RAS-induced senescent IMR90 cells with or without TXNRD1 knockdown. n = 4 biologically independent experiments.
c, Immunoblot of the indicated protein in control proliferating and oncogenic RAS-induced senescent IMR90 cells with or without TXNRD1 knockdown or treatment with a pharmacological TXNRD1 inhibitor Tri-1 (5 μM).
d,e, Control and oncogenic RAS-induced senescent IMR90 cells with or without TXNRD1 knockdown or treatment with a pharmacological TXNRD1 inhibitor Tri-1 (5 μM) were subjected to SA-β-gal staining or colony formation assays (d). SA-β-gal positive cells were quantified in the indicated groups (e). Scale bar = 100 μm. n = 3 biologically independent experiments.
Data represent mean ± s.e.m.
Extended Data Figure 4: TXNRD1 is required for cGAS-STING activation during therapy-induced senescence.
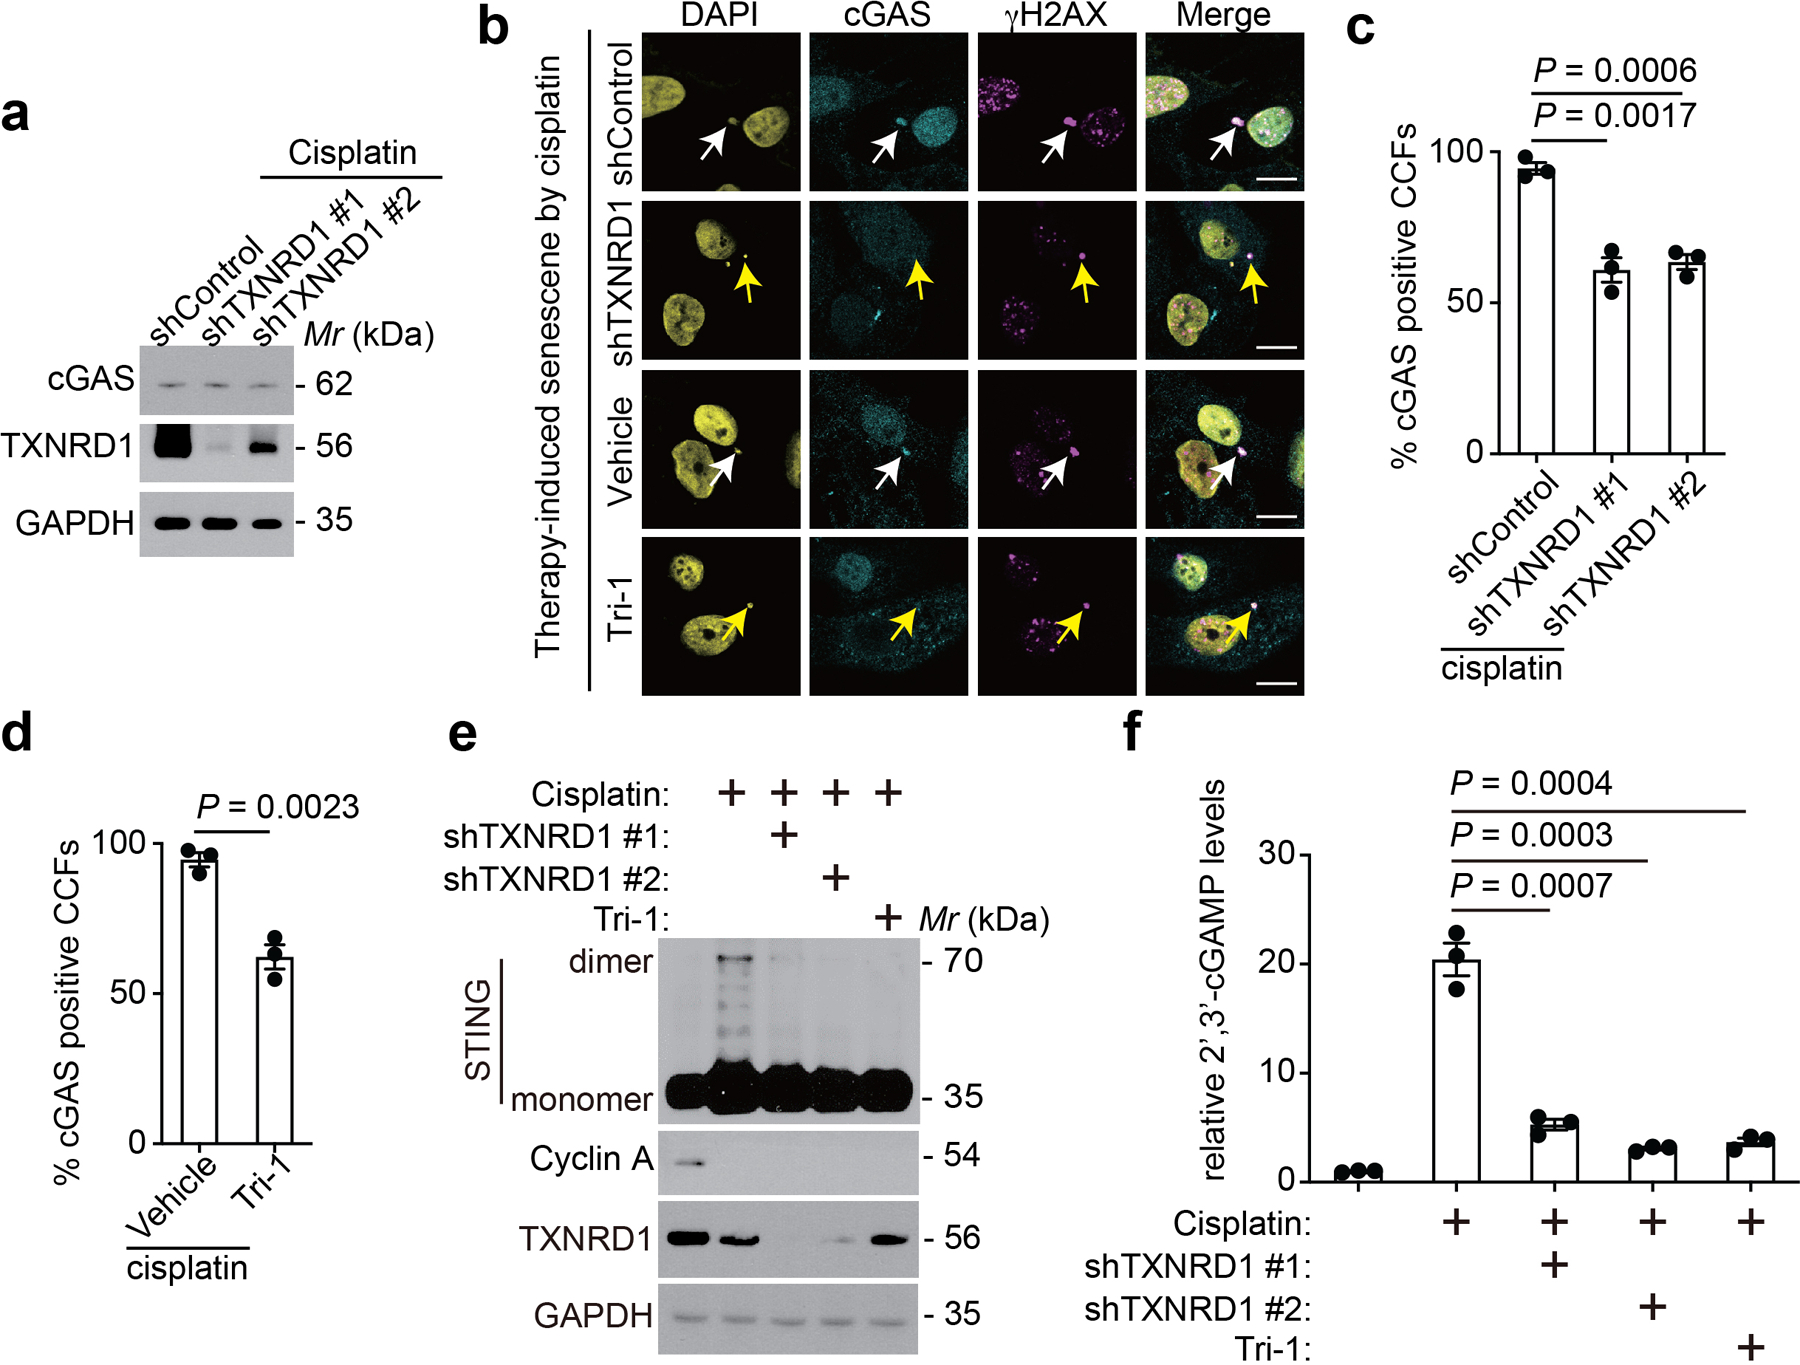
a, Immunoblot of the indicated proteins in cisplatin-induced senescent PEO1 cells with or without TXNRD1 knockdown.
b-d, Representative images of immunostaining for cGAS and γH2AX in cisplatin-induced senescent PEO1 cells with or without TXNRD1 knockdown or treatment with Tri-1 or vehicle control (b). White arrows indicate examples of cGAS and γH2AX positive CCFs in control cells, while the yellow arrows indicate examples of cGAS negative, γH2AX positive CCFs in TXNRD1 knockdown or Tri-1 treated cells. γH2AX-positive CCFs that are positive for cGAS from senescent PEO1 cells with or without TXNRD1 knockdown were quantified (c). γH2AX-positive CCFs that are positive for cGAS from senescent PEO1 cells with or without TXNRD1 inhibitor Tri-1 treatment were quantified (d). Scale bar = 10 μm.
e,f, Immunoblot of the indicated protein in control and cisplatin-induced senescent PEO1 cells with or without TXNRD1 knockdown or treatment with a pharmacological TXNRD1 inhibitor Tri-1 (5 μM) (e). In addition, cellular 2’ 3’-cGAMP levels were measured in the indicated cells (f).
Data represent mean ± s.e.m. n = 3 biologically independent experiments. P-values were calculated using a two-tailed t test.
Extended Data Figure 5: TXNRD1 inhibition during senescence induction suppresses the SASP.
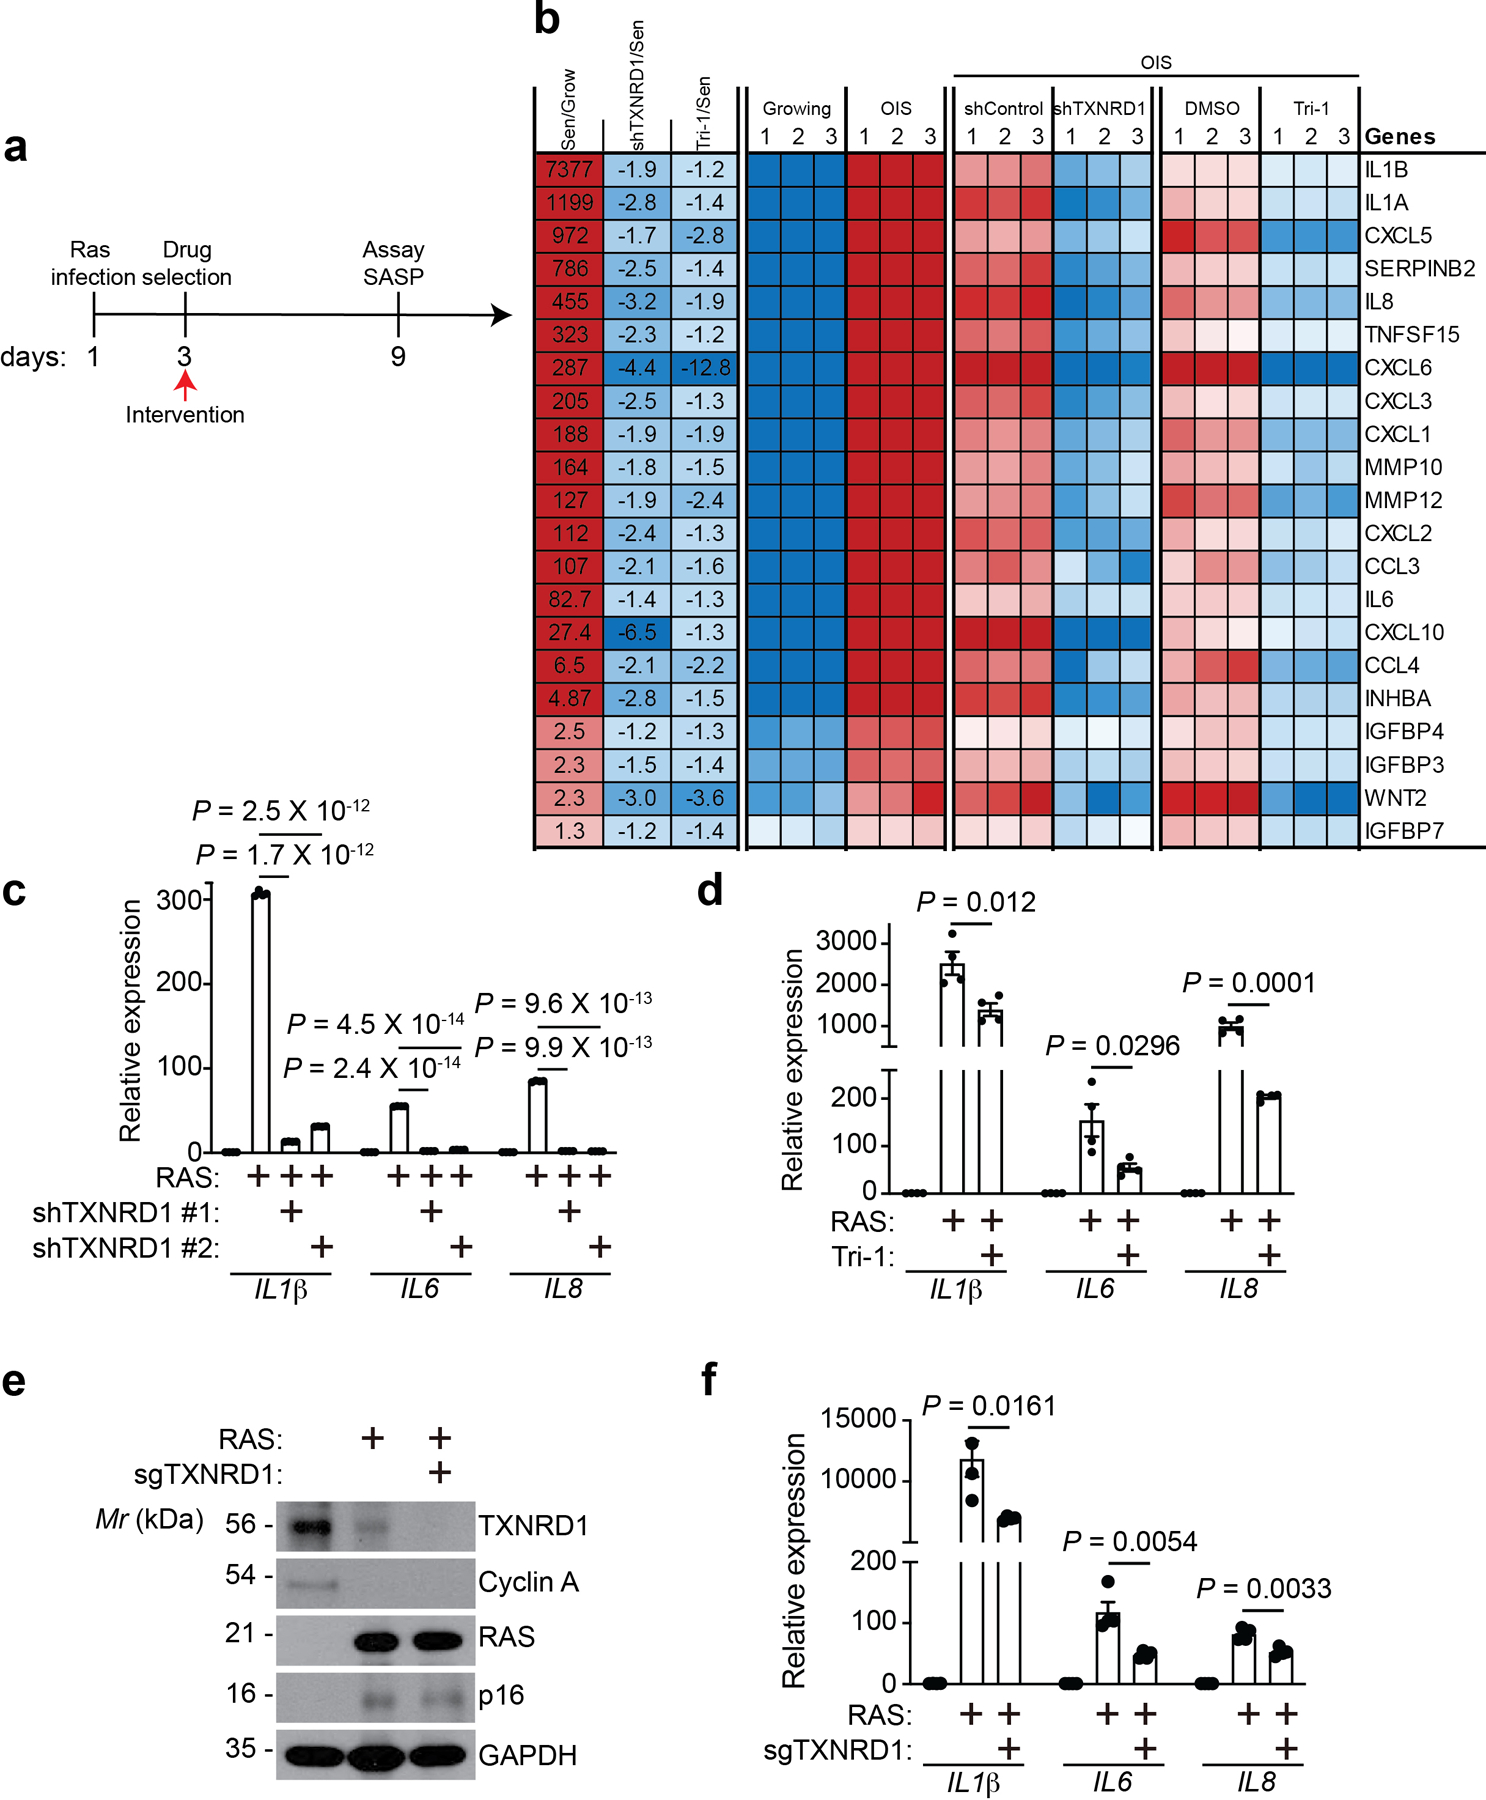
a, Schematic of experimental design for determining the effects of TXNRD1 inhibition during induction of senescence in IMR90 cells.
b, Heatmap of the SASP genes that were significantly suppressed by both TXNRD1 knockdown and Tri-1 treatment based on RNA-seq analysis. The relative expression levels per replicate and average fold change differences are shown (n = 3 biologically independent experiments).
c,d, Expression of the indicated SASP genes in control and oncogenic RAS-induced senescent IMR90 cells with or without TXNRD1 knockdown (c) or Tri-1 treatment (d) was determined by RT-qPCR. n = 4 biologically independent experiments.
e,f, Expression of the indicated proteins in oncogenic RAS-induced senescent IMR90 cells with or without TXNRD1 knockout was determined by immunoblot (e), and expression of the indicated SASP genes was determined by RT-qPCR (f).
Data represent mean ± s.e.m. n = 3 biologically independent experiments unless otherwise stated. P-values were calculated using a two-tailed t test.
Extended Data Figure 6: TXN knockdown does not affect cGAS localization and activity.
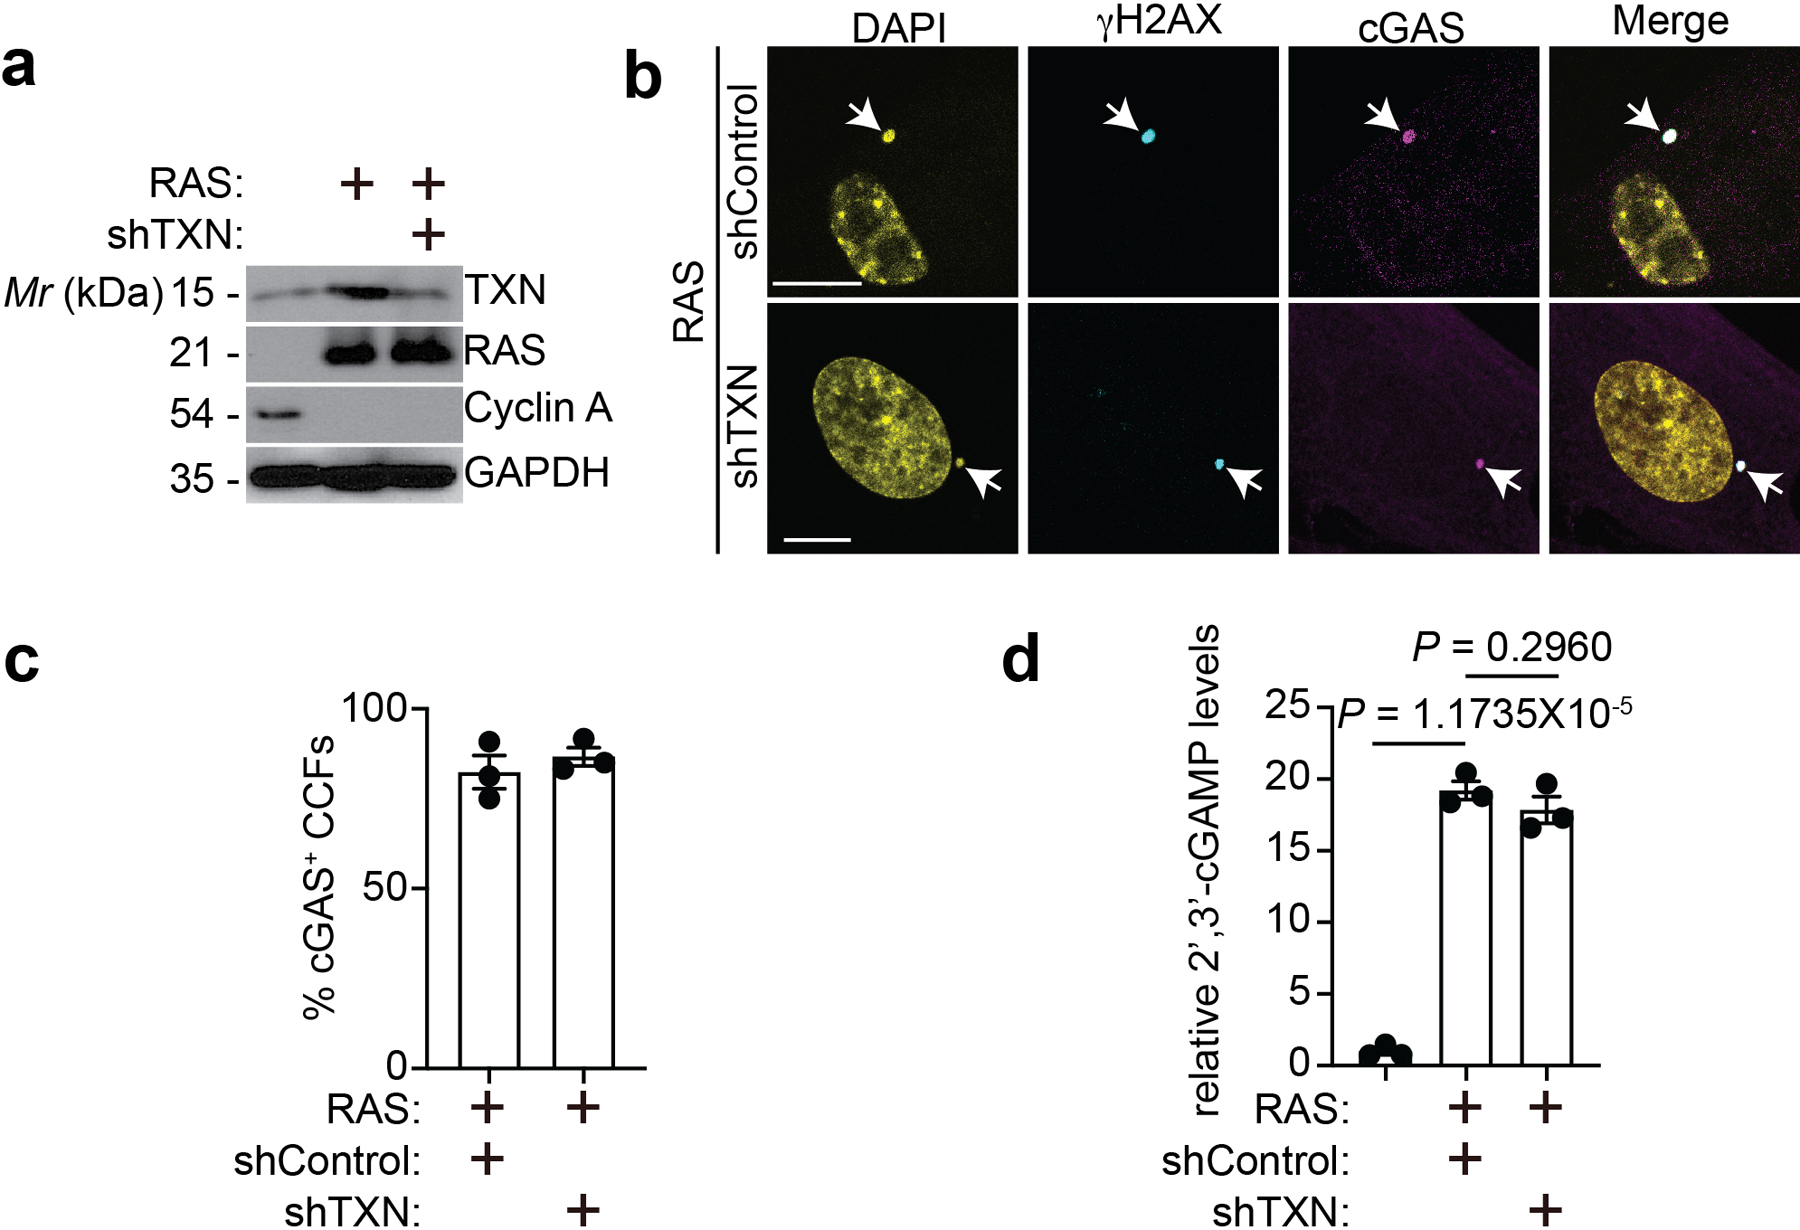
a-d, Expression of the indicated proteins in IMR90 cells induced to undergo senescence by oncogenic RAS expressing shControl or shTXN (a). The indicated cells were stained for γH2AX and cGAS. DAPI counter staining was used to visualized nuclei. Arrows point to examples of cGAS positive CCFs (b), which was quantified (c). Further, 2’3’-cGAMP levels in the indicated cells were quantified (d). Scale bar = 10 μm
Data represent mean ± s.e.m. n = 3 biologically independent experiments.
Extended Data Figure 7: TXNRD1 is required for SASP function in vivo.
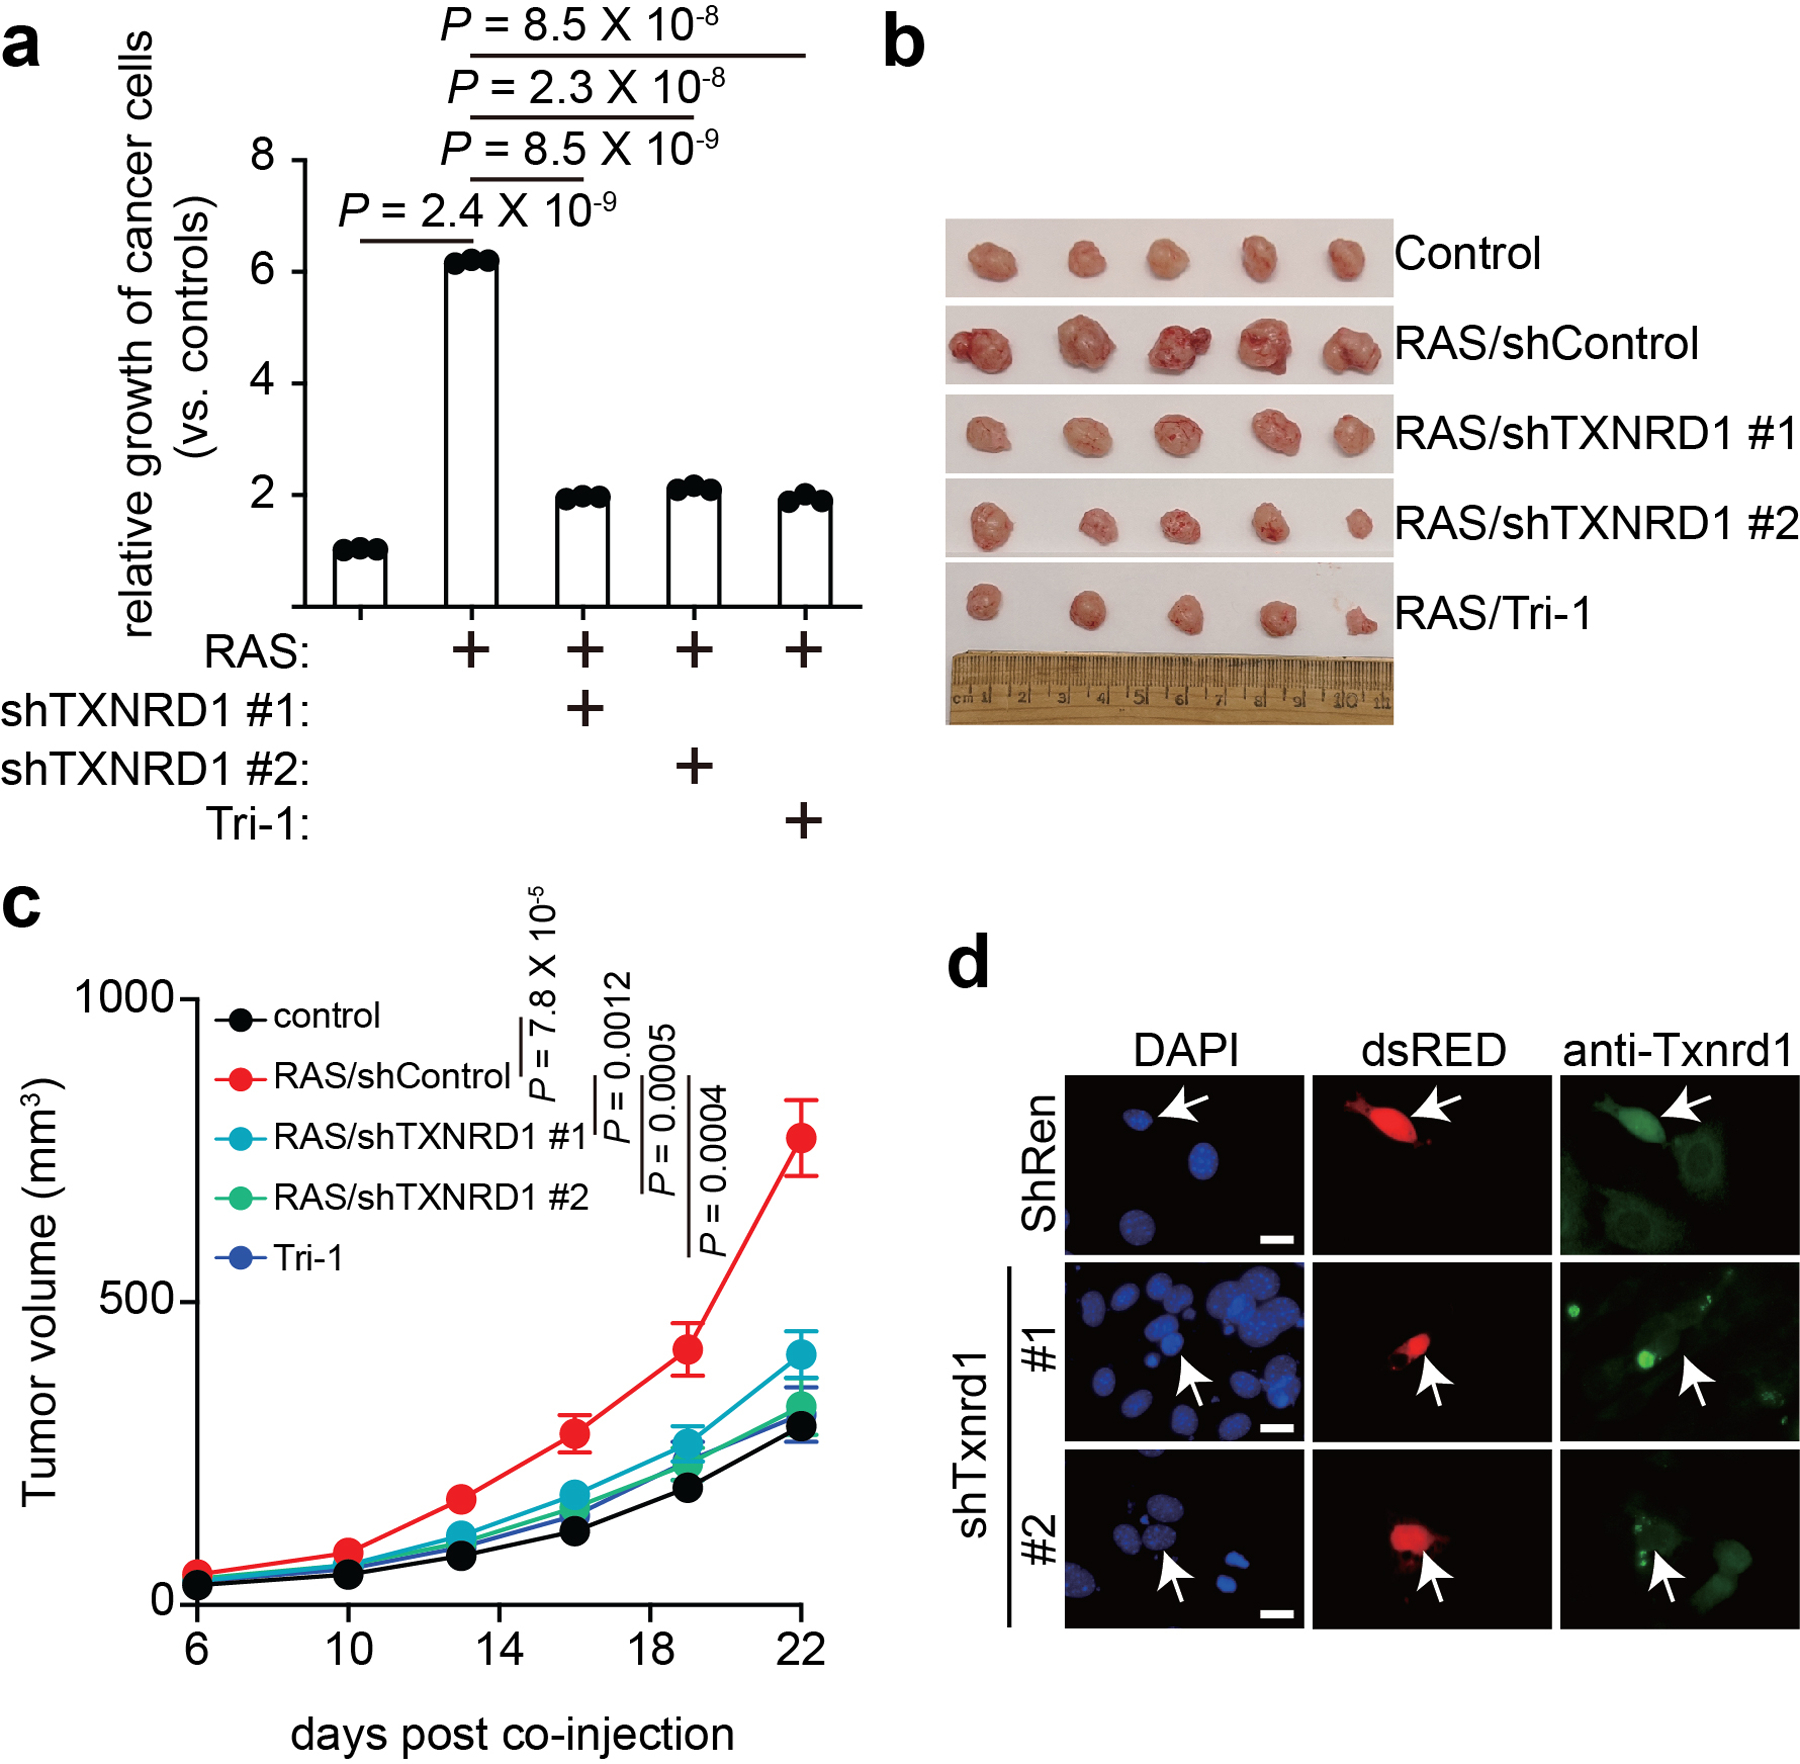
a, TOV21G ovarian cancer cell growth in conditioned medium collected from control and senescent IMR90 cells with or without TXNRD1 knockdown or Tri-1 treatment. After 7 days of incubation, the cell numbers were determined and normalized to the numbers of the cells cultured in conditioned media collected from control proliferating IMR90 cells. Data represent mean ± s.e.m. n = 3 biologically independent experiments unless otherwise stated. P-values were calculated using a two-tailed t test.
b,c, TOV21G and oncogene-induced senescent IMR90 cells with or without TXNRD1 inhibition were subcutaneously co-injected into the right dorsal flank of 6–8-week-old NSG female mice (n = 5 biologically independent mice per group). Shown are images of tumors dissected in the indicated groups at the end of experiments (b). Tumor growth in the indicated treatment groups was measured at the indicated time points (c). Data represent mean ± s.e.m.
d, Validation of Txnrd1 knockdown by immunostaining in mouse NIH 3T3 cells. Arrows point to dsRed-expressing shRen control, shTxnrd1 #1 and shTxnrd1 #2. Scale bars = 10 μm. The experiment was repeated twice with similar results.
Extended Data Figure 8: Tri-1 suppresses NLRP3 positivity in replicative senescent cells.
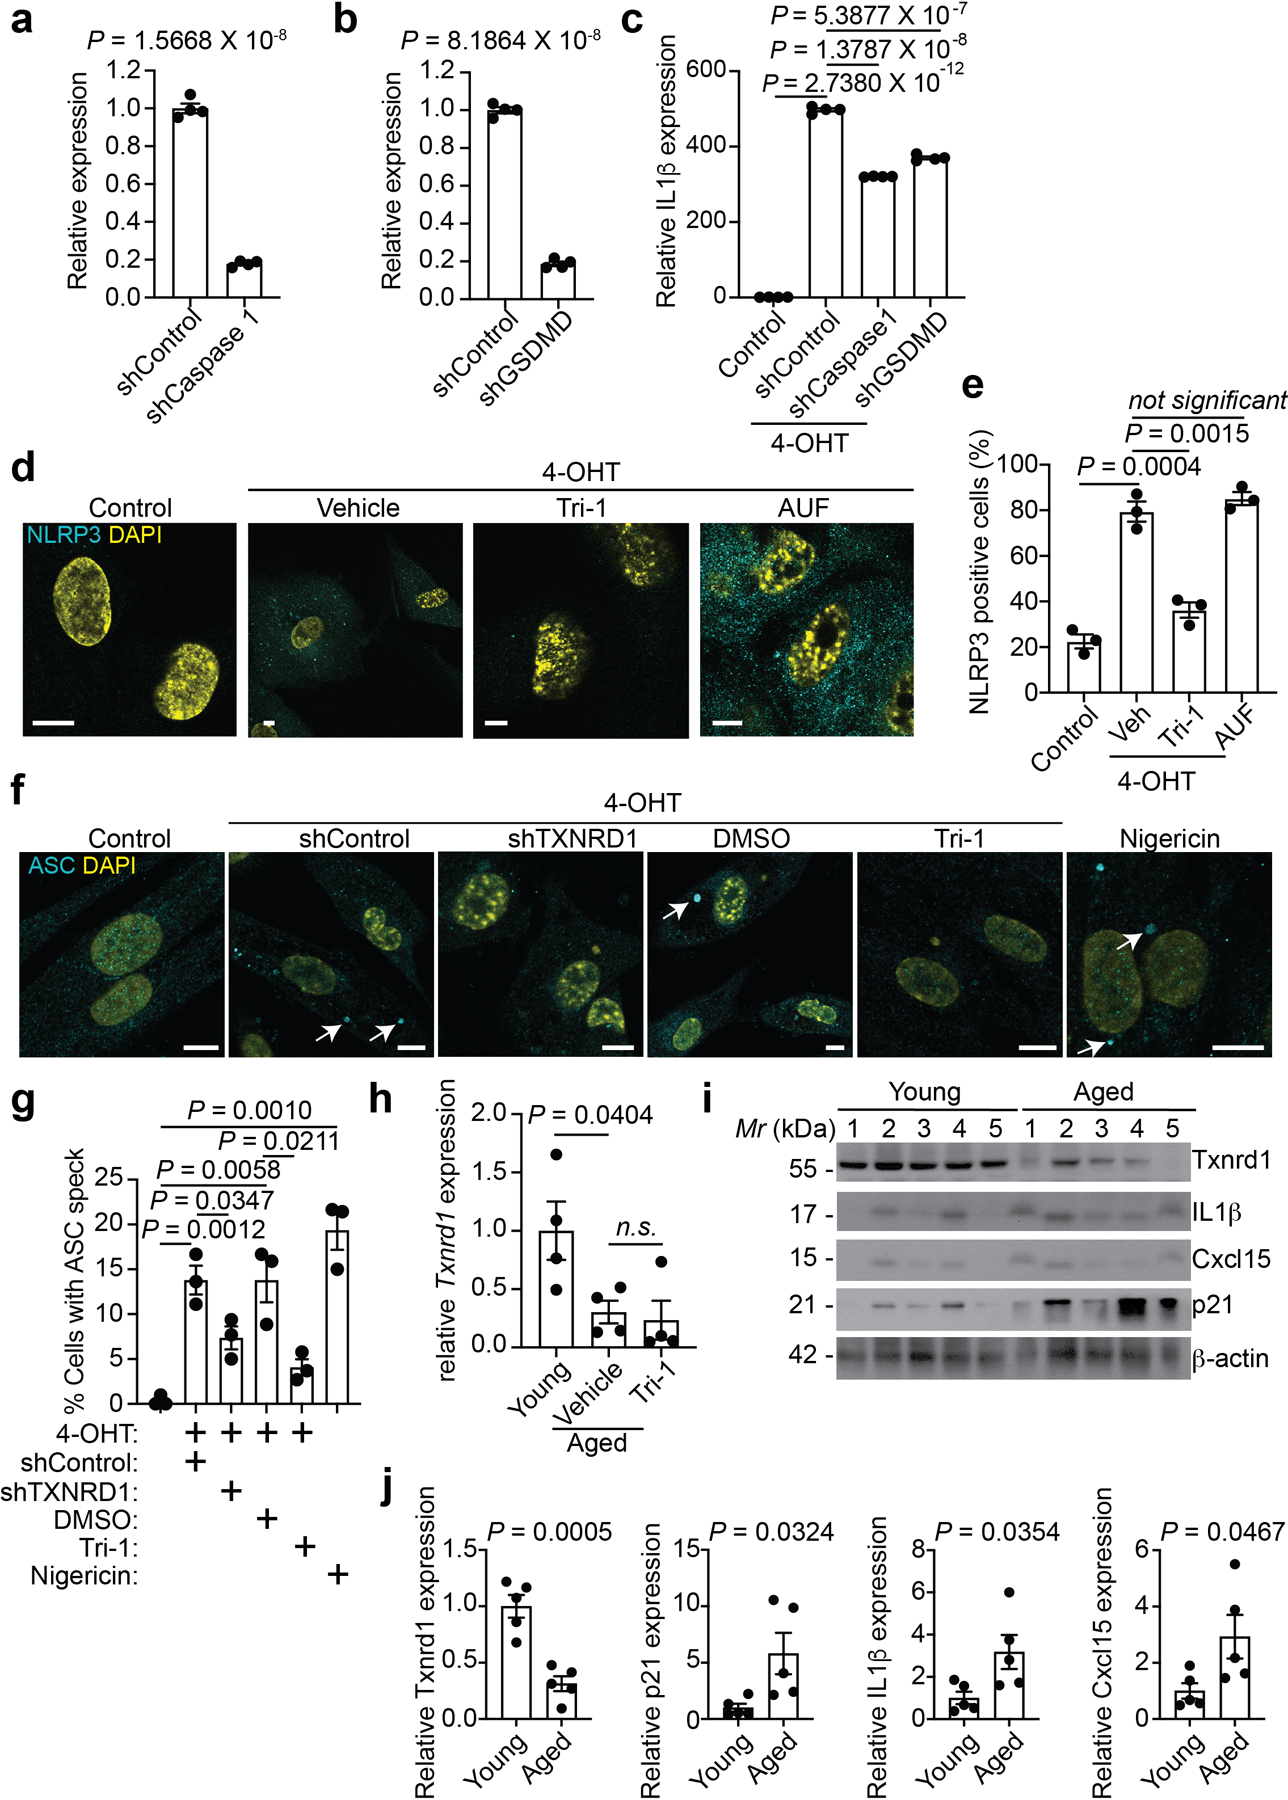
a, b, Knockdown of Caspase 1 (a) and GSDMD (b) in senescent IMR90 cells was validated by RT-qPCR. n = 4 biologically independent experiments.
c, Expression of IL1β in ER-RAS induced (by 4-OHT) senescent IMR90 cells with or without the knockdown of GSDMD or Caspase 1 was determined by RT-qPCR analysis. n = 3 biologically independent experiments.
d,e, Representative images of immunostaining for NLRP3 in ER-RAS induced (by 4-OHT) senescent IMR90 cells with or without the indicated treatments (d). NLRP3 positive cells were quantified (e). n = 3 biologically independent experiments. Scale bars = 10 μm.
f,g, Representative images of immunostaining for ASC to visualize inflammasome formation in the indicated control and ER-RAS induced (by 4-OHT) senescent IMR90 cells (f). ASC speck positive cells were quantified (g). n = 3 biologically independent experiments. Nigericin, a known inducer of inflammasome formation, was used as a positive control (10 μM for 4 hours). Scale bars = 10 μm.
h, Expression of Txnrd1 in young (4 months) and aged mice (22 months) with or without Tri-1 treatment was determined by RT-qPCR analysis. n = 4 biologically independent mice per group.
i,j, Immunoblot of the indicated proteins in the ovary tissues harvested from young (4 months) and aged mice (22 months) (i). The intensity of the indicated proteins was quantified by NIH ImageJ software and normalized against a loading control β-actin expression (j). n = 5 biologically independent mice per group.
Data represent mean ± s.e.m. P-values were calculated using a two-tailed t test.
Extended Data Figure 9: Tri-1 and auranofin do not affect p16 and p53 signatures in aged mouse ovaries.
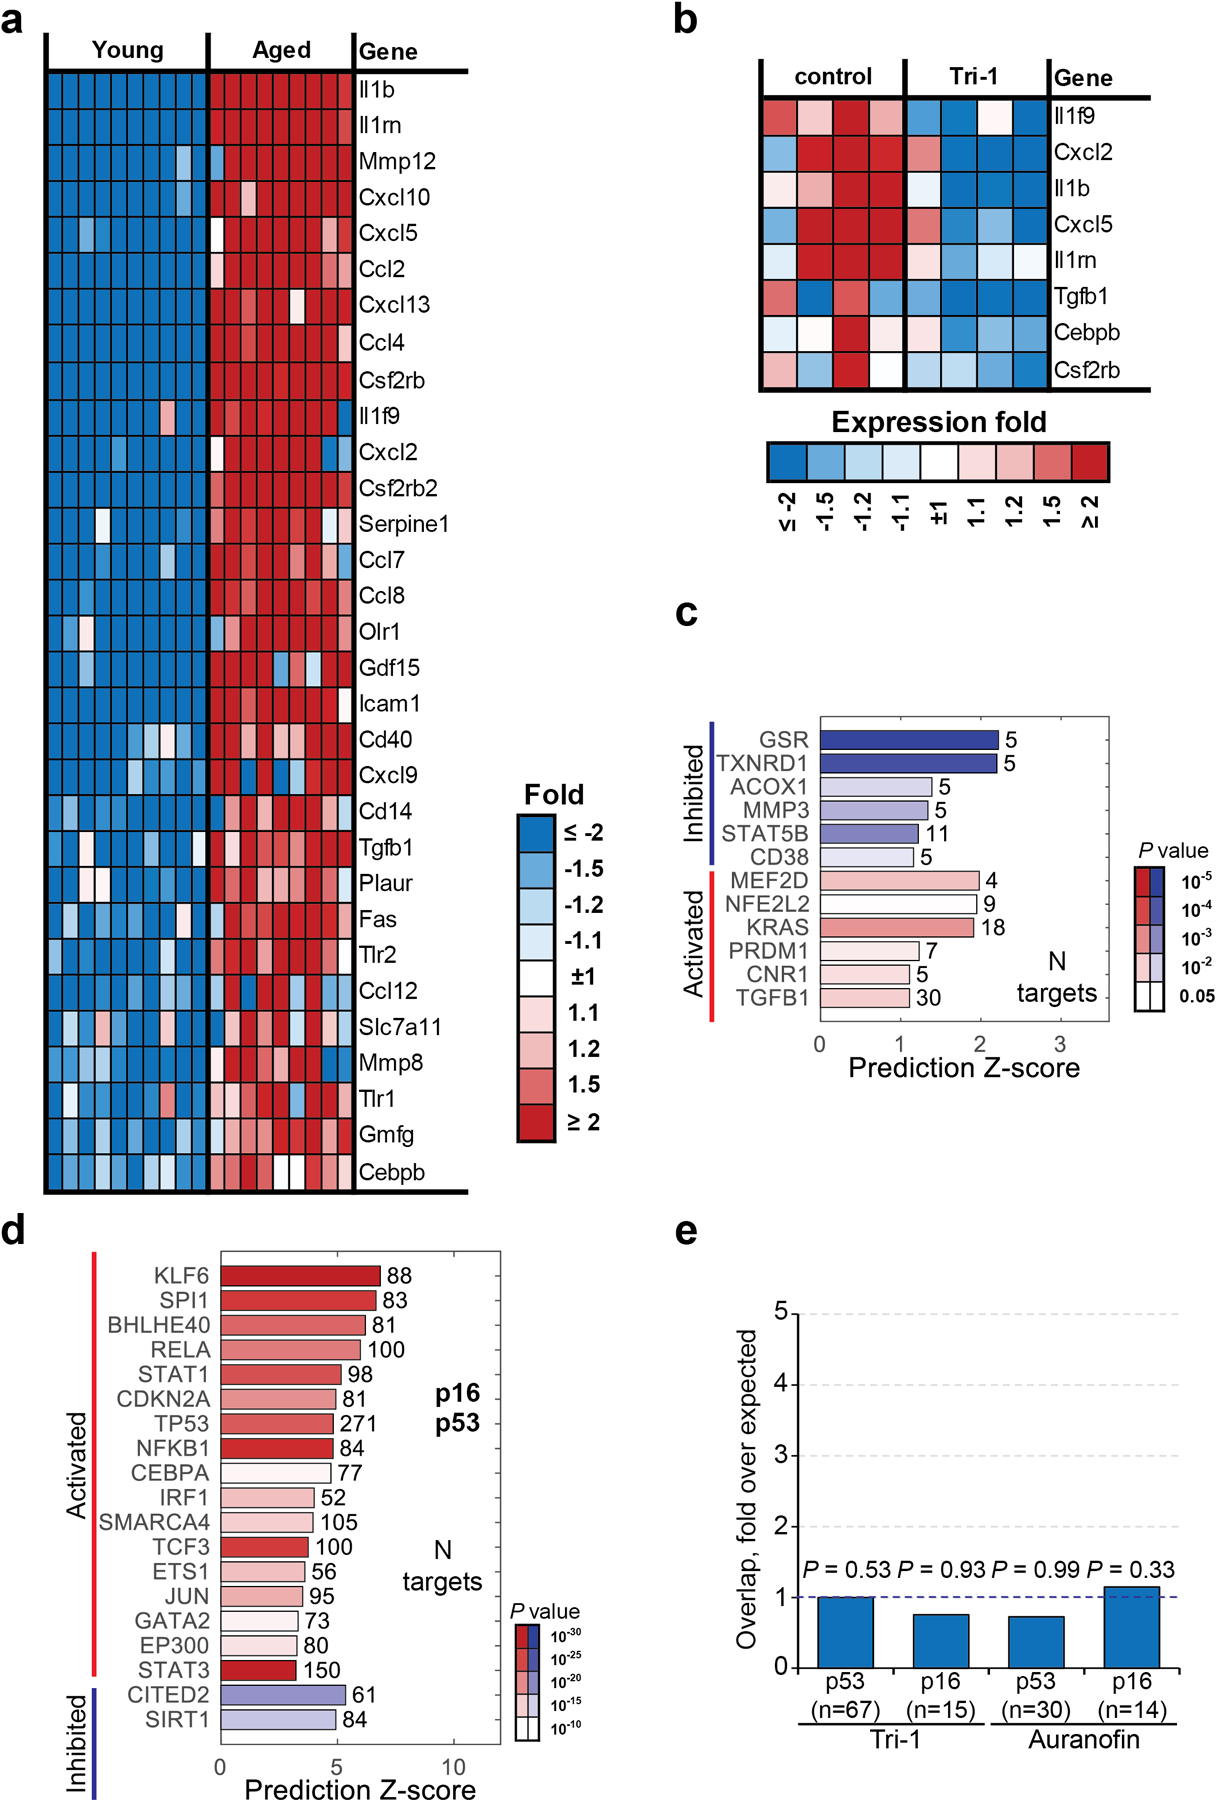
a, Heatmap of the SASP genes that were significantly upregulated in ovaries from aged mice (22 months) compared with young mice (4 months) (n = 10 biologically independent mice in young group, n = 9 biologically independent mice in aged group).
b, Heatmap of the SASP genes that were significantly suppressed by Tri-1 treatment in aged mouse ovaries (n = 4 biologically independent mice per group)
c-e, Ingenuity Pathway Analysis of the 1920 genes that were significantly different in aged vs young mice ovaries. Common gene expression changes induced by Tri-1 and auranofin treatments showed expected common inhibition of GSR and TXNRD1 regulators (c).
Transcription factors with altered activity were listed with p53 and p16 among them (d). P values were calculated by a Fisher Exact Test estimated by Ingenuity Pathway Analysis Software. Both these two age-associated signatures were not affected with either Tri-1 or auranofin treatment in the aged mice (e). P values were calculated by hypergeometrical test.
Extended Data Figure 10: Suppression of SASP by Tri-1 treatment in aged mouse ovary.
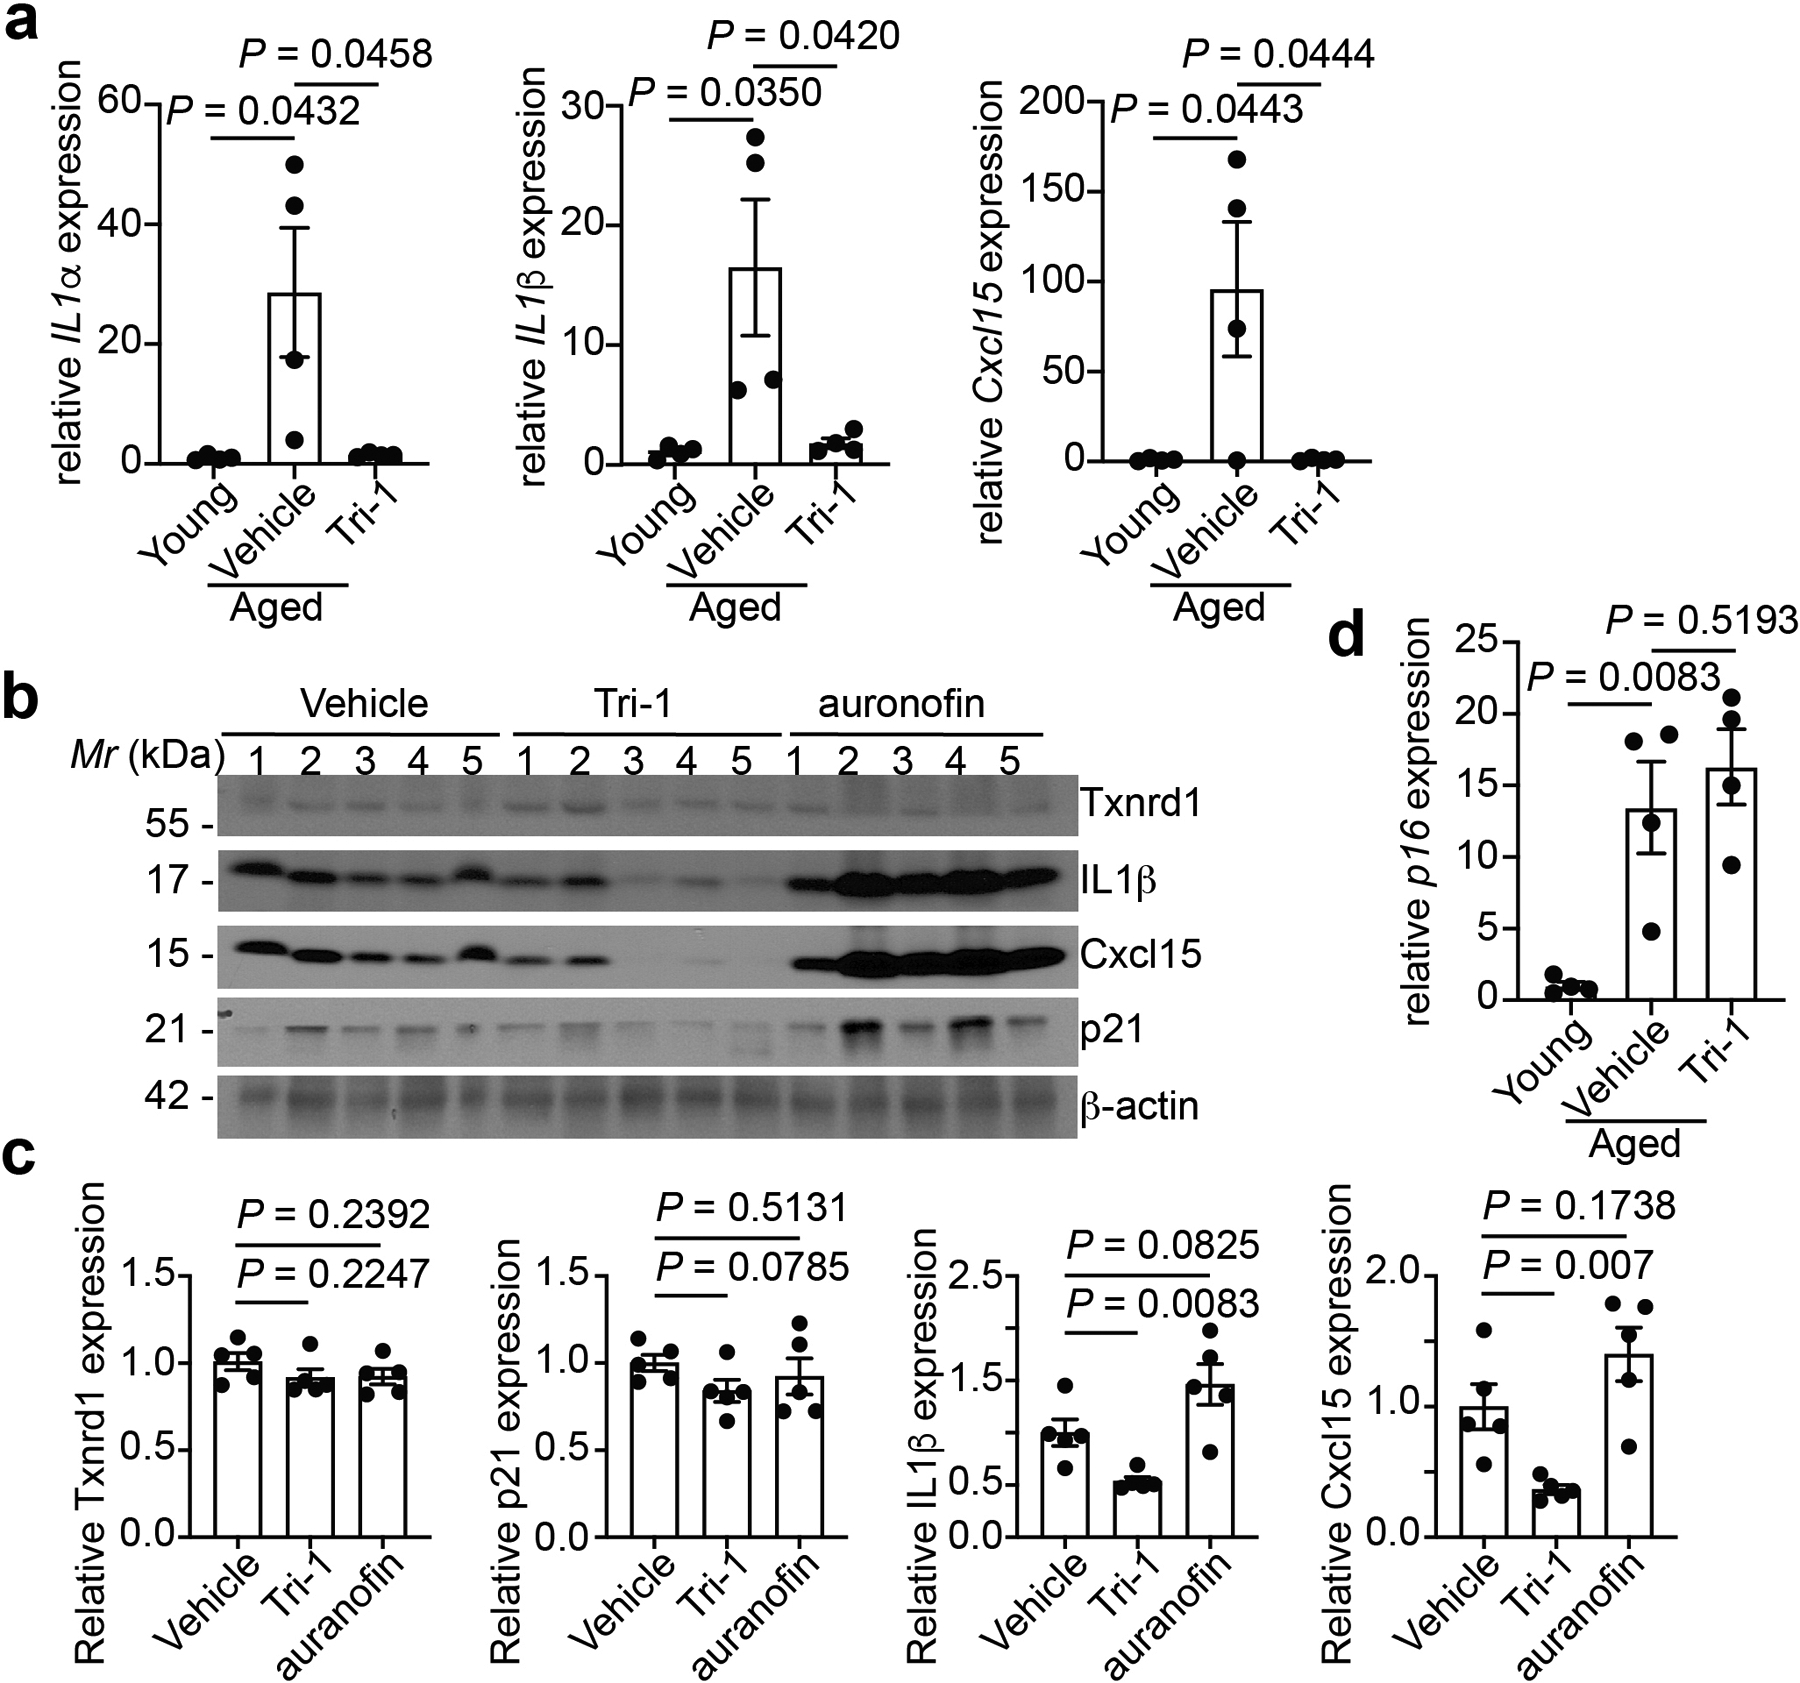
a,b, Expression of the indicated SASP genes in ovaries from young (4 months) or aged (22 months) mice treated with Tri-1 or vehicle control was determined by RT-qPCR. n = 4 biologically independent mice per group.
b,c, Immunoblot of the indicated proteins in the ovary tissues harvested from aged mice (22 months) with or without Tri-1 or auranofin treatments (b). The intensity of the indicated proteins was quantified by NIH ImageJ software and normalized against a loading control β-actin expression (c). n = 5 biologically independent mice per group.
d, Expression of p16 in ovaries from young (4 months) or aged (22 months) mice treated with Tri-1 or vehicle control was determined by RT-qPCR. n = 4 biologically independent mice per group.
Data represent mean ± s.e.m. P-values were calculated using a two-tailed t test.
Supplementary Material
Acknowledgement
We thank Mr. Frederick Keeney at The Wistar Institute Imaging Facility for qualifying NLRP3 staining in mouse tissues. This work was supported by US National Institutes of Health grants (R01CA160331 and R01CA276569 to R.Z., P01AG031862 to P.D.A., S.L.B, R.M., D.S. and R.Z., R50CA221838 to H.Y.T. and R50CA211199 to A.V.K.). US Department of Defence (OC220011 to H.X.). Cancer Prevention and Research Institute of Texas (Scholar in Cancer Research RR230005 to R.Z.). Support of Core Facilities was provided by Cancer Centre Support Grant (CCSG) CA010815 to The Wistar Institute and P30CA016672 to University of Texas MD Anderson Cancer Center. The funders had no role in study design, data collection and analysis, decision to publish or preparation of the manuscript.
Footnotes
Code availability
The software and algorithms for data analyses used in this study are all well-established from previous work and are referenced throughout the manuscript.
Competing Interests Statement
The authors have no financial and non-financial competing interests.
Data availability
IMR90 cells RNA-seq datasets have been deposited in the Gene Expression Omnibus (GEO) under accession number: GSE202664 (https://www.ncbi.nlm.nih.gov/geo/query/acc.cgi?acc=GSE202664). Mouse tissue RNA-seq dataset have been deposited in the Gene Expression Omnibus (GEO) under accession number: GSE204841. The mass spectrometry proteomics data have been deposited into the MassIVE (http://massive.ucsd.edu) and ProteomeXchange (http://www.proteomexchange.org) data repository with the accession number MSV000089650 and PXD034505, respectively. All other data supporting the findings of this study are within article and its supplementary materials.
References
- 1.Munoz-Espin D & Serrano M Cellular senescence: from physiology to pathology. Nat Rev Mol Cell Biol 15, 482–496 (2014). 10.1038/nrm3823 [DOI] [PubMed] [Google Scholar]
- 2.Hao X, Wang C & Zhang R Chromatin basis of the senescence-associated secretory phenotype. Trends Cell Biol (2022). 10.1016/j.tcb.2021.12.003 [DOI] [PMC free article] [PubMed] [Google Scholar]
- 3.Dou Z et al. Cytoplasmic chromatin triggers inflammation in senescence and cancer. Nature 550, 402–406 (2017). 10.1038/nature24050 [DOI] [PMC free article] [PubMed] [Google Scholar]
- 4.Gluck S et al. Innate immune sensing of cytosolic chromatin fragments through cGAS promotes senescence. Nat Cell Biol 19, 1061–1070 (2017). 10.1038/ncb3586 [DOI] [PMC free article] [PubMed] [Google Scholar]
- 5.Yang H, Wang H, Ren J, Chen Q & Chen ZJ cGAS is essential for cellular senescence. Proc Natl Acad Sci U S A 114, E4612–E4620 (2017). 10.1073/pnas.1705499114 [DOI] [PMC free article] [PubMed] [Google Scholar]
- 6.Takahashi A et al. Downregulation of cytoplasmic DNases is implicated in cytoplasmic DNA accumulation and SASP in senescent cells. Nat Commun 9, 1249 (2018). 10.1038/s41467-018-03555-8 [DOI] [PMC free article] [PubMed] [Google Scholar]
- 7.Franceschi C & Campisi J Chronic inflammation (inflammaging) and its potential contribution to age-associated diseases. J Gerontol A Biol Sci Med Sci 69 Suppl 1, S4–9 (2014). 10.1093/gerona/glu057 [DOI] [PubMed] [Google Scholar]
- 8.Lopez-Otin C, Blasco MA, Partridge L, Serrano M & Kroemer G The hallmarks of aging. Cell 153, 1194–1217 (2013). 10.1016/j.cell.2013.05.039 [DOI] [PMC free article] [PubMed] [Google Scholar]
- 9.Arner ESJ Targeting the Selenoprotein Thioredoxin Reductase 1 for Anticancer Therapy. Adv Cancer Res 136, 139–151 (2017). 10.1016/bs.acr.2017.07.005 [DOI] [PubMed] [Google Scholar]
- 10.Dato S, De Rango F, Crocco P, Passarino G & Rose G Antioxidants and Quality of Aging: Further Evidences for a Major Role of TXNRD1 Gene Variability on Physical Performance at Old Age. Oxid Med Cell Longev 2015, 926067 (2015). 10.1155/2015/926067 [DOI] [PMC free article] [PubMed] [Google Scholar]
- 11.Dato S et al. Contribution of genetic polymorphisms on functional status at very old age: a gene-based analysis of 38 genes (311 SNPs) in the oxidative stress pathway. Exp Gerontol 52, 23–29 (2014). 10.1016/j.exger.2014.01.014 [DOI] [PMC free article] [PubMed] [Google Scholar]
- 12.Soerensen M et al. Human longevity and variation in GH/IGF-1/insulin signaling, DNA damage signaling and repair and pro/antioxidant pathway genes: cross sectional and longitudinal studies. Exp Gerontol 47, 379–387 (2012). 10.1016/j.exger.2012.02.010 [DOI] [PMC free article] [PubMed] [Google Scholar]
- 13.Usategui-Martin R et al. Association between genetic variants in oxidative stress-related genes and osteoporotic bone fracture. The Hortega follow-up study. Gene 809, 146036 (2022). 10.1016/j.gene.2021.146036 [DOI] [PubMed] [Google Scholar]
- 14.El Assar M et al. Frailty Is Associated With Lower Expression of Genes Involved in Cellular Response to Stress: Results From the Toledo Study for Healthy Aging. J Am Med Dir Assoc 18, 734 e731–734 e737 (2017). 10.1016/j.jamda.2017.04.019 [DOI] [PubMed] [Google Scholar]
- 15.Rodriguez-Manas L & Fried LP Frailty in the clinical scenario. Lancet 385, e7–e9 (2015). 10.1016/S0140-6736(14)61595-6 [DOI] [PubMed] [Google Scholar]
- 16.Finkel T & Holbrook NJ Oxidants, oxidative stress and the biology of ageing. Nature 408, 239–247 (2000). 10.1038/35041687 [DOI] [PubMed] [Google Scholar]
- 17.Stafford WC et al. Irreversible inhibition of cytosolic thioredoxin reductase 1 as a mechanistic basis for anticancer therapy. Sci Transl Med 10 (2018). 10.1126/scitranslmed.aaf7444 [DOI] [PMC free article] [PubMed] [Google Scholar]
- 18.Li XD et al. Pivotal roles of cGAS-cGAMP signaling in antiviral defense and immune adjuvant effects. Science 341, 1390–1394 (2013). 10.1126/science.1244040 [DOI] [PMC free article] [PubMed] [Google Scholar]
- 19.Liu ZS et al. G3BP1 promotes DNA binding and activation of cGAS. Nat Immunol 20, 18–28 (2019). 10.1038/s41590-018-0262-4 [DOI] [PMC free article] [PubMed] [Google Scholar]
- 20.Gromer S, Arscott LD, Williams CH Jr., Schirmer RH & Becker K Human placenta thioredoxin reductase. Isolation of the selenoenzyme, steady state kinetics, and inhibition by therapeutic gold compounds. J Biol Chem 273, 20096–20101 (1998). 10.1074/jbc.273.32.20096 [DOI] [PubMed] [Google Scholar]
- 21.Lama L et al. Development of human cGAS-specific small-molecule inhibitors for repression of dsDNA-triggered interferon expression. Nat Commun 10, 2261 (2019). 10.1038/s41467-019-08620-4 [DOI] [PMC free article] [PubMed] [Google Scholar]
- 22.Cheng Q et al. The selenium-independent inherent pro-oxidant NADPH oxidase activity of mammalian thioredoxin reductase and its selenium-dependent direct peroxidase activities. J Biol Chem 285, 21708–21723 (2010). 10.1074/jbc.M110.117259 [DOI] [PMC free article] [PubMed] [Google Scholar]
- 23.Michalski S et al. Structural basis for sequestration and autoinhibition of cGAS by chromatin. Nature 587, 678–682 (2020). 10.1038/s41586-020-2748-0 [DOI] [PubMed] [Google Scholar]
- 24.Zhao B et al. The molecular basis of tight nuclear tethering and inactivation of cGAS. Nature 587, 673–677 (2020). 10.1038/s41586-020-2749-z [DOI] [PMC free article] [PubMed] [Google Scholar]
- 25.Pathare GR et al. Structural mechanism of cGAS inhibition by the nucleosome. Nature 587, 668–672 (2020). 10.1038/s41586-020-2750-6 [DOI] [PubMed] [Google Scholar]
- 26.Herranz N & Gil J Mechanisms and functions of cellular senescence. J Clin Invest 128, 1238–1246 (2018). 10.1172/JCI95148 [DOI] [PMC free article] [PubMed] [Google Scholar]
- 27.Rodier F & Campisi J Four faces of cellular senescence. J Cell Biol 192, 547–556 (2011). 10.1083/jcb.201009094 [DOI] [PMC free article] [PubMed] [Google Scholar]
- 28.Coppe JP et al. Senescence-associated secretory phenotypes reveal cell-nonautonomous functions of oncogenic RAS and the p53 tumor suppressor. PLoS Biol 6, 2853–2868 (2008). 10.1371/journal.pbio.0060301 [DOI] [PMC free article] [PubMed] [Google Scholar]
- 29.Kang TW et al. Senescence surveillance of pre-malignant hepatocytes limits liver cancer development. Nature 479, 547–551 (2011). 10.1038/nature10599 [DOI] [PubMed] [Google Scholar]
- 30.Gulen MF et al. cGAS-STING drives ageing-related inflammation and neurodegeneration. Nature 620, 374–380 (2023). 10.1038/s41586-023-06373-1 [DOI] [PMC free article] [PubMed] [Google Scholar]
- 31.Kerur N et al. cGAS drives noncanonical-inflammasome activation in age-related macular degeneration. Nat Med 24, 50–61 (2018). 10.1038/nm.4450 [DOI] [PMC free article] [PubMed] [Google Scholar]
- 32.Hou Y et al. NAD(+) supplementation reduces neuroinflammation and cell senescence in a transgenic mouse model of Alzheimer’s disease via cGAS-STING. Proc Natl Acad Sci U S A 118 (2021). 10.1073/pnas.2011226118 [DOI] [PMC free article] [PubMed] [Google Scholar]
- 33.Zhong Z et al. NF-kappaB Restricts Inflammasome Activation via Elimination of Damaged Mitochondria. Cell 164, 896–910 (2016). 10.1016/j.cell.2015.12.057 [DOI] [PMC free article] [PubMed] [Google Scholar]
- 34.Swanson KV, Deng M & Ting JP The NLRP3 inflammasome: molecular activation and regulation to therapeutics. Nat Rev Immunol 19, 477–489 (2019). 10.1038/s41577-019-0165-0 [DOI] [PMC free article] [PubMed] [Google Scholar]
- 35.Schroder K & Tschopp J The inflammasomes. Cell 140, 821–832 (2010). 10.1016/j.cell.2010.01.040 [DOI] [PubMed] [Google Scholar]
- 36.Rosenbaum SR, Wilski NA & Aplin AE Fueling the Fire: Inflammatory Forms of Cell Death and Implications for Cancer Immunotherapy. Cancer discovery 11, 266–281 (2021). 10.1158/2159-8290.CD-20-0805 [DOI] [PMC free article] [PubMed] [Google Scholar]
- 37.Navarro-Pando JM et al. Inhibition of the NLRP3 inflammasome prevents ovarian aging. Sci Adv 7 (2021). 10.1126/sciadv.abc7409 [DOI] [PMC free article] [PubMed] [Google Scholar]
- 38.McIlwain DR, Berger T & Mak TW Caspase functions in cell death and disease. Cold Spring Harb Perspect Biol 5, a008656 (2013). 10.1101/cshperspect.a008656 [DOI] [PMC free article] [PubMed] [Google Scholar]
- 39.Michaud M et al. Proinflammatory cytokines, aging, and age-related diseases. J Am Med Dir Assoc 14, 877–882 (2013). 10.1016/j.jamda.2013.05.009 [DOI] [PubMed] [Google Scholar]
- 40.Cassidy LD et al. Temporal inhibition of autophagy reveals segmental reversal of ageing with increased cancer risk. Nat Commun 11, 307 (2020). 10.1038/s41467-019-14187-x [DOI] [PMC free article] [PubMed] [Google Scholar]
- 41.Mitsui A et al. Overexpression of human thioredoxin in transgenic mice controls oxidative stress and life span. Antioxid Redox Signal 4, 693–696 (2002). 10.1089/15230860260220201 [DOI] [PubMed] [Google Scholar]
- 42.Nelson G, Kucheryavenko O, Wordsworth J & von Zglinicki T The senescent bystander effect is caused by ROS-activated NF-kappaB signalling. Mech Ageing Dev 170, 30–36 (2018). 10.1016/j.mad.2017.08.005 [DOI] [PMC free article] [PubMed] [Google Scholar]
- 43.Zhao B et al. Topoisomerase 1 cleavage complex enables pattern recognition and inflammation during senescence. Nat Commun 11, 908 (2020). 10.1038/s41467-020-14652-y [DOI] [PMC free article] [PubMed] [Google Scholar]
- 44.Nacarelli T et al. NAD(+) metabolism governs the proinflammatory senescence-associated secretome. Nat Cell Biol 21, 397–407 (2019). 10.1038/s41556-019-0287-4 [DOI] [PMC free article] [PubMed] [Google Scholar]
- 45.Liu P et al. m(6)A-independent genome-wide METTL3 and METTL14 redistribution drives the senescence-associated secretory phenotype. Nat Cell Biol 23, 355–365 (2021). 10.1038/s41556-021-00656-3 [DOI] [PMC free article] [PubMed] [Google Scholar]
- 46.Cox J & Mann M MaxQuant enables high peptide identification rates, individualized p.p.b.-range mass accuracies and proteome-wide protein quantification. Nat Biotechnol 26, 1367–1372 (2008). 10.1038/nbt.1511 [DOI] [PubMed] [Google Scholar]
- 47.Fernandez Garcia M et al. Structural Features of Transcription Factors Associating with Nucleosome Binding. Mol Cell 75, 921–932 e926 (2019). 10.1016/j.molcel.2019.06.009 [DOI] [PMC free article] [PubMed] [Google Scholar]
- 48.Hao X et al. ADAR1 downregulation by autophagy drives senescence independently of RNA editing by enhancing p16(INK4a) levels. Nat Cell Biol 24, 1202–1210 (2022). 10.1038/s41556-022-00959-z [DOI] [PMC free article] [PubMed] [Google Scholar]
- 49.Langmead B & Salzberg SL Fast gapped-read alignment with Bowtie 2. Nat Methods 9, 357–359 (2012). 10.1038/nmeth.1923 [DOI] [PMC free article] [PubMed] [Google Scholar]
- 50.Li B & Dewey CN RSEM: accurate transcript quantification from RNA-Seq data with or without a reference genome. BMC Bioinformatics 12, 323 (2011). 10.1186/1471-2105-12-323 [DOI] [PMC free article] [PubMed] [Google Scholar]
- 51.Love MI, Huber W & Anders S Moderated estimation of fold change and dispersion for RNA-seq data with DESeq2. Genome Biol 15, 550 (2014). 10.1186/s13059-014-0550-8 [DOI] [PMC free article] [PubMed] [Google Scholar]
- 52.Huang da W, Sherman BT & Lempicki RA Systematic and integrative analysis of large gene lists using DAVID bioinformatics resources. Nat Protoc 4, 44–57 (2009). 10.1038/nprot.2008.211 [DOI] [PubMed] [Google Scholar]
Associated Data
This section collects any data citations, data availability statements, or supplementary materials included in this article.
Supplementary Materials
Data Availability Statement
IMR90 cells RNA-seq datasets have been deposited in the Gene Expression Omnibus (GEO) under accession number: GSE202664 (https://www.ncbi.nlm.nih.gov/geo/query/acc.cgi?acc=GSE202664). Mouse tissue RNA-seq dataset have been deposited in the Gene Expression Omnibus (GEO) under accession number: GSE204841. The mass spectrometry proteomics data have been deposited into the MassIVE (http://massive.ucsd.edu) and ProteomeXchange (http://www.proteomexchange.org) data repository with the accession number MSV000089650 and PXD034505, respectively. All other data supporting the findings of this study are within article and its supplementary materials.


