Abstract
The brain codes continuous spatial, temporal, and sensory changes in daily experience. Recent studies suggest the brain also tracks experience as segmented subdivisions (events), but the neural basis for encoding events remains unclear. We designed a maze for mice composed of 4 materially indistinguishable lap events, and report hippocampal CA1 neurons whose activity is modulated not only by spatial location, but also lap number. These “event-specific rate remapping” (ESR) cells remain lap-specific even when the maze length is unpredictably altered within trials, suggesting ESR cells treat lap events as fundamental units. The activity pattern of ESR cells is reused to represent lap events when the maze geometry is altered from square to circle, suggesting it helps transfer knowledge between experiences. ESR activity is separately manipulable from spatial activity, and may therefore constitute an independent hippocampal code: an “event code” dedicated to organizing experience by events as discrete and transferable units.
INTRODUCTION
How is daily experience represented in the brain? Most daily experiences involve travelling to different places and/or seeing different things, and so contain a multitude of spatial and sensory variations (Fig. 1a top, middle). Hippocampal cells monitor these continuous changes in space, passing time, and sensory stimuli1–5.
Fig. 1: Experimental design to study segmentation of experience into units.
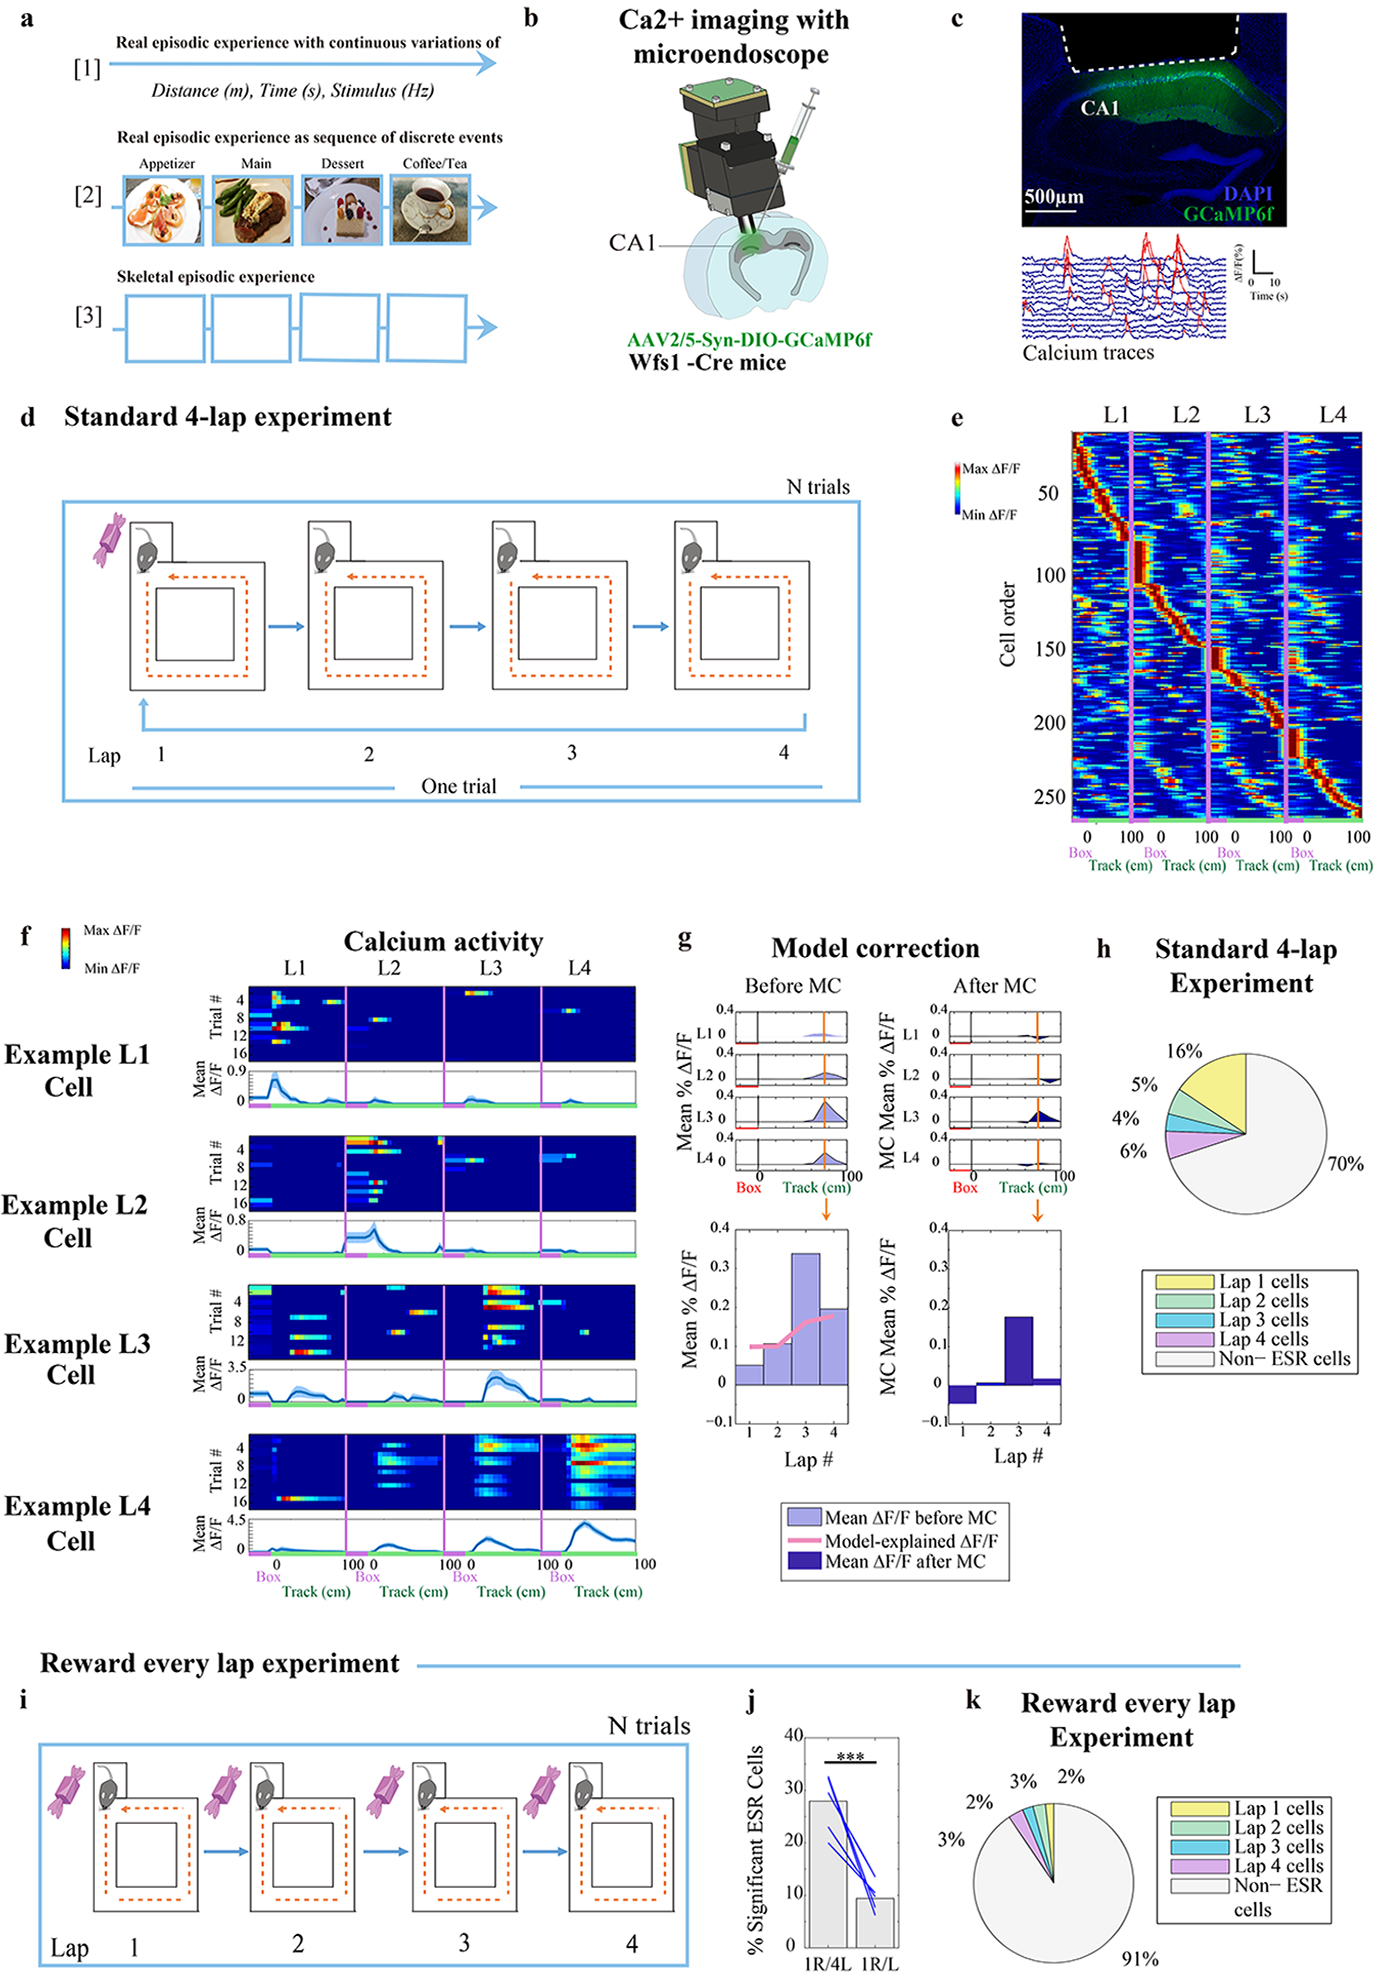
a) Illustration of experience as (top): sequence of continuous, moment to moment variations in space, time, and sensory stimuli, (middle): sequence of discrete events as fundamental units of the experience. (bottom): our behavioral task as a skeletal experience stripped of sensory and spatial differences in order to identify neuronal representations that track event as fundamental units.
b) Implantation of microendoscope into dCA1 of Wfs1-Cre mice with AAV2/5-Syn-flex-GCaMP6f-WPRE-SV40 virus injected in dCA1 for imaging CA1 pyramidal cells.
c) Top: Coronal section of hippocampus showing area of cortex aspiration (white dotted line) and Wfs1+ cells labelled (green). Representative of aspiration surgeries from n = 14 mice. Bottom: ΔF/F calcium traces of n = 15 Wfs1+ (pyramidal) cells in CA1, where (red) denotes significant calcium transients identified.
d) During the standard 4-lap-per-trial experiment reward was delivered to the animal at the beginning of lap 1 in the reward box, once every 4 such laps.
e) CA1 calcium activity sorted by spatial position and lap number showed activity in the same place on every lap but displayed a higher activity level during a specific lap compared to other laps (263 cells from example animal). Red label on the x-axis indicates reward box spatial bin, and green label on the x-axis indicates the 100 cm long maze track.
f) Trial-by-trial calcium activity of example lap 1, 2, 3, and 4 preferring neurons, organized by location of activity along the track and by lap number. Top panel: trial-by-trial calcium activity; Bottom panel: trial averaged calcium activity (mean ±SEM). Standard error was cut off at 0 because negative activity does not exist).
g) Model correction of lap-dependent neuronal activity: Left, top: example neuron with raw calcium activity level (Light blue) sorted by lap number and spatial bin. Left, bottom: peak spatial bin to study lap-specific calcium activity, and plotted with calcium rate explained by the speed and head orientation fitted linear model (Pink trace, See Methods). Right: The same panels as the left, but plotted with lap specific remaining calcium rate after the linear model was subtracted, resulting in ‘model corrected’, or MC, calcium activity.
h) Summary statistics: Percentage of ESR cells in the whole CA1 pyramidal population that were tuned to lap 1, 2, 3, or 4, in the standard 4-lap experiment (n = 14 animals).
i—k) (i) Task schedule: reward was given to the animal every lap. (j) The percentage of significant ESR cells (101/1072 cells) was significantly reduced when reward was given every lap, compared with the same animals running the standard 4-lap-per-trial task (371/1328 cells) (χ2 =128.7, p < 10−16, Blue lines: 5 mice). (k) Summary statistics: Percentage of ESR cells in the whole CA1 pyramidal population that were tuned to lap 1, 2, 3, or 4, during the reward every lap experiment.
Meanwhile others, based on recent human imaging studies6–9, have suggested that besides tracking the continuously changing sensory environment, the brain also tracks daily experience as a chain of its discrete, segmented subdivisions or events. Each event arises as a discrete epoch of experience, with its continuous sensory and spatial changes grouped together as a unit. It has been suggested that events are abstract and generalizable entities, and can be divorced from specific sensory details10–13. Take dining in a restaurant as an example. Two different dinner experiences can share the same set of events: eating an appetizer, main course, and dessert, even if they occur at different restaurants, involve different foods, and last varying amounts of time (Fig. 1a, middle). In other words, each of these events have a degree of invariance to the variations of their actual physical and sensory contents. Instead, these events are defined by the abstract, ordered relationships to one another: an appetizer is eaten first, followed by a main dish, which is followed by dessert. This allows events to describe widely varying experiences in a generalized manner. Encoding these abstract events are important in order to behave perspicaciously in the world.
Beyond representing continuous changes in space, there is evidence that hippocampal neurons encode broader episodic information, including changes in sensory cues14 as well as past and future trajectories15,16. Hippocampal neurons encode this broader episodic information by changing the activity rate at a given place field (rate remapping). However, neural representations dedicated to encoding events as units of experience, separate from the tracking of the immediate continuous environment, remain poorly understood.
In this study, we have found a hippocampal representation that treats events as discrete units of experience, and we show that these event representations can be transferred between different experiences. We also show that this representation is reciprocally and independently manipulable from the continuous representation of space.
RESULTS
Task design to study segmentation of experience into units
With oft-used behavioral paradigms that involve changes in spatial14–17 and sensory variables18,19, it is difficult to identify neurons tracking discrete and unitary events as opposed to tracking continuous sensory stimuli or spatial differences. For these reasons, we designed a repetitive behavioral task in which sensory cues and spatial trajectories were kept constant for multiple events (Fig. 1a, Fig. 1d). This allowed the influence of events as fundamental units to be separated from the influence of changing sensory/spatial information.
In our task, mice repeatedly ran through a square maze subdivided into four laps per trial (Fig. 1d). A reward was delivered at the onset of lap 1 of every trial, as a single temporal cue, with the subsequent three laps unrewarded. It is known that salient stimuli can potentially serve as boundaries between events9,17. It is possible that reward box visits may serve as event boundaries between lap events. In fact, these mice visited the reward box after every lap, regardless whether a reward was delivered or not (Extended Data Fig. 1a left). We asked whether there is evidence of neurons that track lap events as discrete units of experience.
A virus expressing the calcium indicator GCaMP6f (AAV2/5-Syn-flex-GCaMP6f-WPRE-SV40)20 was injected into dorsal CA1 (dCA1) of the hippocampus in Wfs1 (Wolframin-1) promoter-driven Cre transgenic mice21,22. A microendoscope was implanted above dCA123 to enable long-term calcium imaging in freely moving mice (Fig. 1b, c). We recorded calcium activity and characterized the spatial selectivity of CA1 neurons (Extended Data Fig. 1c) as mice ran the square maze (Fig. 1d). During testing, animals completed 15–20 trials (60–80 laps) in succession. On average, test mice took 98 seconds to complete one trial (Extended Data Fig. 1a right). For each neuron during each of the four laps, we calculated its average calcium activity level during moving periods (> 4 cm/s) within spatial bins that tiled the maze (Methods). In total, 72% (2509/3506) of CA1 cells from 14 animals were significant place cells. Some neurons were found to be most active during reward consumption (lap 1) in the reward box (Extended Data Fig. 1d: examples of reward driven neurons); these cells were excluded from further analysis because they were active in direct response to the reward (Methods). In general, neurons that were active in the start box during non-rewarded laps, or in the maze, were active at the same location on every lap, but showed higher activity for a specific lap compared to other laps (Fig. 1e, Extended Data Fig. 1b). Here, we show the trial-by-trial calcium activities of example neurons for each of the four laps. Indeed, example neurons showed higher activity during a particular lap robustly across trials (Fig. 1f, Extended Data Fig. 1e).
Since CA1 activity is sensitive to a variety of behavioral variables including spatial location2, running speed24,25, and head direction25,26 (Extended Data Fig. 2b–c), we fitted the activity of each neuron to a linear model incorporating the animal’s spatial location, head direction, and running speed (Methods) in order to investigate whether these modelled variables were enough to account for the lap preference. We then calculated the remaining calcium activity across four laps that was not accounted for by the model, and referred to this activity as ‘model corrected’, or MC, calcium activity (Fig. 1g). Each CA1 cell had a lap number during which the cell had the highest activity rate (its preferred lap), and in thirty percent of CA1 cells (1055/3506 cells, n = 14 mice, Supplementary Fig. 1 for individual mice), this peak, lap-specific MC activity was significantly different (outside the 95th confidence interval) compared to shuffles. Although CA1 calcium activity exhibited stochasticity in its trial-by-trial activation (Fig. 1f, Extended Data Fig. 1e), these significant lap-modulated CA1 cells exhibited a systematic lap-modulated pattern that was robust across trials (Extended Data Fig. 3b). As a control comparison, the percentage of lap-modulated CA1 cells was reduced when reward was given every lap (9% = 101/1072 cells, n= 5 animals, Fig. 1i–k). Within the confines of the 4-identical lap task structure, this lap event-specific MC activity is manifested as a sequence of rate remapping14–16 over a constant place field location. These cells are henceforth called “event-specific rate remapping cells”, or ESR cells. All the other CA1 cells were considered non-ESR cells. In order to study the pattern of calcium activity modulated by lap for a given ESR cell, we compiled its lap modulated MC activity in the peak spatial bin (Methods) for all four laps; we call this sequence of differential activity levels across the four laps the ESR activity pattern (Fig. 1g, bottom). For the rest of this study, we will investigate the features of the experience which give rise to the ESR phenomenon.
For a set of 5 animals that were exposed to the 4-lap-per-trial task for the first time, the percentage of ESR cells was 17% (176/1008 cells, n=5 mice), but following eight days training on the lap task, the proportion rose to 29% for these same mice (335/1168 cells; Extended Data Fig. 4c–d; χ2 =37.9, p = 7.4*10−10), showing that ESR activity patterns are learned. Correspondingly, mice did not run at increased speed during the 4th lap compared to the 1st lap during the first exposure to the 4-lap task, but they ran significantly faster during the 4th lap compared to the 1st lap following eight days of training on the 4-lap task (Extended Data Fig. 4e). In addition, once mice had been well-trained, if reward was unexpectedly delayed by an extra lap on some trials, mice still ran significantly faster on the 4th lap compared to the 1st lap, but also ran significantly slower during this extra 5th lap compared to the 4th lap, suggesting that animals anticipated reward exactly at the end of the 4th lap (Extended Data Fig. 4b).
We tracked ESR cells across days (Extended Data Fig. 5) in order to examine the preservation of ESR activity patterns. For every individual ESR cell on day 1, we defined an index for how much the ESR activity patterns are preserved across days as the Pearson correlation of its ESR activity pattern on day 1 vs day 2. The proportion of ESR cells that were highly preserved across days was significantly greater than chance for each of the separate populations of lap 1 cells, lap 2 cells, lap 3 cells, and lap 4 cells (Fig. 2e, Fig. 2a–c: example cells; Extended Data Fig. 6a for the analogous raw ΔF/F results without model correction; Methods). Lap 1, 2, 3 and 4 ESR activity patterns were highly preserved even when half the trials were eliminated (Extended Data Fig. 7a–c), as measured by the ESR correlation index. Generally speaking, lap 1 cells were more highly represented (Fig. 1h) compared to lap 2, 3 and 4 cells, though all four sub-populations of lap-specific cells were significantly preserved in their own right (Fig. 2e and Extended Data Fig. 6a).
Fig. 2: Lap 1, 2, 3 and 4 ESR cells are reliably preserved across days.
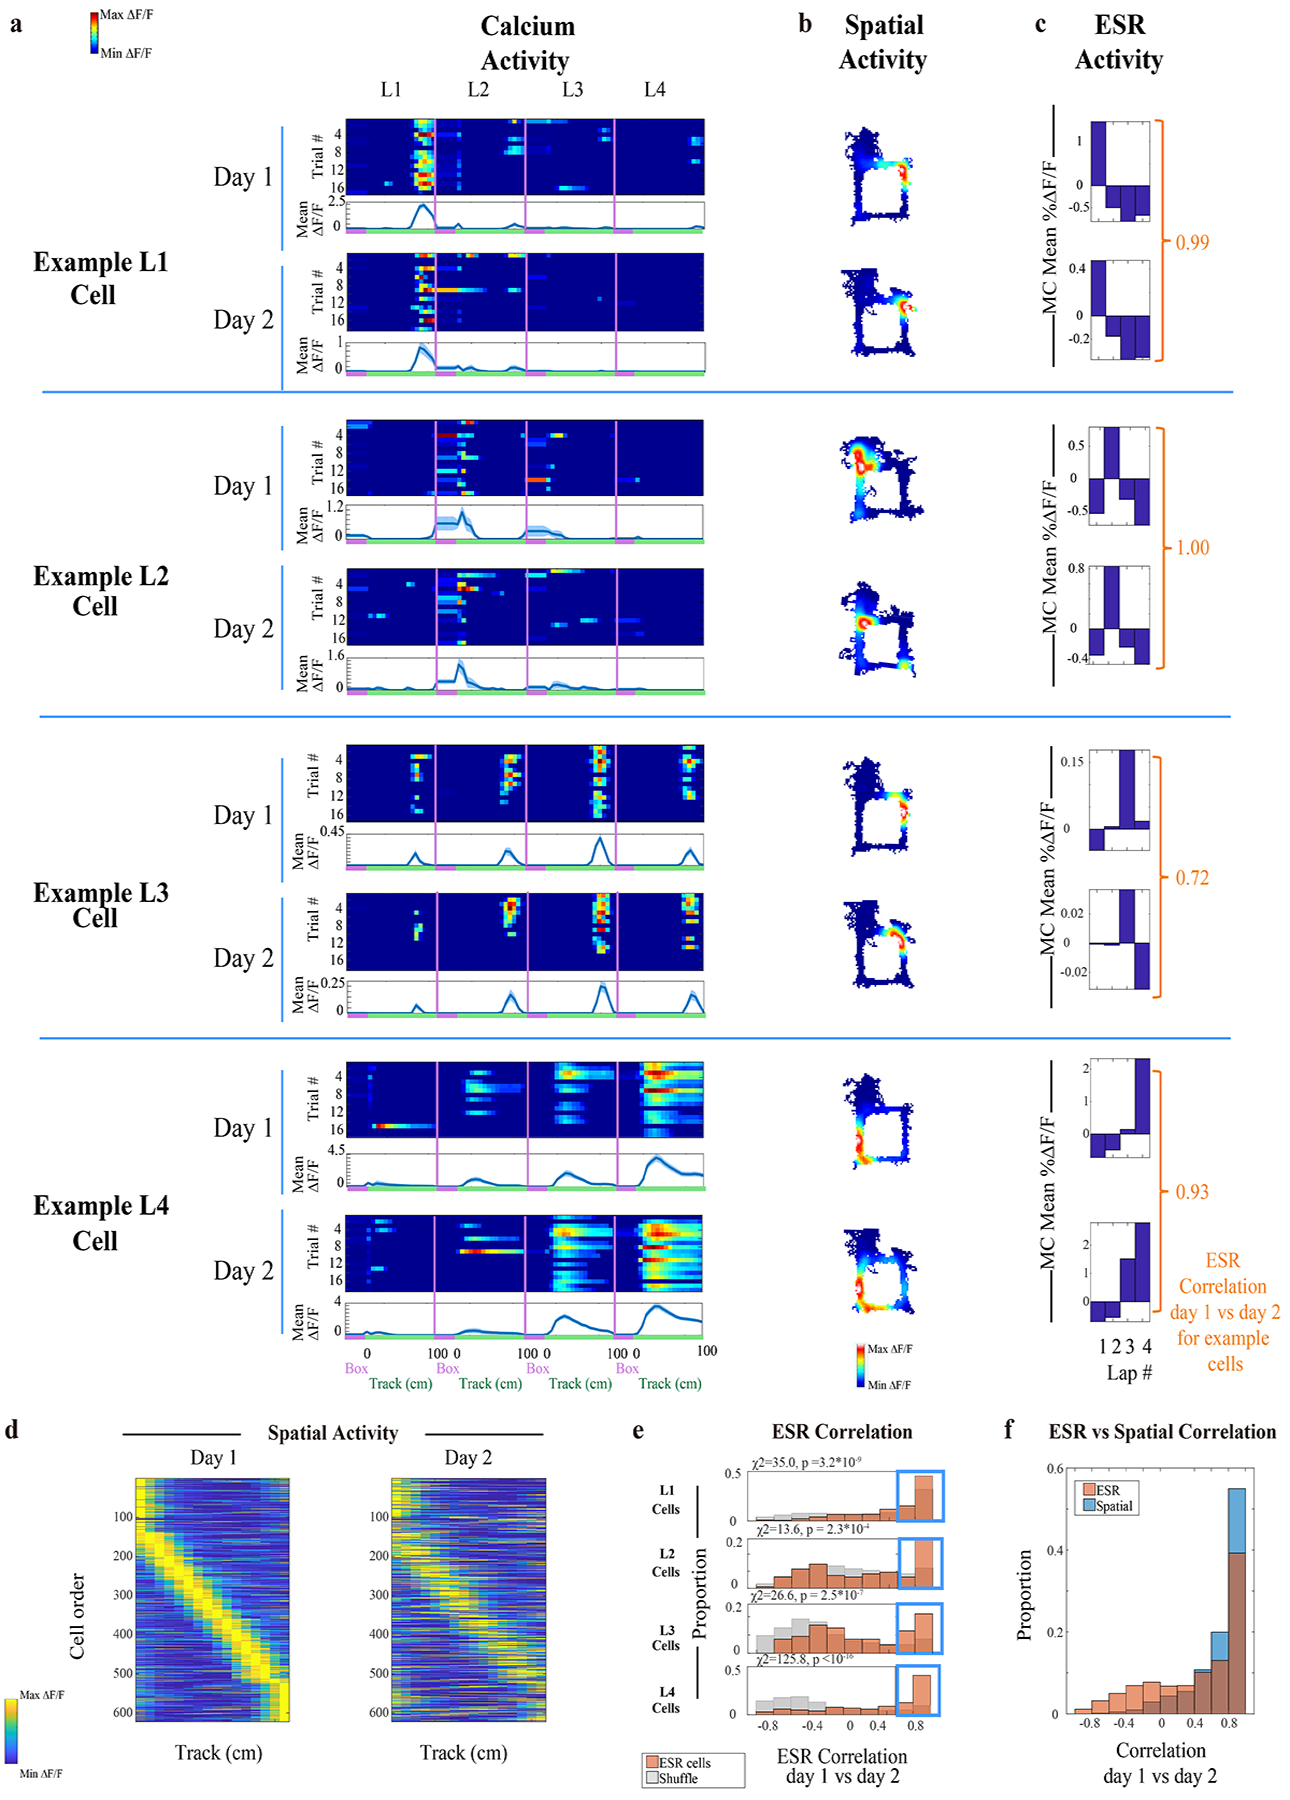
a—c) (a) Trial-by-trial calcium activity of example lap 1, 2, 3, and 4 preferring neurons, matched across 2 consecutive days. Top panel: trial-by-trial calcium activity; Bottom panel: trial averaged calcium activity (mean ±SEM). The number of trials for each cell is indicated in each figure panel (a). Standard error was cut off at 0 because negative activity does not exist. The (b) spatial activity and (c) ESR activity, as measured by MC calcium activity, were calculated for these example neurons. For each example neuron, the Pearson correlation between its ESR activity pattern across days was computed (c, side). This ESR correlation serves as an index of how well the ESR pattern was preserved across days.
d) Individual ESR cells’ calcium activity sorted by spatial location on the track during day 1, with this cell order matched across days, affirm preserved place fields across days (622 cells in total, n = 8 animals).
e) Summary data: Pearson correlation of ESR activity across days for these individual cells, plotted separately for lap 1, 2, 3 and 4 cell populations. (Orange): ESR activity of each individual cell on day 1, correlated with its own ESR activity on day 2. (Grey): ESR activity of each cell on day 1, correlated with ESR activity of arbitrary cells (i.e. shuffled cell identities) from day 2. The proportion of cells with highly preserved ESR patterns across days (i.e. cells with Pearson’s r > 0.6, shown in the Blue box) was significantly greater compared to shuffles. χ2 and p values are shown in the Figure. (622 cells total).
f) Individual cells show both high ESR correlations and high spatial correlations across days (622 cells).
ESR treats events as fundamental units of the experience
Several key results support the notion that ESR tracks lap events as discrete units of the experience, separate from the continuous moments which also make up the experience. Since previous studies2–5 showed that the hippocampus encodes continuously changing variables, we investigated the relationship between ESR activity and several continuous episodic variables more closely. Instead of tracking lap events, could ESR cells be tracking a particular duration of time since the start of the trial? Time cells3,4 require a reliable temporal delay period; otherwise they do not arise4. Because the animals in our task were allowed to behave freely, and took unpredictable and variable durations to complete the trials of the task (Extended Data Fig. 8a–b) and ran at varying speeds (Extended Data Fig. 9a–b, purple), ESR cells were unlikely to act as time cells in our task. Could ESR cells instead be representing the total distance continually travelled along the course of the 4-lap task since the start of the trial? When we elongated the maze in one dimension to twice the usual length (Extended Data Fig. 8c, Methods: task specific training), the ESR activity patterns were still significantly preserved across days (Extended Data Fig. 8f, Extended Data Fig. 8d–e: example cells; Extended Data Fig. 6b: raw ΔF/F), suggesting it unlikely that ESR cells directly track the continuous distance traveled.
We conducted another experiment to investigate whether laps are treated as units of experience. A 4-lap-per-trial task was conducted in which the maze was elongated on pseudo-randomly chosen laps of pseudo-randomly chosen trials (Fig. 3a left for trial types, Fig. 3b for full task schedule, Methods). Importantly, this maze was largely stripped of predictability in travelled distance but the 4-discrete lap structure was still preserved. A total of 27% of CA1 cells (306/1128 cells, n = 6 animals) active in all trial types of this experiment were significant ESR cells. For these cells, their ESR activity pattern during the standard (short SSSS) trials was still preserved during each of the pseudo-randomly elongated trial types (Fig. 3c–f; Fig. 3a right: example cell; Extended Data Fig. 6c: raw ΔF/F). Thus, ESR activity of this sizeable population of CA1 cells was unperturbed by arbitrary and unpredicted variations within the relevant lap event or even variations within neighboring (preceding and succeeding) lap events (Fig. 3a middle for illustration). For these cells, their ESR activity was preserved even during SSLL trials compared to LLSS trials (Fig. 3f), which were trials that had the same total distance (Fig. 3a middle) but had different internal segmentation into long and short laps. Therefore, ESR activity treats these lap events as separate units of the experience, unaffected by spatiotemporal variations within the current or neighboring event units.
Fig. 3: ESR treats events as fundamental units of experience.
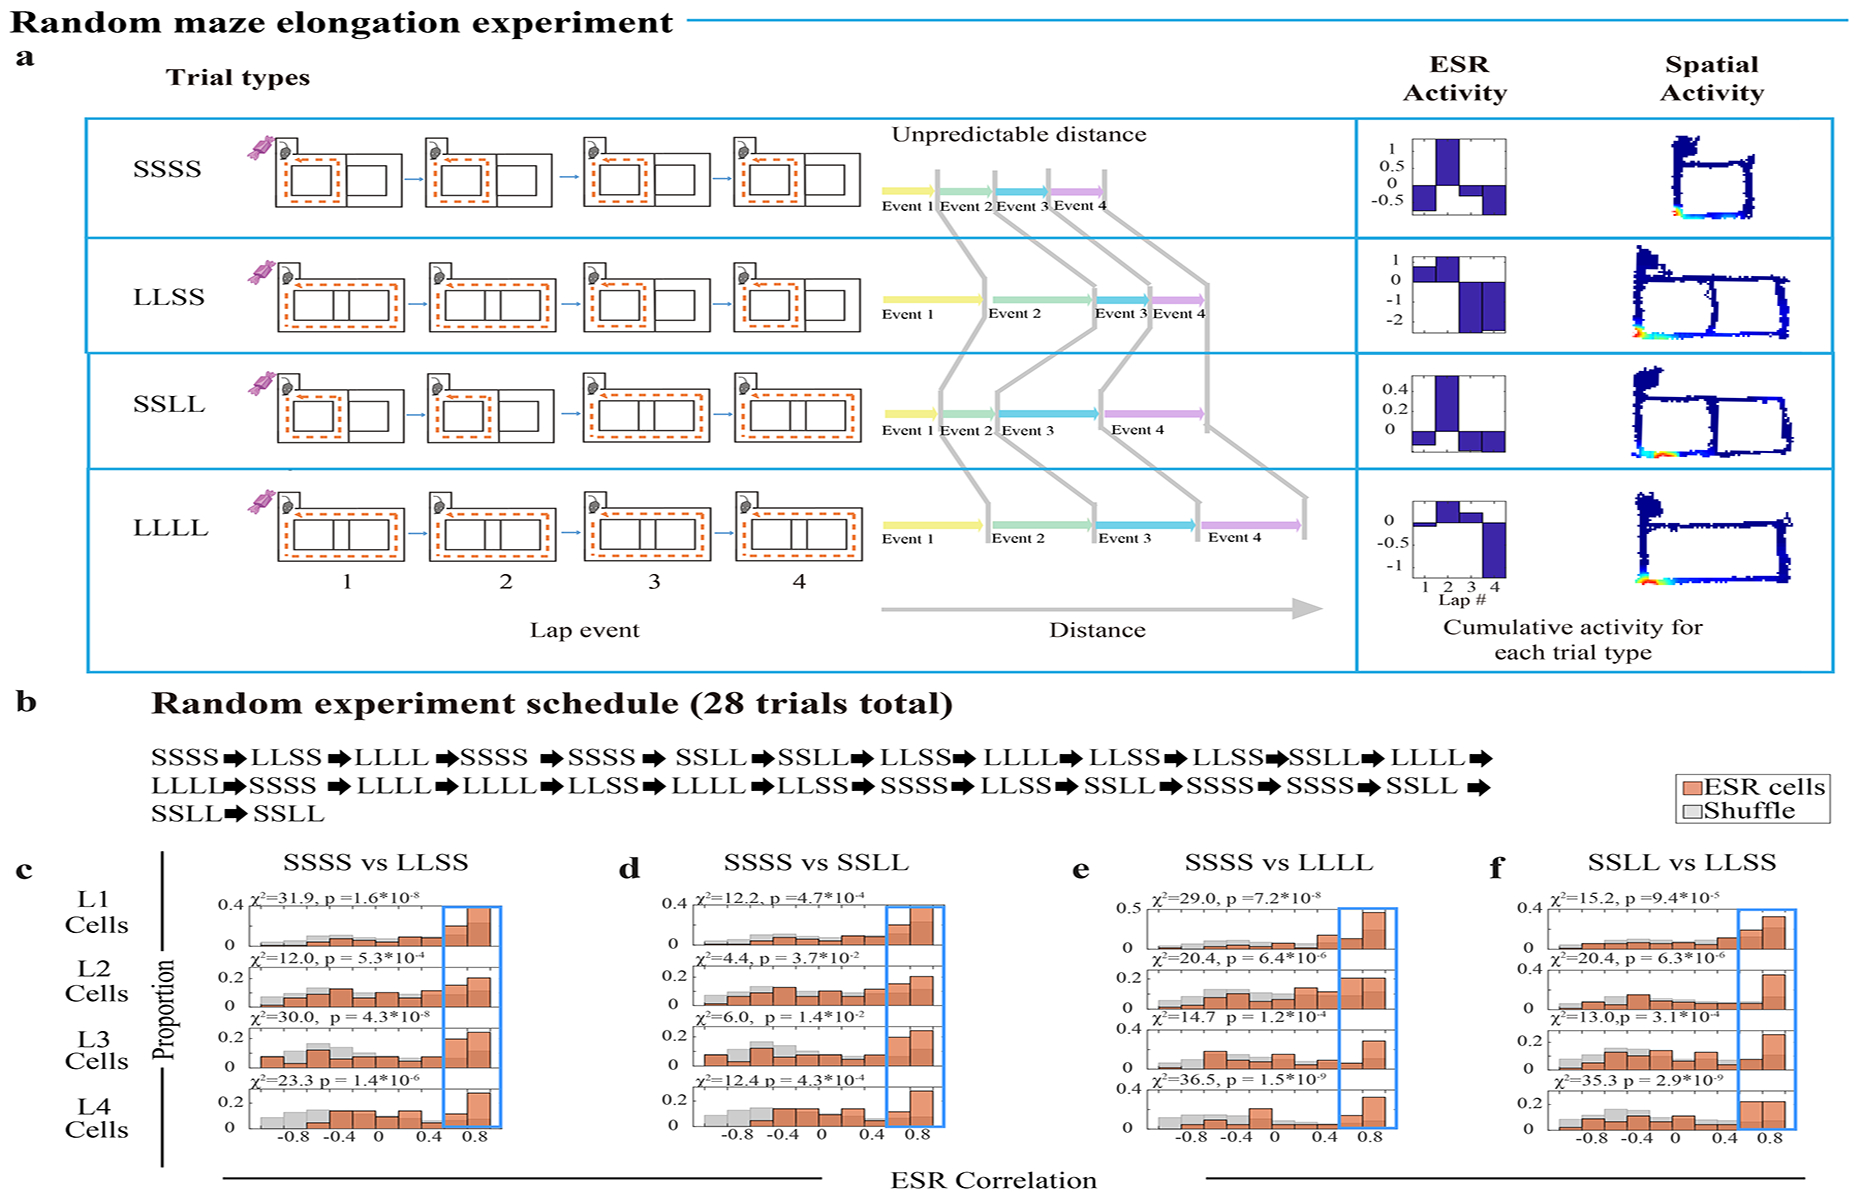
a) (left): Four (4) types of trials during the random maze elongation experiment: SSSS, LLSS, SSLL, LLLL. Each trial type has consistent 4-laps per reward structure despite variability within the lap events. S denotes a “short” lap. L denotes a “long” lap. (right): One example lap 2 cell: its ESR activity and spatial activity are shown during SSSS, LLSS, SSLL, and LLLL trials (top to bottom respectively).
b) Pseudorandom experiment schedule: 28 trials total with 7 trials pseudorandomly represented for each of the four types.
c—f) ESR correlations of individual cells during (c) standard 4-lap trials (SSSS) vs LLSS trials, (d) SSSS vs SSLL trials, (e) SSSS vs LLLL trials, or (f) SSLL vs LLSS trials (the same 306 cells, n = 6 mice, for each separate trial type comparison). The proportion of cells with highly preserved ESR patterns across trial types (Pearson’s r > 0.6, shown in the Blue box) was significantly greater compared to shuffles.
ESR activity is transferrable between experiences
The results thus far suggest that the lap events being tracked by ESR have a generalizable nature, robust against continuous variabilities like time (Extended Data Fig. 8a–b) or distance (Fig. 3a–f; Extended Data Fig. 8c–f). If this notion is correct, then we predict that ESR activity should exhibit a degree of independence from sensory and spatial content. To test this concept further, we conducted a two day experiment with the 4-lap-per-reward task on two geometrically distinct mazes. The standard square maze was used on the first day, and a circular maze was used on the second day (Fig. 4a; Methods: task specific training). Spatial activity of ESR cells globally remapped on the circular maze compared to the standard square maze, as a result of the different geometry of the maze (Fig. 4e; Fig. 4g: blue histogram; Fig. 4c: example cells; Extended Data Fig. 6d: raw ΔF/F). Nevertheless, a significant proportion of ESR cells tracked circular laps using the same lap-specific activity pattern as the corresponding square maze laps (176/461 total cells = 38% with ESR correlation > 0.6 across days; Fig. 4f; Fig. 4b, d: example cells). Thus the knowledge of lap-specificity acquired during the square maze was reused (transferred) when the animals were faced with the circular maze.
Fig. 4: ESR tracks lap events despite change in maze geometry.
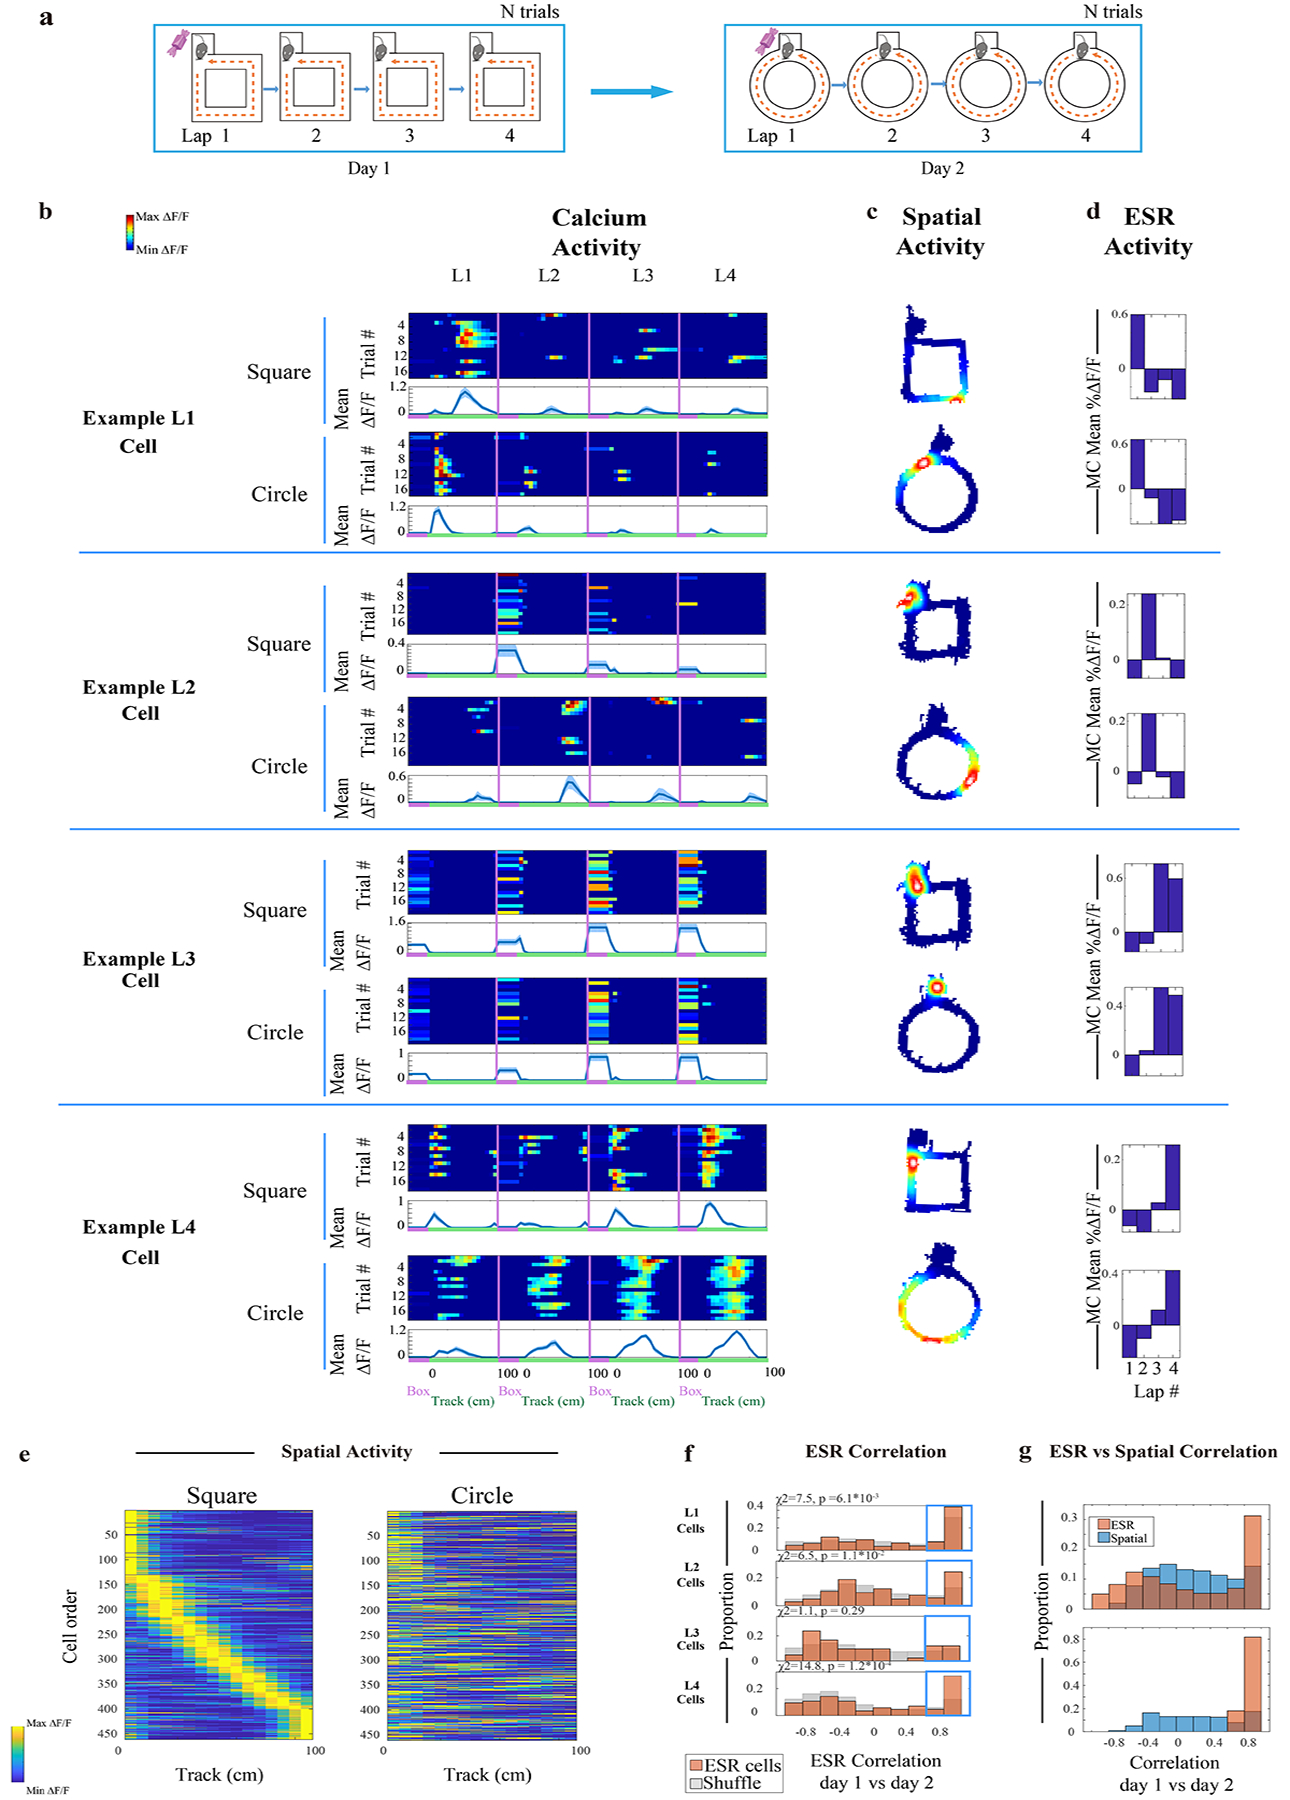
a) Circular maze experiment: Day 1: standard square maze and Day 2: circular maze.
b—d) Example lap 1, 2, 3, and 4 preferring neurons, with trial-by-trial calcium activity, spatial activity, and ESR activity matched across standard maze and circular maze sessions. The number of trials for each cell is indicated in each figure panel (b).
e) Individual ESR cells’ calcium activity sorted by spatial location on the square linear track during day 1, with this cell order matched across days (461 cells, n = 5 mice).
f) ESR correlations of these individual cells during the square maze vs circular maze sessions. The proportion of cells with highly preserved ESR patterns across days (Pearson’s r > 0.6, shown in the Blue box) was significantly greater compared to shuffles (461 cells total).
g) Top: Individual cells showed high ESR correlations while spatial fields remapped, during the circular maze experiment (461 cells). Bottom: Same plot applied to the subpopulation of “highly preserved” (i.e. ESR correlation > 0.6, See Fig. 2(e) for details) ESR cells: their spatial activity was also remapped (176 cells).
To further test the generalizable nature of these lap events, we modified the repetitive square maze by adding spatial trajectory variation. A two-day experiment was conducted in which the 4-lap-per-reward was preserved on the 2nd day, whereas the spatial trajectories were altered every two laps (Extended Data Fig. 10a, Methods: task specific training). Here, a significant proportion of lap 1–4 ESR cells still had preserved ESR activity across sessions (Extended Data Fig. 10d; Extended Data Fig. 6e: raw ΔF/F), coding laps 1–4, despite the animals’ experiencing differential spatial trajectories on different laps.
ESR tracks the relationships between events
The ESR does not reflect precise sensory information per se, so we hypothesized that it might instead reflect more generalized information from the structure of the task, such as the ordered relationships27,28 between the event units. This was suggested by the fact that the 4 lap events of our task are identical to one another in their sensory and spatial content, and yet, ESR activity still reliably distinguished each of the 4 lap numbers (lap 1, 2, 3, 4). To further test the hypothesis that ESR tracks the ordered relationships between events, we conducted two experiments.
First, we conducted an experiment in which the relationships between lap events were abolished. The standard 4-lap-per-trial experiment was conducted on the first day, but the once-in-four lap delivery of the reward (which serves as a temporal marker) was perturbed on the second day and instead the reward was provided every lap (Fig. 5a). We found that lap 1, 2, 3 and 4 ESR activity pattern preservation was significantly abolished across days (Fig. 5b–c).
Fig. 5: ESR tracks the relationships between events.
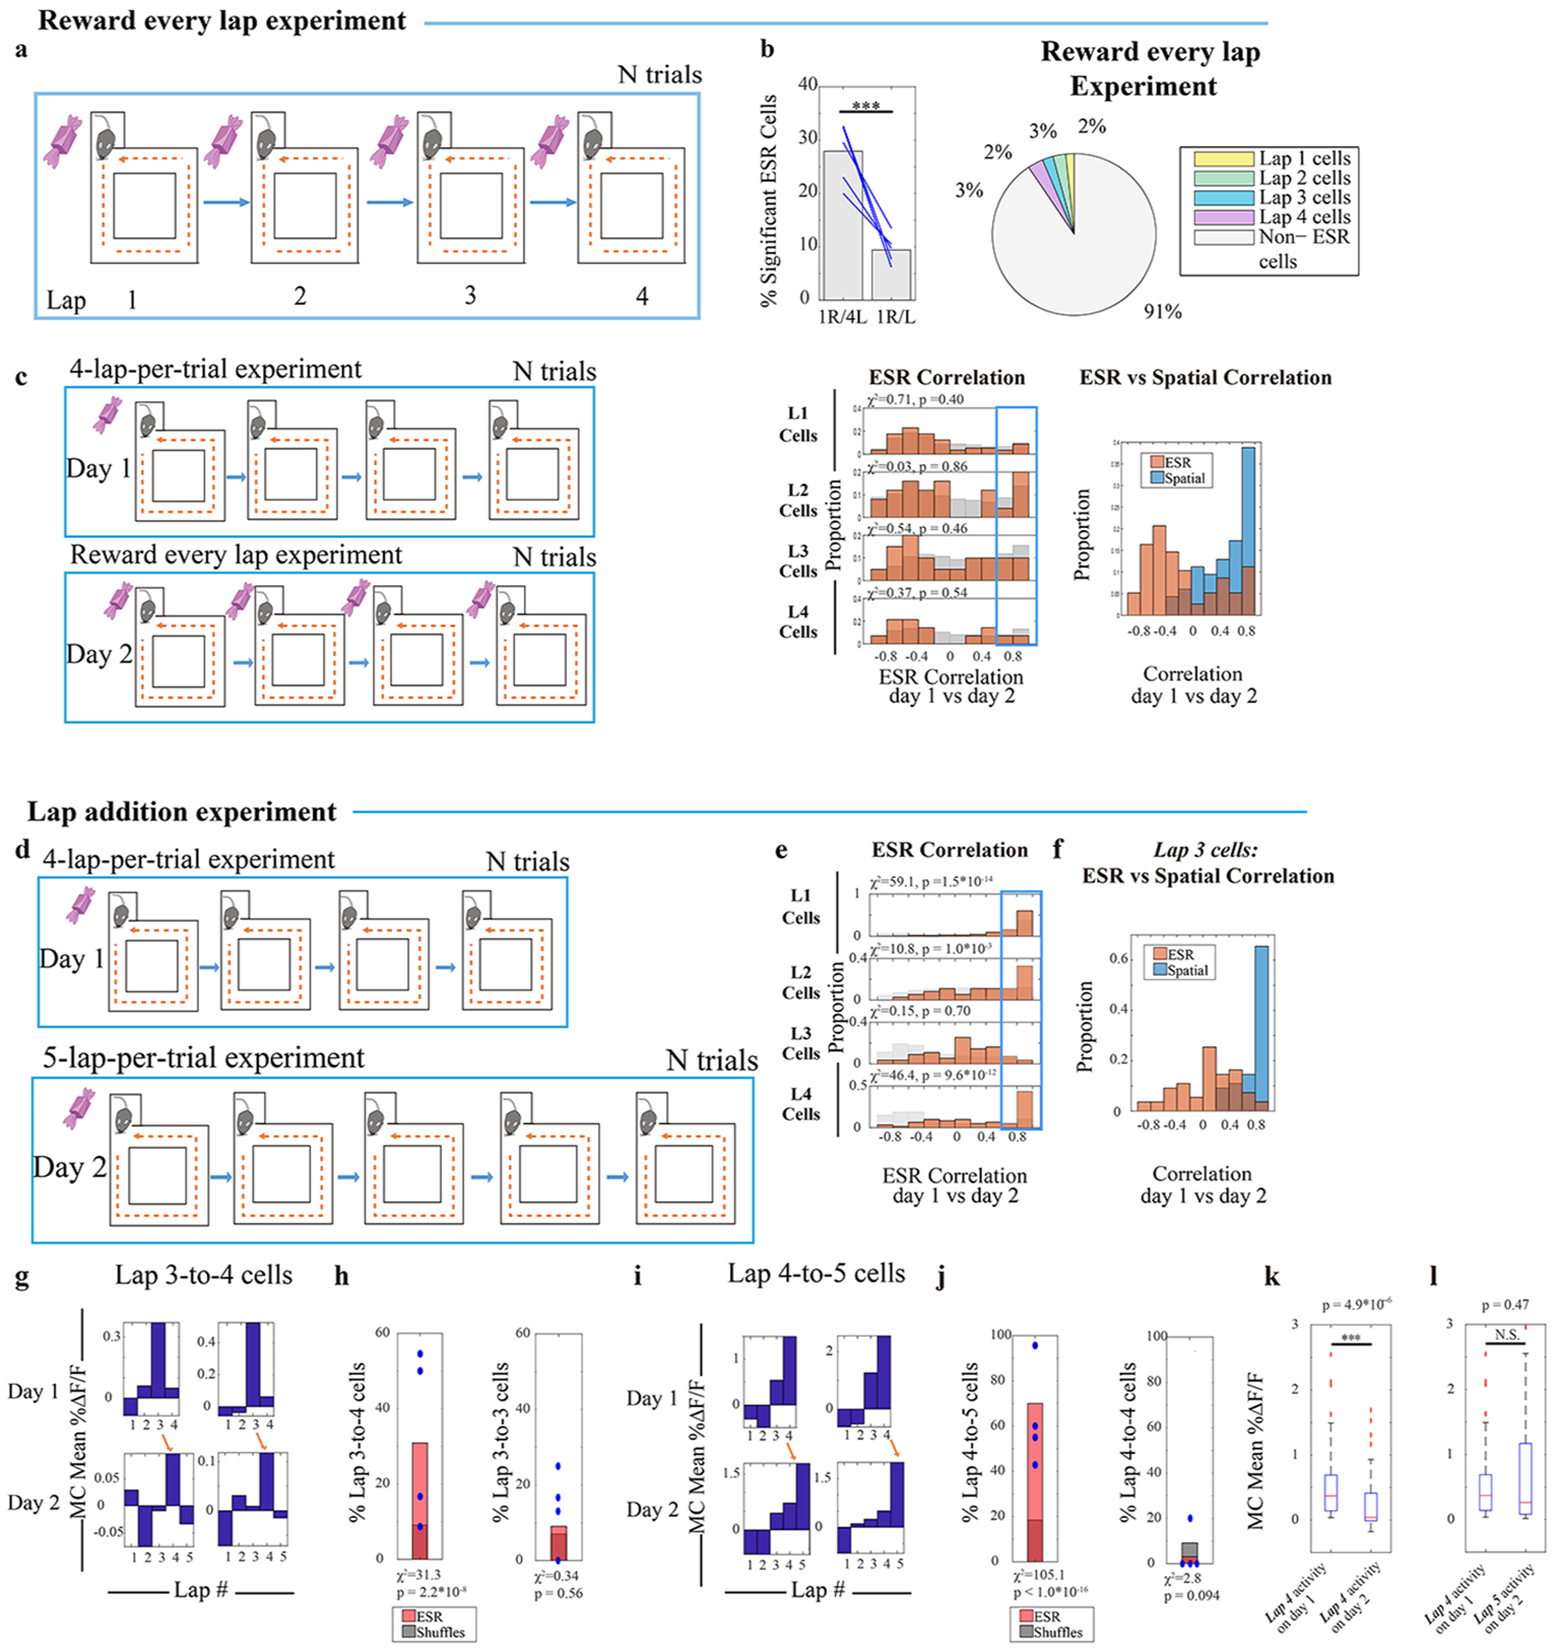
a—c) (a) Day 1: standard 4-lap-per-trial experiment and Day 2: reward every lap experiment. (b) ESR correlations across the standard 4-lap vs reward every lap experiment (134 cells, n = 3 mice). See Fig. 2(e) for description and methods. (c) Individual cells showed high spatial correlation while ESR representations were perturbed during the 4-lap vs reward every lap experiment (134 cells).
d) Lap addition experiment: Day 1: standard 4-lap-per-trial experiment and Day 2: 5-lap-per-trial experiment.
e) ESR correlations across the 4-lap and 5-lap experiment sessions (382 cells, n = 4 mice). See Fig. 2(e) for description and methods.
f) Individual Lap 3 cells showed high spatial correlation while ESR representations were perturbed, during the lap addition experiment (55 cells, n = 4 mice).
g) Two example neurons matched across 4-lap and 5-lap experiment sessions that transformed from lap 3 to lap 4 preference.
h) Percentage of cells that transformed from lap 3 to lap 4 preference (17/55 cells total, Blue marks: 4 mice).
(i) Two example neurons matched across 4-lap and 5-lap experiment sessions that transformed from lap 4 to lap 5 preference. (j) Percentage of cells that transformed from lap 4 to lap 5 preference (42/60 cells total, Blue marks: 4 mice). (k) MC activity of these cells from (j) during lap 4 on day 1 was significantly decreased during the same lap on day 2 (42 cells, Wilcoxon signed rank test: z= 4.57, p = 4.88*10−6). (l) MC activity of these cells from (j) during lap 4 on day 1 was not statistically different from MC activity during lap 5 on day 2 (42 cells, Wilcoxon signed rank test: z= −0.72, p = 0.47). Box and whisker plots display median, 25th and 75th percentiles (box), and maximum and minimum values (whiskers). * denotes p < 0.05, *** denotes p < 0.001, N.S., not significant.
Second, we conducted an experiment in which the relationships between the lap events were more subtly perturbed, and asked how this affects ESR activity. The standard 4-lap-per-trial experiment was conducted on the first day and a non-rewarded 5th lap was added to all the trials on the second day before reward eating (Fig. 5d, Methods: task specific training). On day 2, lap 1 and 2 cells had preserved ESR activity despite the added lap (Fig. 5e; Extended Data Fig. 6f: raw ΔF/F). On the other hand, lap 3 cells were abruptly and discretely perturbed (Fig. 5e–f). Indeed, a significant portion of lap 3 cells shifted to track lap 4 (Fig. 5g–h, 17/55 cells = 31%, n = 4 mice). In contrast, only 5/55 cells (= 9%) maintained their lap 3 preference.
Similarly, lap 4 cells shifted to track lap 5 (Fig. 5i–j). Although, overall, the pattern of most Lap 4 cell activity across the two days was well correlated (Fig. 5e), a significant proportion of lap 4 cells (42/60 cells = 70%, n = 4 mice, p < 10−4 compared to shuffling) showed a significant decrease in overall activity level during lap 4 on day 2 (Fig. 5k, Extended Data Fig. 6f right: raw ΔF/F) but also showed an apparent, concomitant restoration of activity level during lap 5 (Fig. 5l, Extended Data Fig. 6f right: raw ΔF/F). This decrease in activity during lap 4, and shift in activity by precisely one lap unit reflects the fact that the 4th lap is no longer rewarded, and that an extra lap is needed to fulfill the total requirement of 5 laps to receive reward. In contrast, only 2/60 cells (= 3%) maintained their lap 4 preference. Therefore, ESR track the skeletal structure of experience: it tracks events as fundamental units, and the ordered relationships between them.
ESR activity and spatial activity are jointly but separately represented in the same cells
ESR activity and spatial activity occur jointly in the same cells. But what is the relationship between these two representations? Within the confines of the standard 4-lap task (Fig. 1), ESR activity is manifested as the differential activity rate during each of the different laps (Fig. 1e) at the same spatial field location, and is therefore a form of rate remapping4,14,15 (Fig. 1e, Extended Data Fig. 1b). We then investigated whether this ESR activity pattern is necessarily tied to its particular place field location by testing whether ESR activity could be reciprocally and separately manipulable from the spatial activity.
When the maze and task were not altered in any way across days, both ESR activity patterns and spatial activity patterns remained unperturbed (Fig. 2f, 2d). In contrast, as we previously showed, the 4-lap task conducted on a circular maze geometry distorted the spatial activity but ESR activity remained largely intact (Fig. 4g, 4c), showing that ESR activity is not tied to its particular place field location. Can the converse result, an alteration of ESR activity pattern without concomitant alteration of the spatial activity pattern, be observed? First, perturbing the relationships between events by adding a lap (Fig. 5d) altered some ESR activity patterns (Fig. 5g–l, Fig. 5f, orange histogram) but spatial activity was still preserved in the same cells (Fig. 5f, blue histogram). Second, we investigated MEC axonal terminal inhibition in CA1 and asked how it affects the ESR activity versus the spatial activity patterns. Medial entorhinal cortex (MEC) input into hippocampus has been implicated in the sequential organization of experiences29–31, although this is not the only brain region to be so implicated32,33. Based on these earlier studies, a virus expressing inhibitory opsin (AAV2/2-EF1a-DIO-eNpHR3.0-mCherry) was injected bilaterally into the MEC sub-region of pOxr1-Cre mice34,35 (Fig. 6a, b). In addition, a virus expressing the calcium indicator GCaMP6f (AAV2/5-CamKII-GCaMP6f-WPRE-SV40) was unilaterally injected into dorsal CA1 (dCA1) of the same mice (Fig. 6a). An opto-endoscope was implanted above dCA1 to enable long-term calcium imaging as well as optogenetic inhibition of the axonal terminals from MEC neurons in dCA1. The mice ran 28–40 trials of the 4-lap task where the trials alternated between optogenetic inactivation (Light-On) and no inactivation (Light-Off) (Fig. 6c) of the MEC axonal terminals. Inactivation of MEC terminals in dCA1 did not change the spatial activity patterns in dCA1 (Fig. 6i: blue histogram, Fig. 6g; Fig. 6e: example cells), consistent with previous studies30. And yet, this inactivation altered ESR activity patterns in the same cells (Fig. 6h, Fig. 6i: orange histogram, Fig. 6d–f: example cells). By contrast, control mice that were injected with AAV2/2-EF1a-DIO-mCherry (i.e. no eNpHR3.0) had preserved ESR activity patterns across Light-On and Light Off trials (Fig. 6j – k).
Fig. 6: ESR activity and spatial activity are separately manipulable.
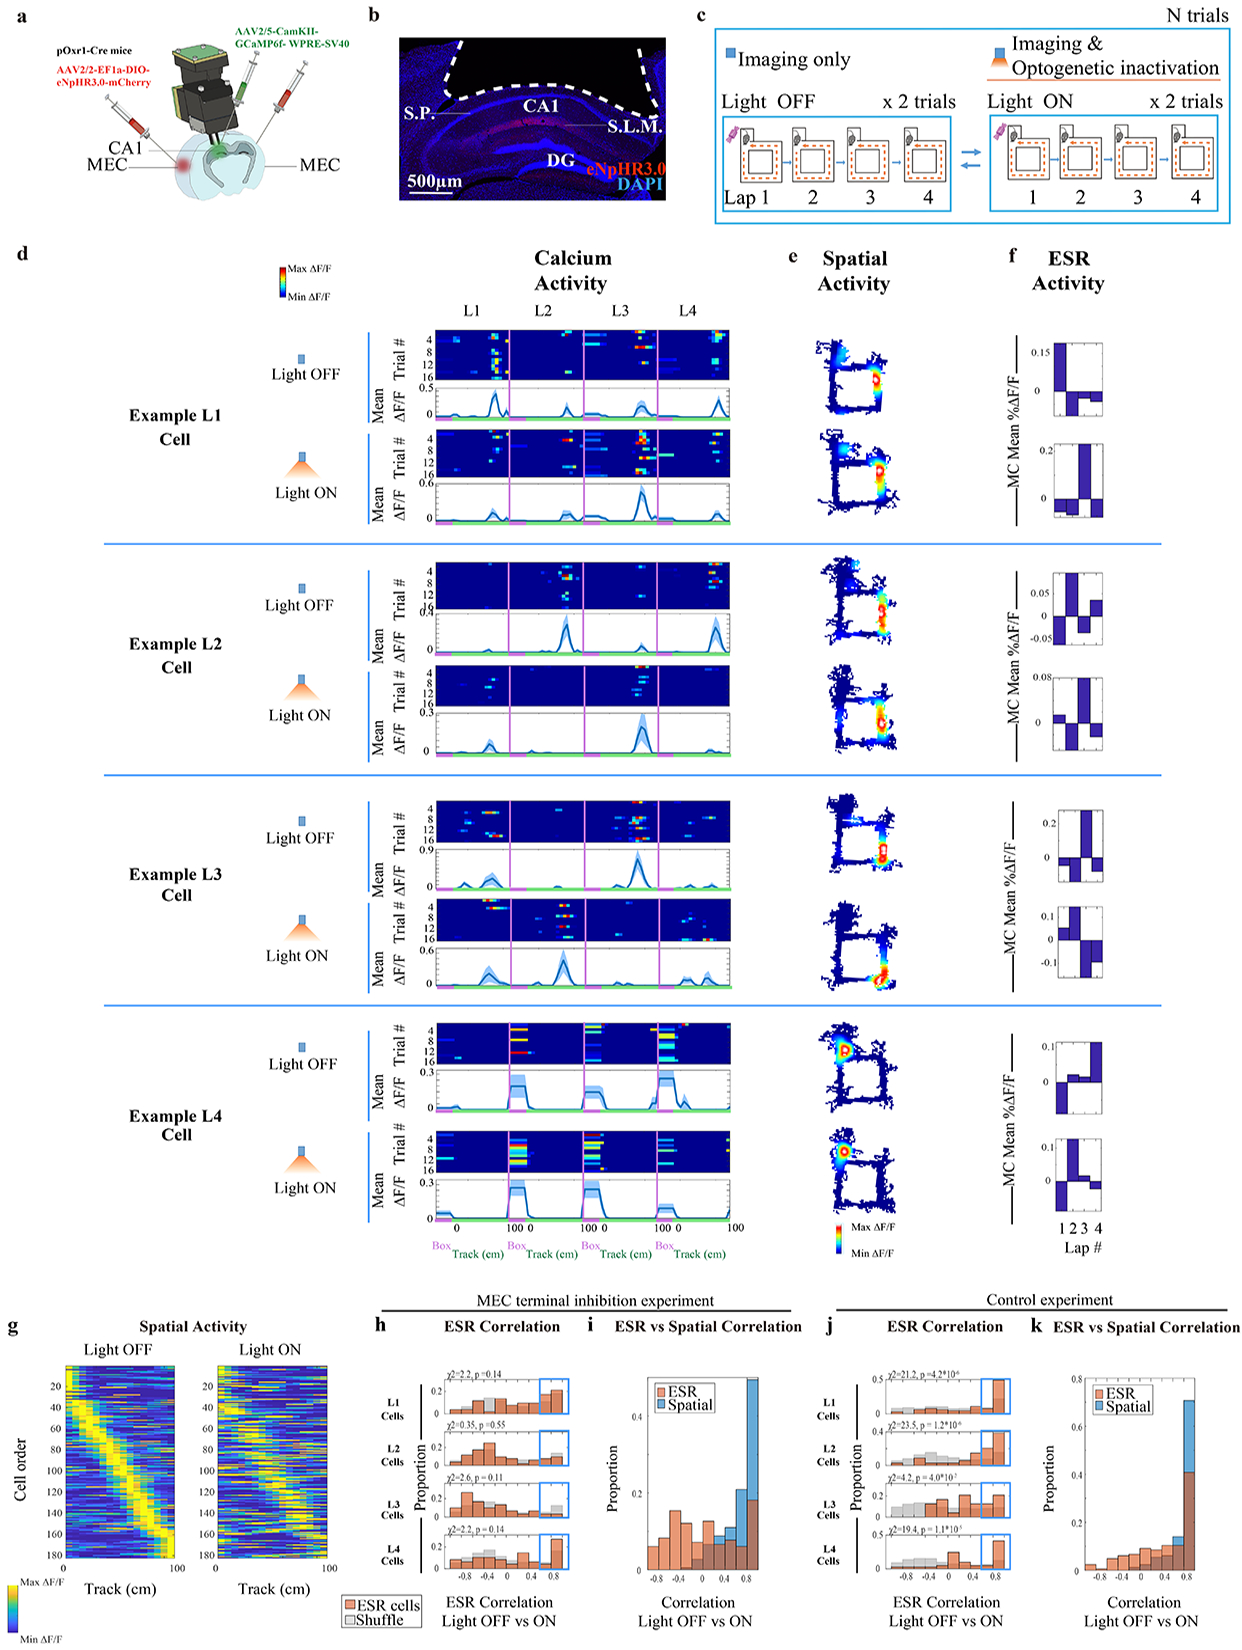
a) CA1 imaging and MEC terminal inhibition in CA1 were conducted simultaneously
b) Coronal section of hippocampus showing area of cortex aspiration (white dotted line) and MEC inputs labelled with eNpHR3.0 (red). S.L.M. = stratum lacunosum moleculare. S.P. = stratum pyramidale.). Representative of aspiration surgeries from n = 6 pOxr1-Cre mice.
c) During the standard 4-lap-per-trial experiment, optogenetics light-On and light-Off conditions alternated every 2 trials, for a total of 32–40 trials.
d—f) Example lap 1, 2, 3, and 4 preferring neurons, with trial-by-trial calcium activity, spatial activity, and ESR activity matched across the light-Off vs light-On trials. The number of trials for each cell is indicated in each figure panel (d).
g) Individual ESR cells’ calcium activity sorted by spatial location on the track during day 1, with this cell order matched across days (182 ESR cells, n = 3 mice).
h) ESR correlations of these individual cells across light-On vs light-Off. The proportion of cells with highly preserved ESR patterns across conditions (Pearson’s r > 0.6, shown in the Blue box) was not significantly different compared to shuffles. χ2 and p values shown in the Figure. (182 cells total).
i) Individual cells showed high spatial correlations while ESR representations were perturbed across light-On vs light-Off conditions (182 cells).
j) ESR correlations across light-On vs light-Off conditions for control mice injected with AAV2/2-EF1a-DIO-mCherry (164 ESR cells, n = 3 mice).
k) Individual cells from these control mice showed high spatial correlations and ESR correlations across light-On vs light-Off conditions (164 cells).
Taken together, the lap-specific activity pattern (ESR) is reciprocally and independently manipulable from spatial activity, although the two representations are expressed jointly in the same cells.
Discrete event modulated activity occurs together with continuous non-spatial activity
ESR activity and spatial activity are jointly represented in the same cells. What happens when the main continuous changes in the experience are not spatial? To answer this question, we conducted another 4-lap-per-trial experiment in which the first arm of the standard 4-lap-per-trial maze was replaced by a treadmill (Fig. 7a). Animals ran for 12s on the treadmill at 14 cm/s on every lap. Monitoring activity of neurons on a treadmill obviates the necessity of model corrections for running speed and head direction changes (Fig. 1g) because they are nearly constant on the treadmill (Extended Data Fig. 9a–b). Consistent with previous studies, cells are active during this non-spatial treadmill period3,4 (Fig. 7d, Fig. 7b). During the period restricted to the treadmill, 20% of CA1 cells (243/1222 cells, n = 5 animals) had significantly lap-modulated activity (Fig. 7g, Methods, and examples: Fig. 7e) which exhibited a systematic lap-modulated pattern that was robust across trials (Fig. 7f). The percentage of ESR cells was reduced when reward was given every lap (6% = 42/681 cells, n = 3 animals, Fig. 7h–j). These results indicate that the tracking of experiences by the hippocampus occurs a joint manner with an event-specific representation along with a continuous variable-tracking representation, even when the continuous experience is primarily non-spatial in nature.
Fig. 7: Discrete ESR activity occurs together with continuous non-spatial activity.
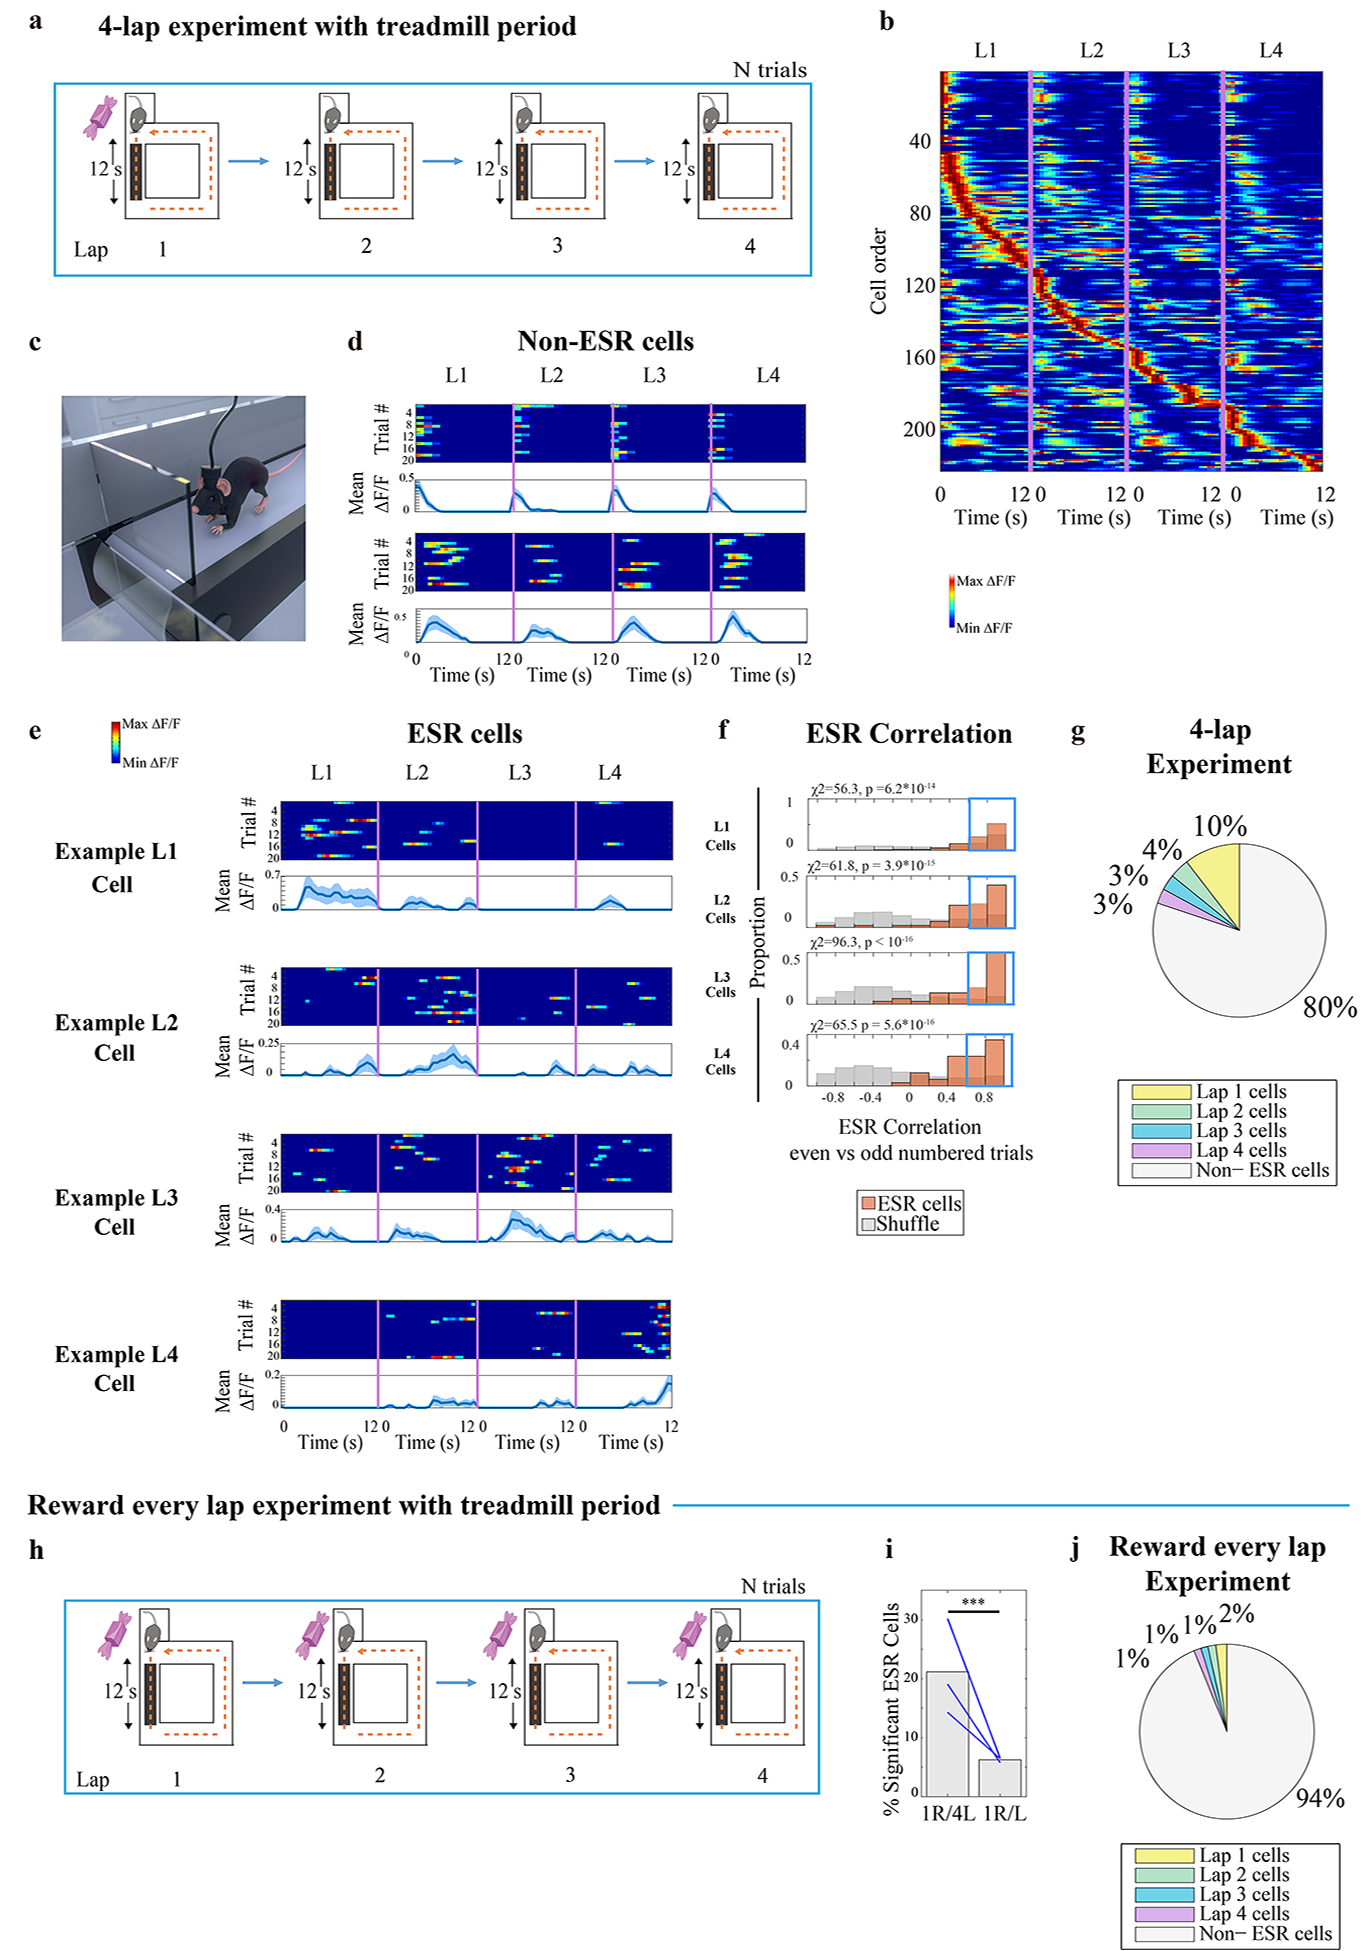
a) 4-lap-per trial experiment with 12s treadmill period on each lap. ESR activity in this experiment was only investigated during the treadmill period.
b) CA1 calcium activity sorted by time (s) of activity on the treadmill and lap number showed activity at the same time on every lap but displayed a higher activity level during a specific lap compared to other laps (222 cells from example animal).
c) Cartoon of mouse running during the treadmill period. The maze and door were not transparent in the task; shown transparent here for illustration of the treadmill below.
d—e) Trial-by-trial calcium activity of (d) example neurons that did not have lap preference, and (e) example lap 1, 2, 3, and 4 preferring neurons, respectively. Top panel: trial-by-trial calcium activity; Bottom panel: trial averaged calcium activity (mean ±SEM). The number of trials for each cell is indicated in each figure panel (d—e). Standard error was cut off at 0 because negative activity does not exist).
f) ESR correlations between even numbered trials vs odd numbered trials of individual ESR cells (243 cells, n = 5 mice) as an indicator for preservation between trials, within the session. The proportion of cells with highly preserved ESR patterns across trials (Pearson’s r > 0.6, shown in the Blue box) was significantly greater compared to shuffles.
g) Summary statistics: Percentage of ESR cells in the whole CA1 pyramidal population that were tuned to lap 1, 2, 3, or 4, in the 4-lap treadmill experiment (1222 cells, n = 5 mice).
h) Task schedule: reward was given to the animal following every lap. Every lap contained a 12s treadmill period.
i) The percentage of significant ESR cells was significantly higher during the 4-lap-per-trial task (147/696 cells total) compared with the same animals during the reward every lap task (42/481 cells), all during the treadmill period (: χ2 =65.0, p = 7.8*10−16, Blue lines: 3 mice).
j) Summary statistics: Percentage of ESR cells in the whole CA1 pyramidal population that were tuned to lap 1, 2, 3, or 4, during the reward every lap experiment during the treadmill period (681 cells, n = 3 mice).
*** denotes p < 0.001.
DISCUSSION
ESR tracks discrete units of experience
While mice ran a 4-lap-per-reward task, approximately 30% of individual CA1 pyramidal neurons exhibited calcium activity levels that were significantly higher during one of the four laps. This ESR activity tracked the identities of laps despite variations in time duration needed to cover the lap events (Extended Data Fig. 8a–b) and even when pseudorandom variations in distance travelled were introduced during lap events (Fig. 3a–f). Therefore, ESR activity treats lap events as separate event units that are unaffected by spatiotemporal variations within current or neighboring events. In CA1 pyramidal cells, the ESR activity and spatial activity are jointly represented, so CA1 cells are active at a particular spatial field on the maze, at a differential activity rate. But ESR activity tracks the lap identity even when this CA1 cell’s spatial field was moved to an arbitrary location on a different maze (Fig. 4). Taken together, this shows that ESR treats different locations of a particular lap as part of the same event unit. When ESR was changed, it changed as a discrete, lap-specific shift—rather than gradually through the course of the task experience (Fig. 5e–f: lap 1–2 not shifted vs 3–4 shifted).
Our finding of the ESR phenomenon is consistent with the theoretically derived concept36,37 and data obtained by human imaging studies6–9,13 that alongside codes tracking continuous changes in spatial and sensory content, the brain tracks an experience by identifying one discrete, unitary event after another, as the entire experience progresses. These previous studies showed the brain’s involvement in event segmentation by showing heightened Blood Oxygen Level Dependent (BOLD) activity at the boundaries between events9, an observation that was recently confirmed by electrophysiology17. Our present study provides further insight into the encoding of events by identifying a representation within single cells (ESR activity) that is tuned to the event units themselves, rather than solely the event boundaries. ESR activity treats these events as fundamental units that make up the experience, and could therefore be part of the neurophysiological basis for encoding events by the brain.
ESR tracks abstract, relational features of events and could support “transfer learning”
Recent human imaging and computational studies10–13, including a computational model termed the “Eichenbaum-Tolman machine”38, have suggested that the hippocampus is involved in coding the abstract structure which composes an episodic experience. Consistent with these studies, our present work, at the single cell level, suggests a hippocampal activity pattern (ESR) that not only tracks events, it tracks these events as putatively abstract entities. Indeed, our results show that the ESR consistently tracked lap events, irrespective of concrete sensory and spatiotemporal variations within the events (Fig. 3, Fig. 4, Extended Data Fig. 8, Extended Data Fig. 10). Furthermore, ESR tracks the abstract and iterative relationships between events. In fact, we show that ESR activity reliably distinguishes the 4 lap events which are materially identical to one another but differ in their iterative and ordered relationships to the preceding and succeeding lap numbers (Fig. 1f, 1h). Could the ESR differentially represent the 4 laps simply because it represents an internal variable like the gradually increasing level of motivation for acquiring another reward39? This is unlikely for two reasons. First, ESR activity patterns are not affected by arbitrary variations in the time and travelled distance required to complete the trial and receive reward (Fig. 3). Even during LLLL trials, which were presented to the animal in an unpredictable fashion and where the animal had to run on a maze length that was twice as long as the standard maze in order to reach reward (Fig. 3e), ESR activity patterns remained lap specific. Second, when an additional 5th lap was added to every trial in the task, lap 3 and 4 cells changed their activity on their respective lap, and shifted their activity by precisely one lap unit (Fig. 5d–l). This result suggests that ESR cells differentiate between the lap numbers as the animal’s running progresses, and reflects the precise knowledge that lap number 4 is no longer rewarded, and that a 5th counted lap is now necessary to receive reward. Altogether, our results indicate that ESR tracks the skeletal structure of experience via events as abstract entities, with abstract relationships between them.
In real life there are few truly novel experiences: most new experiences share either physical or abstract features with past experiences10,12,28,40,41. Learning a new task is improved through the transfer of knowledge from the web of related tasks that have already been learned, a phenomenon called “transfer learning”42–45. ESR appears to track the events as abstract units and their abstract relationships, and may therefore facilitate the transfer of knowledge between experiences that share these abstract features even if concrete spatial and sensory stimuli are distinct. Indeed, when the geometry of the maze was shifted from square to circular under the 4 laps per reward conditions (Fig. 4), ESR activity was significantly maintained (Fig. 4f, 4d, 4g: orange histogram) across these different experiences even though place field activity was globally remapped (Fig. 4c, 4e, 4g: blue histogram). ESR activity could therefore capture not only the abstract structure within an experience (Fig. 1d, Fig. 3a–f), but also provides the elements (events) that can be reused during a different experience (Fig. 4).
ESR activity is independently manipulable from continuous spatial activity
Previous studies demonstrated that hippocampal cells change their firing rate in a particular spatial field in response to broader experiential changes, including sensory cues and past and future trajectory changes1,4,14–16,18,46–49. This has been termed rate remapping. Consistent with these studies, ESR also showed up as a pattern of rate remapping (Fig. 1e), within the confines of the standard 4-lap task.
Yet, ESR activity possesses an additional property: the pattern of rate remapping (i.e. ESR activity) is maintained (Fig. 4g), even when the place field location is moved to a new spatial location. These data indicate that ESR is not tied to a particular place field location. In a reciprocal manner, ESR activity patterns could also be perturbed without a concomitant perturbation of spatial activity patterns, for instance by the addition of a lap into the task (Fig. 5f) and also by optogenetically inhibiting incoming MEC fibers (Fig. 6). ESR activity’s influence on neuronal activity is therefore mechanistically separate from the spatial activity’s influence. Together, these results demonstrate that ESR activity is reciprocally and independently manipulable from spatial activity, without affecting each other.
What are the benefits of tracking experience in a joint manner with both discrete and continuous representations? In fact, the two neural representations track different aspects of the same episodic experience. The tracking of immediate experience within an event likely requires a level of detail that would be best served by a continuous (spatial or non-spatial) neural representation. On the other hand, tracking extended experience in a compact, flexible, and generalizable way likely requires a level of abstraction above the moment to moment variational details and may be best served by encoding discrete and abstract event units. Ultimately, we found that ESR activity tracks events as fundamental units, is transferable between different experiences, and is independently manipulable from continuous spatial activity. We propose that it might therefore constitute an independent code from the spatial code: an “event code” that is dedicated to tracking events as discrete units of experience, alongside codes monitoring continuously changing variables. This event code may help the brain track experience in an efficient and flexible manner.
METHODS
Animals
All procedures relating to mouse care and treatment conformed to the Massachusetts Institute of Technology (MIT)’s Committee on Animal Care guidelines and NIH guidelines. Animals were individually housed in a 12 hour light (7pm-7am)/dark cycle. Twenty four male Wfs1-Cre mice aged between 2–4 months were implanted with Inscopix microendoscope into CA1 and food restricted to 85–90% normal body weight for the experiments. For each of the six main maze manipulation imaging experiments (random maze elongation experiment, circular maze experiment, lap addition experiment, treadmill experiment, fixed maze elongation experiment, spatial alternation experiment) the number of animals used (at least 4) is indicated in the main text for each experiment. In each of these experiments, at least two of these tested animals did not previously undergo any of the other manipulative experiments. The other animals were experienced animals from the other manipulative experiments. Significant ESR cells were found during each of these maze manipulation sessions (Supplementary Fig. 2–3). Six pOxr1-Cre mice (3 for the MEC terminal inhibition experiment and 3 control mice), aged 2–4 months, were also implanted with Inscopix microendoscope into CA1 for dual imaging and optogenetics experiments, and trained in a same manner as Wfs1-Cre mice.
Histology and Immunohistochemistry
Mice were transcardially perfused with 4% paraformaldehyde (PFA) in phosphate buffered saline (PBS). Brains were then post-fixed with the same solution for 24 hours, and brains were sectioned by using a vibratome. Sections were stained by DAPI. Micrographs were obtained using a Zeiss AxioImager M2 confocal microscope using Zeiss ZEN (black edition) software.
Preparation of Adeno-Associated Virus (AAV)
The AAV2/5-Syn-flex-GCaMP6f-WPRE-SV40 was generated by and acquired from the University of Pennsylvania Vector Core, with a titer of 1.3*10^13 genome copy/ml. The AAV2/5-CamKII-GCaMP6f-WPRE-SV40 was generated by and acquired from the University of Pennsylvania Vector Core, with a titer of 2.3*10^13 genome copy/ml. The AAV2/2-EF1a-DIO-eNpHR3.0-mCherry was generated by and acquired from the University of North Carolina (Chapel Hill) Vector Core, with a titer of 5.3*10^12 genome copy/ml.
Stereotaxic Surgery
Stereotactic viral injections and microendoscope implantations were all performed in accordance with Massachusetts Institute of Technology (MIT)’s Committee on Animal Care guidelines. Mice were anaesthetized using 500 mg/kg avertin. Viruses were injected by using a glass micropipette attached to a 10 μl Hamilton microsyringe through a microelectrode holder filled with mineral oil. A microsyringe pump and its controller were used to control the speed of the injection. The needle was slowly lowered to the target site and remained for 10 minutes after the injection.
For CA1 imaging experiments, unilateral viral delivery into the right CA1 of the Wfs1-Cre mice was aimed at coordinates relative to Bregma: AP: −2.0 mm, ML, +1.4 mm, DV, −1.55 mm. Wfs1-Cre mice were injected with 300 nl of AAV2/5-Syn-flex-GCaMP6f-WPRE-SV40. Approximately one month after injection, a microendoscope was implanted into the dorsal part of CA1 of the Wfs1-Cre mice aimed at coordinates relative to Bregma, at: AP: −2.0 mm, ML, +2.0 mm, and DV at approximately −1.0 mm. To implant at the correct depth, the cortex was vacuum-aspirated which resulted in the removal of corpus callosum, which is visible under surgery microscope as fibers running in the medial-lateral direction. The fibers of the alveus, which are visible as fibers running in the anterior-posterior direction, were left intact by the procedure.
For CA1 optogenetic and imaging experiments, 300 nL (AAV2/5-CamKII-GCaMP6f- WPRE-SV40) unilateral viral delivery into the right CA1 of the pOxr1-Cre mice was aimed at coordinates relative to Bregma: AP: −2.0 mm, ML, +1.4 mm, DV, −1.55 mm, and 300 nL (AAV2/2-EF1a-DIO-eNpHR3.0-mCherry) bilateral viral delivery into the MEC of these mice were aimed at coordinates relative to Bregma: AP: −4.85 mm, ML, ±3.45 mm, DV, −3.35 mm. Control pOxr1-Cre mice received the same CA1 viral delivery, and also received a bilateral delivery into MEC, but the bilaterally delivered virus was the control virus AAV2/2-EF1a-DIO-mCherry. Following these virus injections, the micro-endoscopy lens was implanted in the same manner for these dual optogenetic and imaging experiments, as described above for CA1 imaging experiments.
The baseplate for miniaturized microscope camera was attached above the implanted microendoscope in the mice. After experiments, animals were perfused, and post hoc analyses were examined to determine actual imaging position in CA1 (Fig. 1c, Fig. 6b).
Apparatus description and Experimental conditions
The apparatus was a square maze 25 cm in length and width, with a 5cm wide track width, and 7 cm height. A 10 cm × 10 cm square reward box was located in one corner of the square maze. Sugar pellets (Bio-Serve, F5684) were placed in the reward box at the beginning of lap 1 of each trial. Four versions of this apparatus were used. Version 1 was used in Fig. 1, 2, 5, and 6. Version 2 used in Fig. 3 had a length elongation to twice the standard length (50 cm = 2 ×25 cm), but was otherwise identical to Version 1 in other dimensions. Version 3, used in Fig. 7‘s treadmill experiment, had a 18 cm long treadmill installed in the arm of the maze that immediately faces the reward box (Fig. 7a). Version 3 otherwise used the same dimensions as Version 1. Version 4, used in Extended Data Fig. 10, had an 8-maze configuration, with the other square of the 8-maze being 25 cm in length and width as well. Version 4 otherwise used the same dimensions as Version 1. The circular maze used in Fig. 4 was constructed to have the same total path length (i.e circumference) as the Version 1 square maze, as well as the same reward box size. All mazes were opaque and black.
All maze experiments were done on under dim light conditions, with prominent visual cues within 50 cm on all sides of the box. Ca2+ imaging in the maze lasted at least 20 minutes in order to collect a sufficient number of Ca2+ transients to power our statistical analyses. The maze surface was cleaned between sessions with 70% ethanol. Immediately before and after imaging sessions, the mouse rested on a pedestal next to the maze.
The basic task in this manuscript is the standard 4-lap-per-trial task, where animals traversed round a square maze 25cm in length (1m journey in total) (Fig. 1d). The task was designed so that a sugar pellet reward was delivered manually to the reward box, at the beginning of lap 1, once every 4 such laps, which we call a single ‘trial’ (Fig. 1d). Identical motions were made on each lap, regardless whether a pellet was delivered or not. During the testing, animals completed 15–20 of such trials in repetitive succession without interruption. For any behavioral session in which the animal missed going into the reward box more than once in the entire sequence of runs (15 to 20 × 4 = 60 to 80 runs in total), the experiment was excluded. Crucially, for all experiments, animals first underwent task training before the final testing days. Training procedures are described below:
Habituation to reward in the maze:
All behavior experiments took place during the animals’ dark cycle. All implanted mice were habituated to human experimenters as well as the experimental room. At the same time, they were mildly food restricted and habituated to sugar pellet reward. The criterion for habituation to sugar pellets and the maze was running counter-clockwise around the maze and eating a sugar pellet in the reward port of the maze (described below) in 15 successive repetitions without missing a single pellet.
Reward periodicity-training:
Animals were trained for approximately 8 days. If during any training day, the mice appeared unmotivated or too satiated to complete the 15 trials, that training day was repeated the following day. Animals were pre-trained for 2 days on the maze to habituate to receiving sugar pellet rewards in the reward port: on each of these days, they did a 1-lap-per-trial task, that is, they receiving reward every run around the maze, and ran 15 such trials. For the next 3 days (days 3–5), animals were trained to receive periodic rewards. On day 3, animals ran 15 trials of a 2-lap-per-trial task, that is, they receiving reward every 2 laps around the maze. On day 4, animals ran 15 trials of a 3-lap-per-trial task. On day 5, animals ran 15 trials of a 4-lap-per-trial task. Finally, animals ran 3 more days (days 6–8), 15 trials per day of a 4-lap-per-trial task, before they were considered well trained on the basic 4-lap-per-trial task.
Un-trained versus Well-trained Experiment Protocol:
In the particular case of the un-trained versus well-trained animal experiment (Extended Data Fig. 4c–e), animals that had only been habituated to the reward (described above) were immediately tested/imaged by running 15 trials of the standard 4-lap-per-trial task. Following this initial testing, these animals then underwent the reward periodicity-training (described above). Following periodicity-training, animals were tested/imaged again on 15 trials of the standard 4-lap-per-trial task, to compare ESR cells seen after training, compared to when they were un-trained.
Reward on every lap experiment:
Animals in this experiment (Fig. 1i–k, Fig. 5a–c) were given a sugar pellet on every lap, completed a total of 60–80 laps total. This is equivalent to the total number of laps in the 15–20 trials of the 4 lap-per-trial experiment. This experiment did not require extra or task-specific training.
TASK-SPECIFIC TRAINING
Each of the main maze manipulation experiments (random maze elongation experiment, circular maze experiment, lap addition experiment, treadmill experiment, fixed maze elongation experiment, spatial alternation experiment) required its own special ‘task’ training after completing the habituation and reward periodicity-training.
Random maze elongation experiment (Fig. 3):
For the random maze elongation experiment, animals were tested/imaged on twenty eight 4-lap trials. The maze was elongated on pseudorandom laps of random trials manually using detachable walls, such that each of the 4 types of trials (SSSS, SSLL, LLSS, LLLL, where S denotes a “short” lap and L denotes a “long” lap) were presented in pseudorandom order and appeared 7 times each within the 28 trials. The entire 28 consecutive sequence of trials was: SSSS, LLSS, LLLL, SSSS, SSSS, SSLL, SSLL, LLSS, LLLL, LLSS, LLSS, SSLL, LLLL, LLLL, SSSS, LLLL, LLLL, LLSS, LLLL, LLSS, SSSS, LLSS, SSLL, SSSS, SSSS, SSLL, SSLL, SSLL in this order. Prior to test day, animals underwent 3 days (days (−3) to (−1)) of habituation training to the short and long laps, where SSSS, SSLL, LLSS, LLLL trials were presented randomly.
Circular maze experiment (Fig. 4):
For the circular maze experiment, animals were tested/imaged in a 2-day experiment. These animals underwent 3 days (days (−3) to (−1)) of habituation training before the first test day. On the first 2 training days (day-3 to −2), animals each day ran 15 trials of on the circular maze. On the 3rd day of training, (day (−1)) animals ran 15 trials on the square maze again, to get them habituated to test day. On each of the test days, 1 hour prior to experimentation, animals ran on the maze for five 4-lap per reward trials.
Five-lap-per-trial experiment (Fig. 5):
For the 5-lap-per-trial experiment, animals were tested/imaged in a 2-day experiment. These animals underwent 3 days (days (−3) to (−1)) of habituation training before the first test day. On the first 2 training days (day-3 to −2), animals each day ran 15 trials of a 5-lap-per-trial task. On the 3rd day of training, (day (−1)) animals ran 15 trials of a 4-lap-per-trial task again, to get them habituated to test day.
Optogenetics experiment (Fig. 6):
Calcium imaging used the Inscopix nVoke miniature optoscope, occurring at 20 Hz. During periods of optogenetic manipulation as defined by our protocol (Fig. 6c), the Inscopix nVoke miniature optoscope’s orange light (590–650 nm) stimulation was turned on, at 10 mW/mm2 power, at a uniform and constant level. Orange light delivery was done manually and was turned on or off at the start of the relevant trial as soon as animals entered the box.
For optogenetic manipulation experiment, animals were tested/imaged in a single day. These animals underwent 2 days of habituation training before the first test day with 2 days in between each of the training days to allow recovery from the light. On each of the training days, animals each day ran 16 trials of a 4-lap-per-trial task with the light schedule according to the alternating schedule shown in Fig. 6c.
Treadmill experiment (Fig. 7):
For the treadmill experiment, animals were tested/imaged in a single day. These animals underwent 6 days of habituation training running on the maze before the first test day. On the first day of training, animals ran 15 trials of a 1-lap-per-trial task. During each lap, the animal ran onto the first arm of the square maze, and ran for 12s (time period accurately indicated via Arduino, and initiated manually) on the treadmill at a constant 14 cm/s, before running around the rest of the square maze and entering the reward box. On the next five days of training, animals ran 15 trials of a 4-lap-per-trial task again, with 12s on the treadmill, to get them habituated to test day.
Fixed maze elongation experiment (Extended Data Fig. 8):
For the fixed maze elongation experiments, animals were tested/imaged in a 2-day experiment. On Day 2, 2 hours prior to experimentation, animals were habituated (allowed to run) for 3 minutes on the distorted maze without any rewards.
Alternation maze experiment (Extended Data Fig. 10):
For the spatial alternation experiment, animals were tested/imaged in a 2-day experiment. These animals underwent 5 days (days (−5) to (−1)) of habituation training before the first test day. On the first 4 training days (day-5 to −2), animals each day ran 15 trials of a 4-lap-per-trial task where the laps alternated in their spatial trajectories according to Extended Data Fig. 10a. Path alternation was induced in the maze manually using detachable walls. On the 5th day of training, (day (−1)) animals underwent ran 15 trials of an ordinary (non-alternating) 4-lap-per-trial task again, to get them habituated to test day.
Behavioral analysis and Ca2+ events detection
The animal’s position was captured by an infrared camera (Ordro infrared camcorder, 30 fps) via infrared light emitting diodes (LEDs) attached to the animal. Calcium events were captured at 20 Hz on an Inscopix miniature microscope. Imaging sessions were time stamped to the start of the behavioral recording by the turning on of an LED that is fixed to the animal, at the beginning of the session, and turning off of the LED at the end.
Analysis of the calcium images and extraction of independent neuronal traces were done akin to previous methods23,50. Specifically, the calcium movie was then binned 4x spatially along each dimension, and then processed by custom made code written in ImageJ (dividing each image, pixel by pixel, by a low-passed (r = 20 pixels) filtered version). It was then motion corrected in Inscopix Mosaic software 1.2.0 (correction type: translation and rotation; reference region with spatial mean (r = 20 pixels) subtracted, inverted, and spatial mean applied (r = 5 pixels)). A spatial mean filter was applied to it in Inscopix Mosaic (disk radius = 3), and a ΔF/F signal was calculated.
Four hundred (400) putative ROI locations were selected from the resulting movie by PCA-ICA (600 output PCs, 400 ICs, 0.1 weight of temporal information in spatio-temporal ICA, 750 iterations maximum, 1E-5 fractional change to end iterations) in Inscopix Mosaic software. Region of interest (ROIs), half-max thresholded, that were not circular (if its length exceeded its width by > 2.5 times) or smaller than 5 pixels in diameter (~12 μm), were discarded. For each remaining ROI (i.e. putative neuron): pixels within the ROI filter that were less than 75% of the filter’s maximum intensity were zeroed. ROIs in the same session that were closer than 3 pixels (~7μm) were considered the same cell rather than different cells.
ΔF/F calcium traces were calculated for the resulting ROI filters for each processed movie. Slow variations in the calcium traces were eliminated by subtracting the median percentile ΔF/F value at each timepoint, this value calculated from the calcium trace values ±15s within this timepoint, similar to Ziv et al, 201323. The calcium trace was smoothed by 4-temporal bin rolling average (each bin 50 ms). Significant calcium transients (Fig. 1c) were detected as traces that exceeded 3 Standard Deviations above baseline, and furthermore, remained above 1.5 Standard Deviations above baseline for at least 500 ms. The rest of the ΔF/F calcium traced, aside from its significant transients, were zeroed similar to Dombeck, 201051. The decay time of all calcium transients across n = 14 animals was calculated and the median decay time (the time required for a calcium transient to decay to 1/2 its maximum height) of these 137045 calcium events was 1.35s (Extended Data Fig. 2a). Only cells that had a total of at least 25 significant transients during the entire session and nonzero activity in at least 10 trials separately were considered for further analysis in this study. In the sole case of the treadmill experiment, a lesser total of at least 10 significant transients was used, since the cumulation of all the treadmill periods was only 12–16 min (15–20 trials).
ESR cell calculation
A). Calcium event filtering
For each CA1 cell detected, the calcium activity was filtered so that only activity occurring while the mice were in an active state (animal speed > 4 cm/s) were analyzed further. The behaviorally tracked times of interest were also filtered in this way, considering only the times with animal speed > 4 cm/s. The maze was divided into 9 spatial bins: the reward box (spatial bin of length and width 10 cm) was one spatial bin, and each of the 4 arm lengths of the maze were divided in half (8 spatial bins, each of which was 12.5 cm in length and 5 cm in width).
Next, for each identified cell, individual calcium activity epochs were analyzed by calculating the mean calcium activity in each of the 9 spatial bins during each individual lap across trials. Thus, for a session of 15–20 trials, there were 540 to 720 calcium activity epochs in total (15 to 20 × 9 ×4 = 540 to 720).
Each CA1 neuron possesses a spatially tuning, and in this model, the spatial tuning was captured by a parameter p defined as the probability of having nonzero calcium activity in each separate spatial bin. p was calculated for each neuron for each of its spatial bins. It differed for different spatial bins, reflecting the spatially-modulated activities.
Linear model fitting
For each activity epoch for each neuron, the mean ΔF/F calcium activity, the mean speed (s), and the head direction tuning (o) were calculated. The nonzero calcium activity epochs were fit by a linear regression of the mean ΔF/F calcium activity versus speed and head direction tuning. In this regression, the coefficients a, b, c were fit:
| [1] |
Where R[Ca] is the mean ΔF/F calcium activity level of this neuron during this activity epoch. s is the mean speed of the animal during this activity epoch, and o is the head orientation deviation from the preferred head orientation of this neuron during this activity epoch. In Matlab code, we used the function: fitrlinear with lambda = 0.01, to fit the equation [1] using regularized linear regression applied to the calcium activity epochs of all cells.
B). Identification of ESR cells
For each identified cell, we shuffled its calcium transients across the lap epochs, such that the probability of assigning any particular calcium transient into any particular lap epoch varied according to equation [1]. Calcium transients were only shuffled (using randperm in matlab) between different epochs taking place in the same spatial field in order to preserve p. We checked that this shuffle generation procedure gave a mean ΔF/F calcium activity level that matched the model-predicted (equation [1]) calcium activity level (Extended Data Fig. 2d). These shuffles simulated the calcium activity of the cell explained by spatial field (p), head direction (o) and animal speed (s). A total of 5000 such shuffles were computed, and a ‘model-explained mean ΔF/F calcium activity level’ was computed as
Where R[Ca, R = i, S = j] is the ‘model-explained calcium activity’ computed as the mean activity in lap i and spatial bin j across all the shuffles for this cell.
For every neuron on all four individual laps, the model-explained mean calcium activity level in each individual spatial bin was subtracted from the real mean ΔF/F calcium activity, to yield ‘model corrected’ (MC) ΔF/F calcium activity which excluded spatial, mean speed, and mean head direction tuning (Fig. 1g). Thus, this model corrected effect would mainly reflect difference in calcium activity due to lap number.
For every neuron, the model-explained mean ΔF/F calcium activity level was subtracted from the mean ΔF/F calcium activity level obtained from the 5000 shuffles, to yield a distribution of MC ΔF/F activities for chance level statistics. Cells whose peak, lap-specific MC ΔF/F was outside the 95th percent confidence of shuffled MC ΔF/F were significant ESR cells.
If the peak MC calcium activity happened to occur during the reward eating lap (lap 1) while the animal was in the reward box spatial bin, then the peak MC calcium activity from the next highest spatial bin was selected, because we excluded cell activity that was directly driven by reward eating.
Robustness of ESR phenomenon to different parameter choices
To show our experimental results were not simply due to our model correction, we reexamined the maze variation experiments using the raw ΔF/F activity of these ESR cells rather than the model corrected ΔF/F activity. These experiments showed similar results as those obtained when model correction was done (Extended Data Fig. 6).
To further characterize the robustness of lap specific activity across trials, an analysis of statistical power was conducted by removing a random quarter of all trials (i.e. 4 to 5 trials) during the standard 4-lap experiment, for each mouse. We note that 69% (= 726/1055) of previously statistically significant ESR cells retained their statistical significance (Extended Data Fig. 3a left). By comparison, within the previous subpopulation of non-ESR cells, 5% (= 131/2451) now showed significance, within the error rate. Even with this quarter of trials removed, ESR activity was still well correlated across days (Extended Data Fig. 3a center and right).
To examine whether results were affected by the spatial bin size that we used, we re-analyzed the standard 4-lap experiment with a smaller spatial bin size, while keeping the rest of the procedures described above. We divided each of the 4 arm lengths into 4 equal bins (each 6.25 cm in length), and the box into 4 equal bins for a total of 20 spatial bins, and obtained nearly identical experimental results as having 9 spatial bins (Extended Data Fig. 3c), so we proceeded with utilizing 9 spatial bins for the rest of the experiments.
To examine whether cells that showed lap-dependent activity were more generally stochastic, we looked at the subpopulation of ESR cells that had higher consistency of activity which we defined as cells that were active in the main spatial bin during at least 1/2 of all the trials. Again, this subpopulation of neurons had robustly preserved ESR activity across days during the standard 4-lap experiment (Extended Data Fig. 3f).
Spatial information
The tracked positions were sorted into 16 spatial bins of size 6.25cm × 5cm around the track and 4 spatial bins of size 5cm × 5cm in the reward box and the mean ΔF/F calcium activity of each CA1 cell was determined for each bin. The bins which had animal occupancy < 100 ms were considered unreliable and discarded from further analysis. Without smoothing, the spatial tuning was calculated for each cell according to:
Where λi is the mean ΔF/F calcium activity of a unit in the i-th bin, λ is the overall ΔF/F calcium activity, and pi is the probability of the animal occupying the i-th bin for all i. This formulation, derived in Skaggs et al, 199352, was applied to calcium activity levels, which have a known monotonic relationship to spike rates20. All cells’ event times were shuffled 2000 times in an analogous manner to Wills et al, 201053 by shifting the calcium activity time series around the position data by a random translation of > 20 s and less than the session duration minus 20s. Cells with significant spatial information were determined above the 95th percentile of all shuffles.
Registering cells across days
Our approach to register cells across days was to do so on the basis of the anatomy of the field of view seen on both days (i.e. the pattern of blood vessels, etc.), rather than on the spatial locations of cells directly (Extended Data Fig. 5a). To register two movies across days, a mean projection of the ImageJ filtered and motion corrected movie (see above methods) on each day was computed, and these two movies were registered with respect to one another by the Inscopix Mosaic motion correction software. The distances between active cells from Day 1 and their putatively matched cells on Day 2 (650 cells, n = 4 animals) were calculated. The distribution of distances had a mode of 1.2μm (Extended Data Fig. 5c, purple bars). By contrast, the distribution of distances between these same cells on Day 1 and their nearest neighboring cells on the same day had a mode of 17.6μm (Extended Data Fig. 5c, yellow bars).
After an appropriate image registration was found for the fields of view based on anatomy, the ROIs on day 1 were identified, and calcium traces were calculated based on the resulting ROI filters for day 1 applied directly to the processed movie on day 2 at the matching anatomical location. This is exactly what would have been done if the day 2 movie had been a part of day 1. We note that the resulting spatial fields of registered cells were preserved across days (Fig. 2f), which is an independent validation of our cell registration protocol.
ESR activity and spatial activity correlations across days
For ESR correlations across days: for a given significant ESR cell on day 1, its ESR activity pattern (defined in the main text) was concatenated into a vector. A similar vector was produced for this same cell on day 2. This was done for each significant ESR cell defined on day 1. The ESR correlation acted as an index for ESR preservation across days and was defined as the Pearson correlation between the day 1 ESR activity vector and the corresponding day 2 ESR activity vector for the same cell. The day 2 ESR activity vector was produced from the same spatial bin as day 1 to allow for direct ESR activity comparison, except for the circular maze, and spatial trajectory alternation experiments. In these cases the spatial bin in which peak activity occurred were calculated anew, since the space was substantially changed in these experiments relative to room cues.
ESR cells with Pearson’s r > 0.6 threshold were considered to have highly preserved (i.e. highly correlated) ESR activity patterns across days. The distribution of ESR correlations when cell identities were shuffled across day is bimodal (Extended Data Fig. 3d). Since we required a measure for shuffled cell pairs that were highly correlated by chance, we chose the threshold r > 0.6, which marks the boundary to the mode at r = 1. With other choices of threshold: r > 0.4, or r > 0.8, all the subpopulations of lap 1–4 cells separately were still highly preserved during the two-day standard 4-lap task (Extended Data Fig. 3e).
For spatial correlations across days: The raw calcium events, speed filtered (> 4 cm/s) were sorted into the 9 spatial bins defined above and the calcium activity level of each neuron was determined for each bin, and an activity map composed of all the spatial bins was produced. The activity maps for each individual ESR cell was treated as a vector (list of numbers) and Pearson correlation between the spatial activity maps of the two days was calculated. For the single day optogenetic inhibition experiment (Fig. 6), the Pearson correlation was calculated between the spatial activity maps during the light-On trials vs the light-Off trials.
Alternative analyses to characterize ESR preservation across sessions
Our ESR correlation analysis showed that ESR activity patterns were highly preserved across session, so several analyses were conducted to provide more information about the nature of this ESR preservation. While ESR correlation was treated as a metric for quantifying preservation, we next quantified the percentage of ESR cells with “significant” ESR correlation according to a statistically defined criterion. We shuffled calcium transients of individual cells during the 2nd session, 1000 times according Equation [1] and Methods line 1234–1241. We then calculated the ESR correlation between each cell’s session 1 ESR activity pattern and each of the session 2 shuffled ESR activity patterns. Finally, the percentage of cells whose ESR correlation was above the 95th statistical significance level of the shuffled ESR correlations were reported in Supplementary Fig. 4 for all major experiments. All major experiments showed similar results (Supplementary Fig. 4) as those obtained when we used the r > 0.6 criterion and compared ESR correlations vs shuffles (Supplementary Fig. 5).
Besides quantifying the preservation of the overall ESR activity patterns by conducting ESR correlation analysis, we also quantified the percentage of cells that preserved their lap preference (i.e. cells that have maximal activity on lap i and remained maximal on the same lap i during the 2nd session). All major experiments showed similar results (Supplementary Fig. 6) as those obtained using ESR correlation (Supplementary Fig. 5).
Venn diagram display
The Venn diagram display in Supplementary Fig. 2 was constructed using MathWorks software retrieved from54.
Statistics
A). Statistical analysis
Statistical analyses were performed in MATLAB (Mathworks). All statistical tests in this study were two tailed. Single-variable comparisons were made with two-tailed T-tests. Group comparisons were made by ANOVA followed by Tukey-Kramer post-hoc analysis. The statistical analyses of calcium events was discussed in great detail in the Methods above. The numbers of mice for all experiments are reported in the Figure legends.
B). Sample sizes
No statistical methods were used to predetermine sample size for single experiments, but the sample sizes were similar to or greater than other studies in the field (n = 3–4 animals per experiment, e.g. in4,16,32). Most of our experiments included n ≥ 4 animals unless otherwise indicated in the main text and figures.
C). Replication and blinding
All experiments reported here were reliably reproduced in individual mice for all calcium imaging and behavioral experiments (Extended Data Fig. 4, Supplementary Fig. 4–6). Data collection and analysis were not performed blind. In all experiments, animals simply ran on the maze while receiving reward. Computer-based analyses ensured unbiased data collection and analysis.
Figure displays:
For display purposes, Heat map figures used spatial and temporal smoothing:
Fig. 1e, and Extended Data Fig. 1b show raw calcium activity organized by spatial location and lap number and used 6.25cm spatial bins along the 100 cm linear track that were normalized and Gaussian smoothed (σ = 25cm). Fig. 2d, 4e, 6g show raw calcium activity organized by spatial location and used 6.25cm spatial bins along the 100 cm linear track that were normalized and Gaussian smoothed (σ = 25cm). Fig. 1f, 2a, 4b, 6d, and Extended Data Fig. 1d–f show raw trial-by-trail calcium activity organized by spatial location and lap number used 6.25cm spatial bins without smoothing. Fig. 2b, 3a, 4c, 6e, Extended Data Fig. 6a, Extended Data Fig. 8d, Extended Data Fig. 10b display two dimensional spatial plots with 1×1cm2 spatial bins and Gaussian filter σ= 4cm.
Fig. 7b, Extended Data Fig. 9c show raw calcium activity organized by time of the calcium activity on the treadmill and the lap number and used 0.5s time bins along the 12s treadmill period that were normalized and Gaussian smoothed (σ = 2s). Fig. 7d–e show raw trial-by-trail calcium activity organized by time of the calcium activity on the treadmill and the lap number, used 0.5s time bins without smoothing.
Extended Data
Extended Data Fig. 1: Spatial and Reward properties of CA1 cells on the maze.
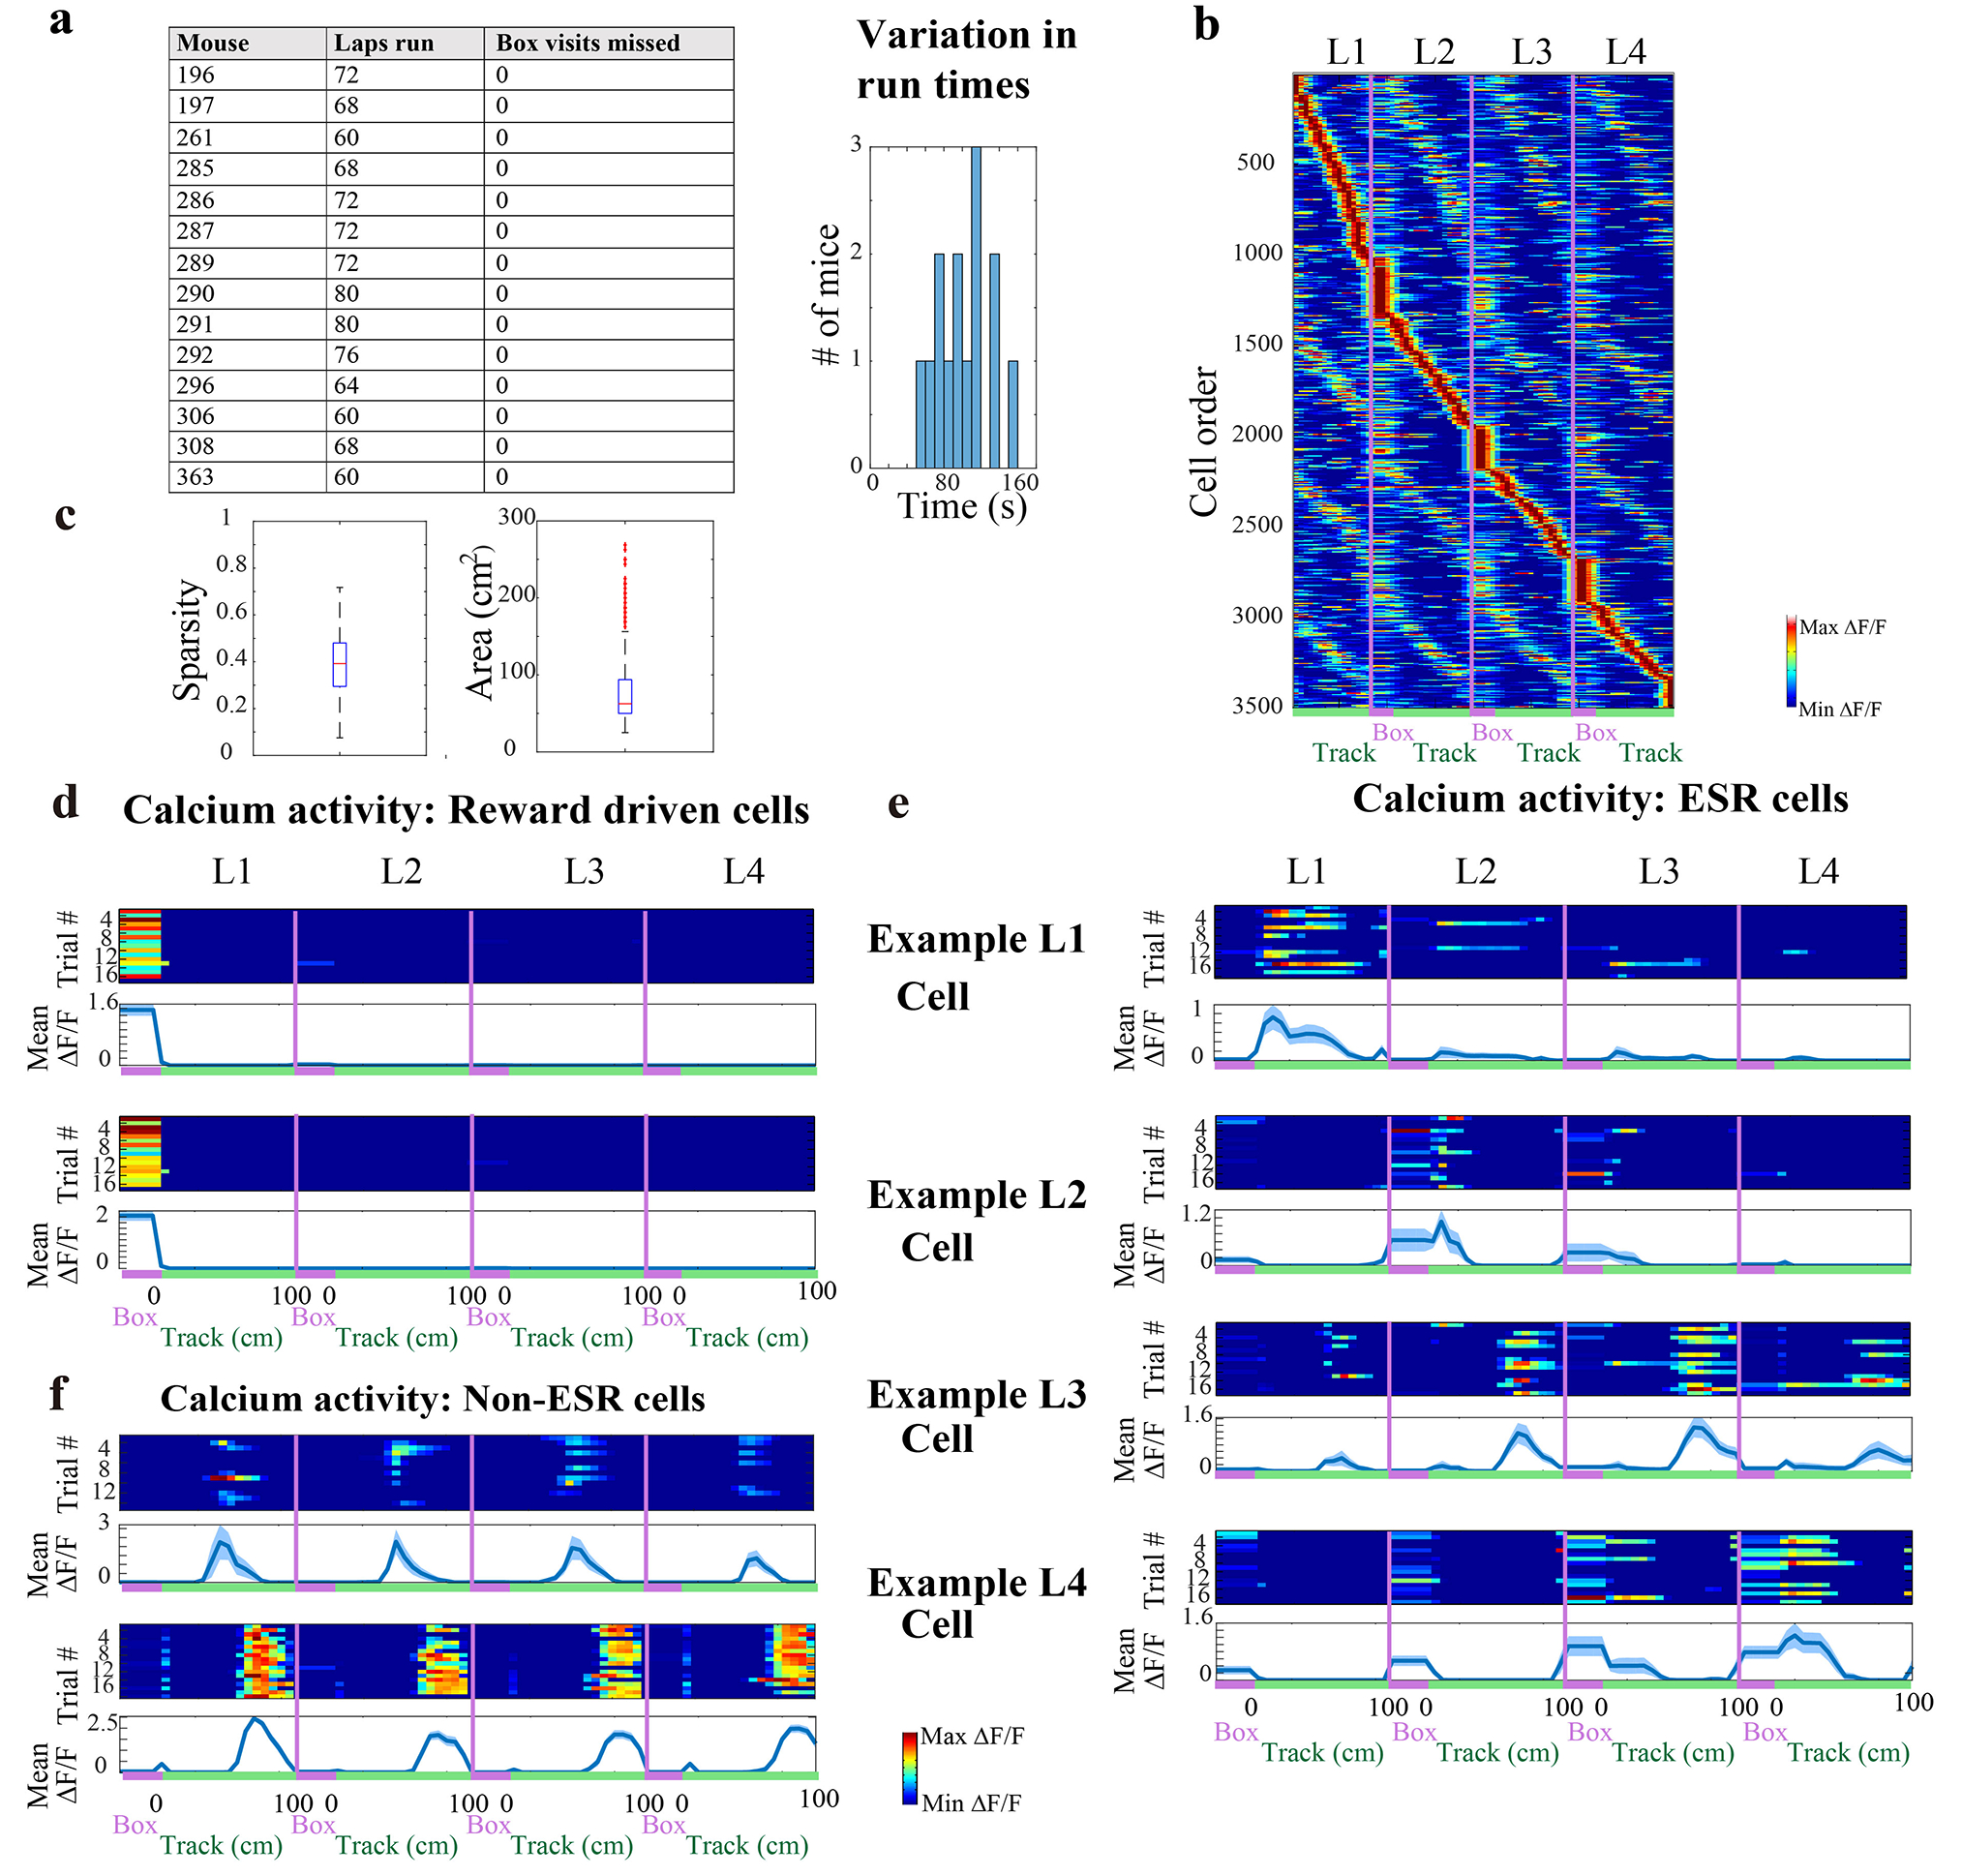
a) Left: Summary of mice running in a single session of the standard 4-lap-per-trial task. Mice did not miss a visit into the reward box on any run. Right: Mean run time among trials (n = 14 animals)
b) CA1 calcium activity sorted by spatial position and lap number (3506 cells, n = 14 animals). Red label indicates reward box spatial bin, and green label indicates the 100 cm long maze track. Reward box activity during lap 1 (reward eating period) was excluded.
c) Characterization of mean spatial properties of CA1 cells active in the lap maze: Left: sparsity, and Right: spatial field size; n = 14 mice. In total, 72% (2509/3506) of CA1 cells from 14 animals were significant place cells. Box and whisker plots display median, 25th and 75th percentiles (box), and maximum and minimum values (whiskers).
d—f) Spatially binned calcium activity along the track (d) 2 example cells that responded to the reward, and (e) One example lap 1, 2, 3, and 4 cell each, and (f) 2 example place cells that did not have lap modulated activity. Top panel: trial-by-trial activity Bottom panel: trial-averaged activity with mean ± SEM. The number of trials for each cell is indicated in each figure panel (d—f). Standard error was cut off at 0 because negative activity does not exist.
Extended Data Fig. 2: Model correction for Speed and Head direction modulations of CA1 cell activity.
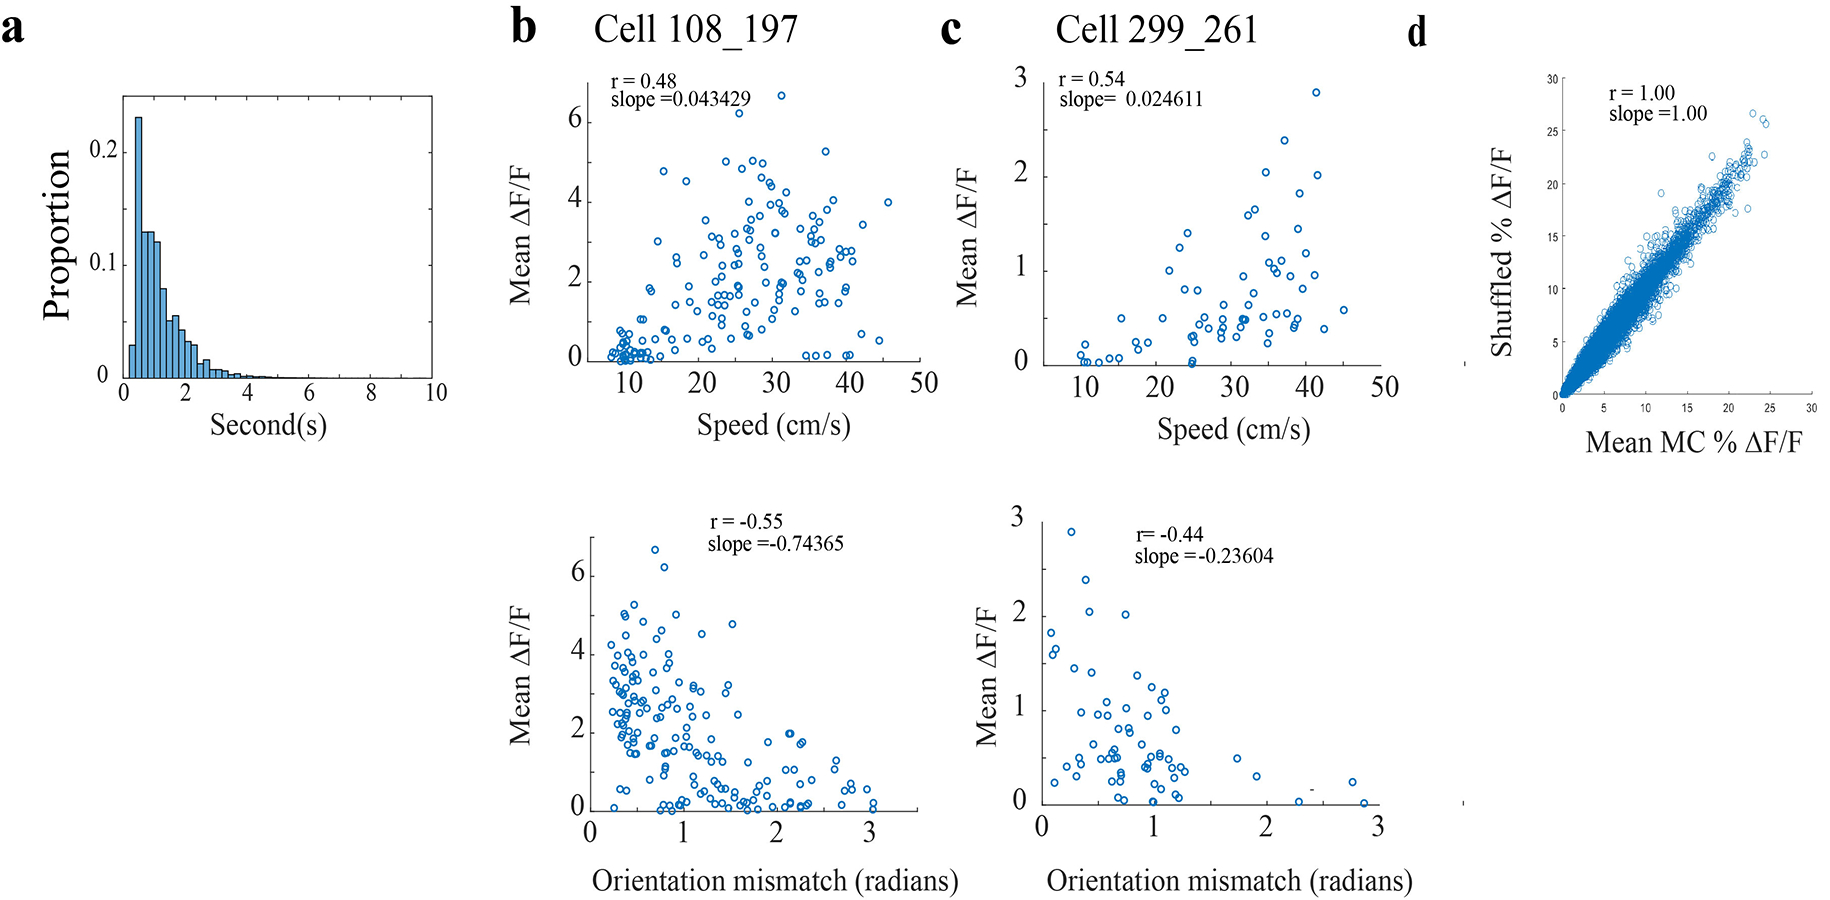
a) The half decay time (the time required for a calcium transient to decay to 1/2 its maximum height) of 137045 calcium transients across n = 14 animals as they underwent the standard 4-lap task.
b) – c) Two example cells with calcium activity level plotted against mean animal running speed (top subpanels), and head direction tuning (bottom subpanels). r denotes Pearson’s correlation. (b) contains 161 nonzero measurements, and (c) contains 54 nonzero measurements of mean calcium activity during the epochs of the experimental session defined in the Methods (subsection “Calcium event filtering”).
d) Shuffling procedure preserved the mean calcium activity level as prescribed by the linear model (See Methods) (r denotes Pearson’s correlation. Mean calcium activity measurements taken from 1716479 epochs from all cells recorded during experimental sessions of 14 animals). Epochs are defined in Methods, subsection “Calcium event filtering”.
Extended Data Fig. 3: Robustness of ESR phenomenon to different parameter choices.
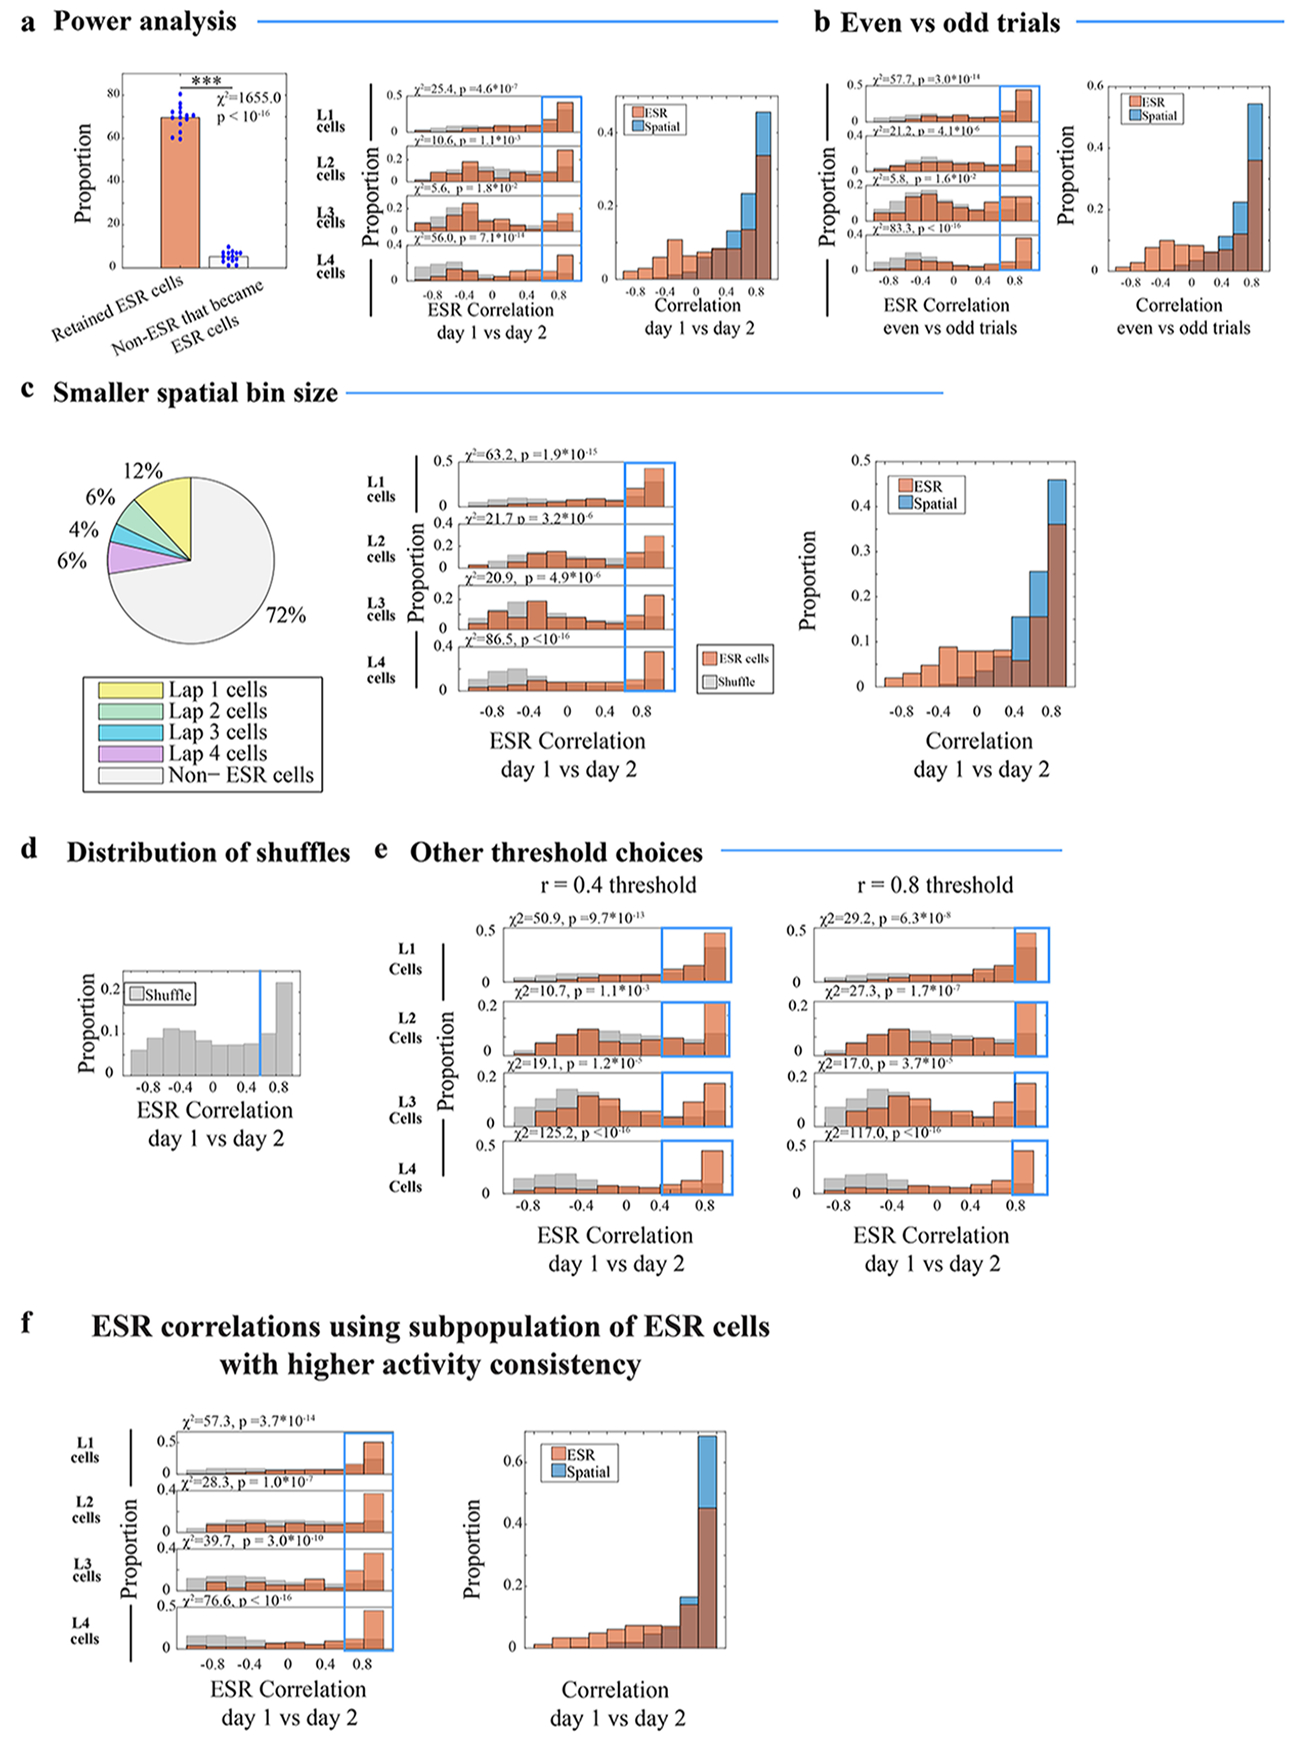
a) Analysis procedure with a random quarter of all trials (i.e. 4 to 5 trials) during the standard 4-lap experiment removed, for each mouse. Left: Percentage of previously statistically significant ESR cells that retained their statistical significance (70% = 726/1055 ESR cells, n = 14 mice) compared to previously non-ESR cells that became significant (5% = 131/2451 cells, same animals). Middle and Right: Pearson correlation of ESR activity and spatial activity across days in the standard 4-lap experiment. See Fig. 2(e) for description and methods. (500 cells total).
b) ESR correlations between even numbered trials vs odd numbered trials of individual cells, as an indicator for the robustness of ESR patterns between trials. See Fig. 2(e) for description and methods. (611 cells total).
c) Standard analysis procedure conducted on the standard 4-lap experiment (see Methods)—albeit with a smaller spatial bin size (6.25 cm × 5 cm). Left: Summary statistics: Percentage of ESR cells in the whole CA1 pyramidal population that were tuned to lap 1, 2, 3, or 4, on a single day in the standard 4-lap experiment (n = 14 animals, 3506 cells). Center and Right: Pearson correlation of ESR activity and spatial activity across days in the standard 4-lap experiment (n = 8 animals, 566 cells).
d) The distribution of ESR correlations when cell identities were shuffled across day 1 vs 2 on the standard 4-lap task (n = 8 mice).
e) Lap 1, 2, 3, and 4 ESR cells were significantly preserved over days during the standard 4-lap task, even with different thresholds for highly preserved ESR cells. χ2 and p values are shown in the Figure (622 cells total).
f) Pearson correlation of ESR activity across days during the standard 4-lap task, calculated using the subpopulation of ESR cells that were active in the main spatial bin during at least 1/2 of all the trials (327 cells total).
Extended Data Fig. 4: ESR is learning dependent and indicates recognition of lap number.
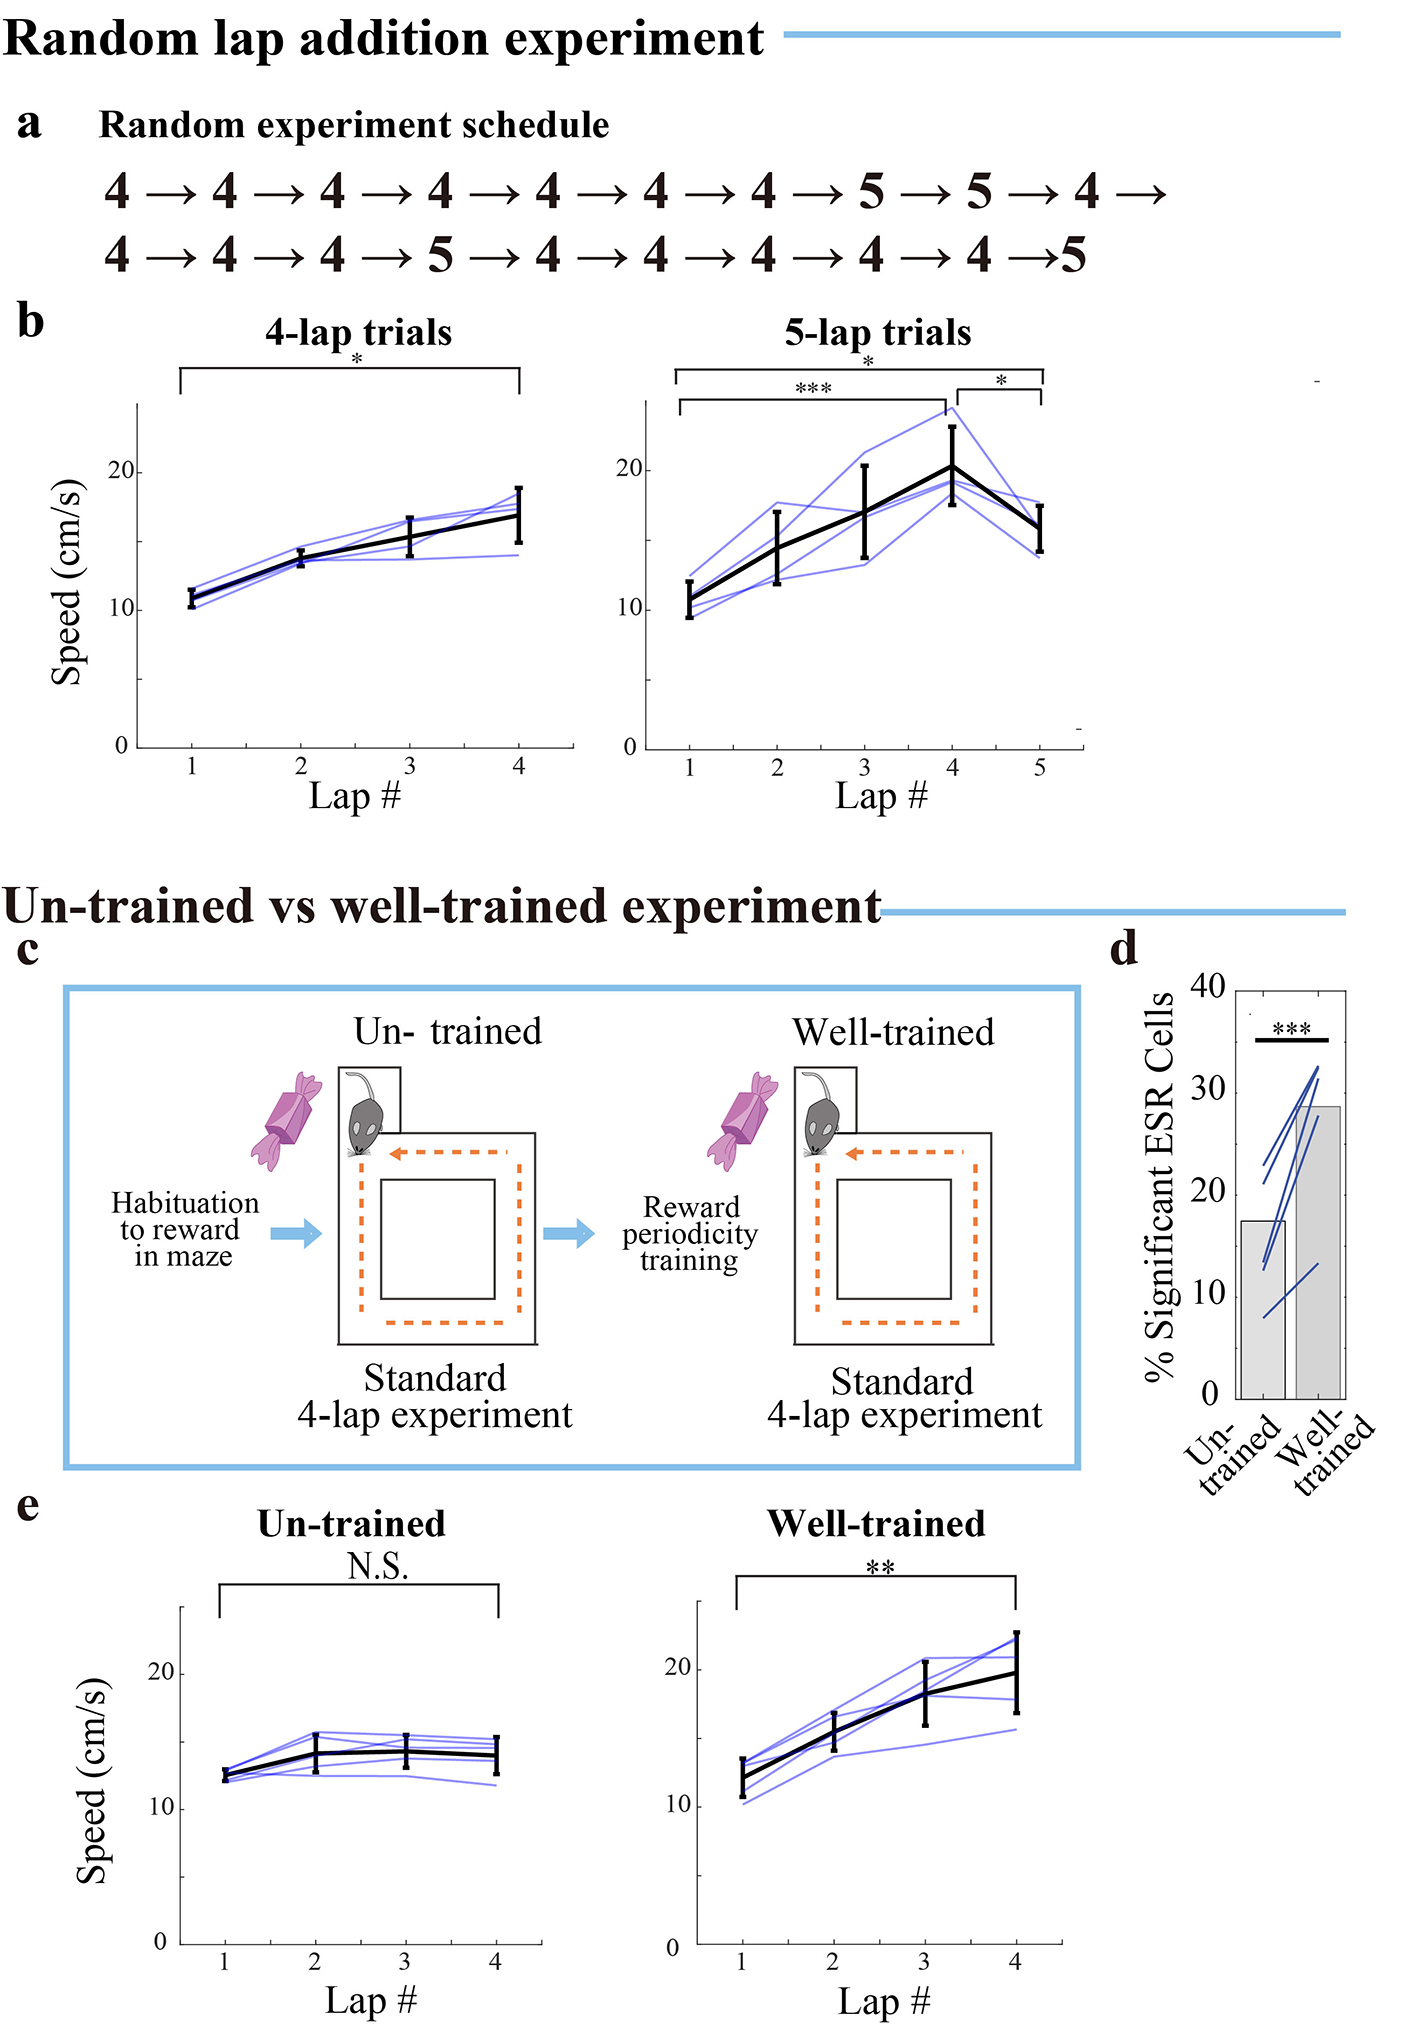
a) Pseudorandom experiment schedule: 20 trials in total where 4 pseudorandomly chosen trials had an extra (5th) lap before reward delivery.
b) Mean speed during active periods (defined > 4 cm/s) plotted separately for different lap numbers (left) during standard 4-lap trials (lap 4 vs lap 1: Paired T-test: tstat = 5.48, df = 3, p = 1.2*10−2), and (right) during the unexpected 5-lap trials for the same n = 4 mice (mean ± SD). (One-way ANOVA: F(2,9) = 22.48, p = 0.0003. Tukey-Kramer post-hoc analysis for lap 4 vs lap 1: p = 2.3*10−4, lap 4 vs lap 5: p = 2.9*10−2, lap 1 vs lap 5: p = 1.5*10−2). Blue lines indicate speed of individual mice.
c) Experimental schedule for un-trained vs well-trained animals on the standard 4-lap-per-trial task.
d) The percentage of significant ESR cells was significantly less during un-trained session (176/1008 cells) comparing with well-trained session in the same mice (335/1168) (χ2 =37.9, p = 7.4*10−10; Blue lines: 5 mice).
e) Mean active speed (active periods defined > 4 cm/s) plotted separately for different lap numbers (left) in un-trained animals (lap 4 vs lap 1: Paired T-test: tstat = 2.29, df = 4, p = 0.084), vs (right) the same well-trained animals (n = 5 mice, mean ± SD) (lap 4 vs lap 1: Paired T-test: tstat = 6.42, df = 4, p = 3.0*10−3). Blue lines indicate speed of individual mice.
* denotes p < 0.05, ** denotes p < 0.01, *** denotes p < 0.001, N.S. not significant.
Extended Data Fig. 5: Method for image registration across days.
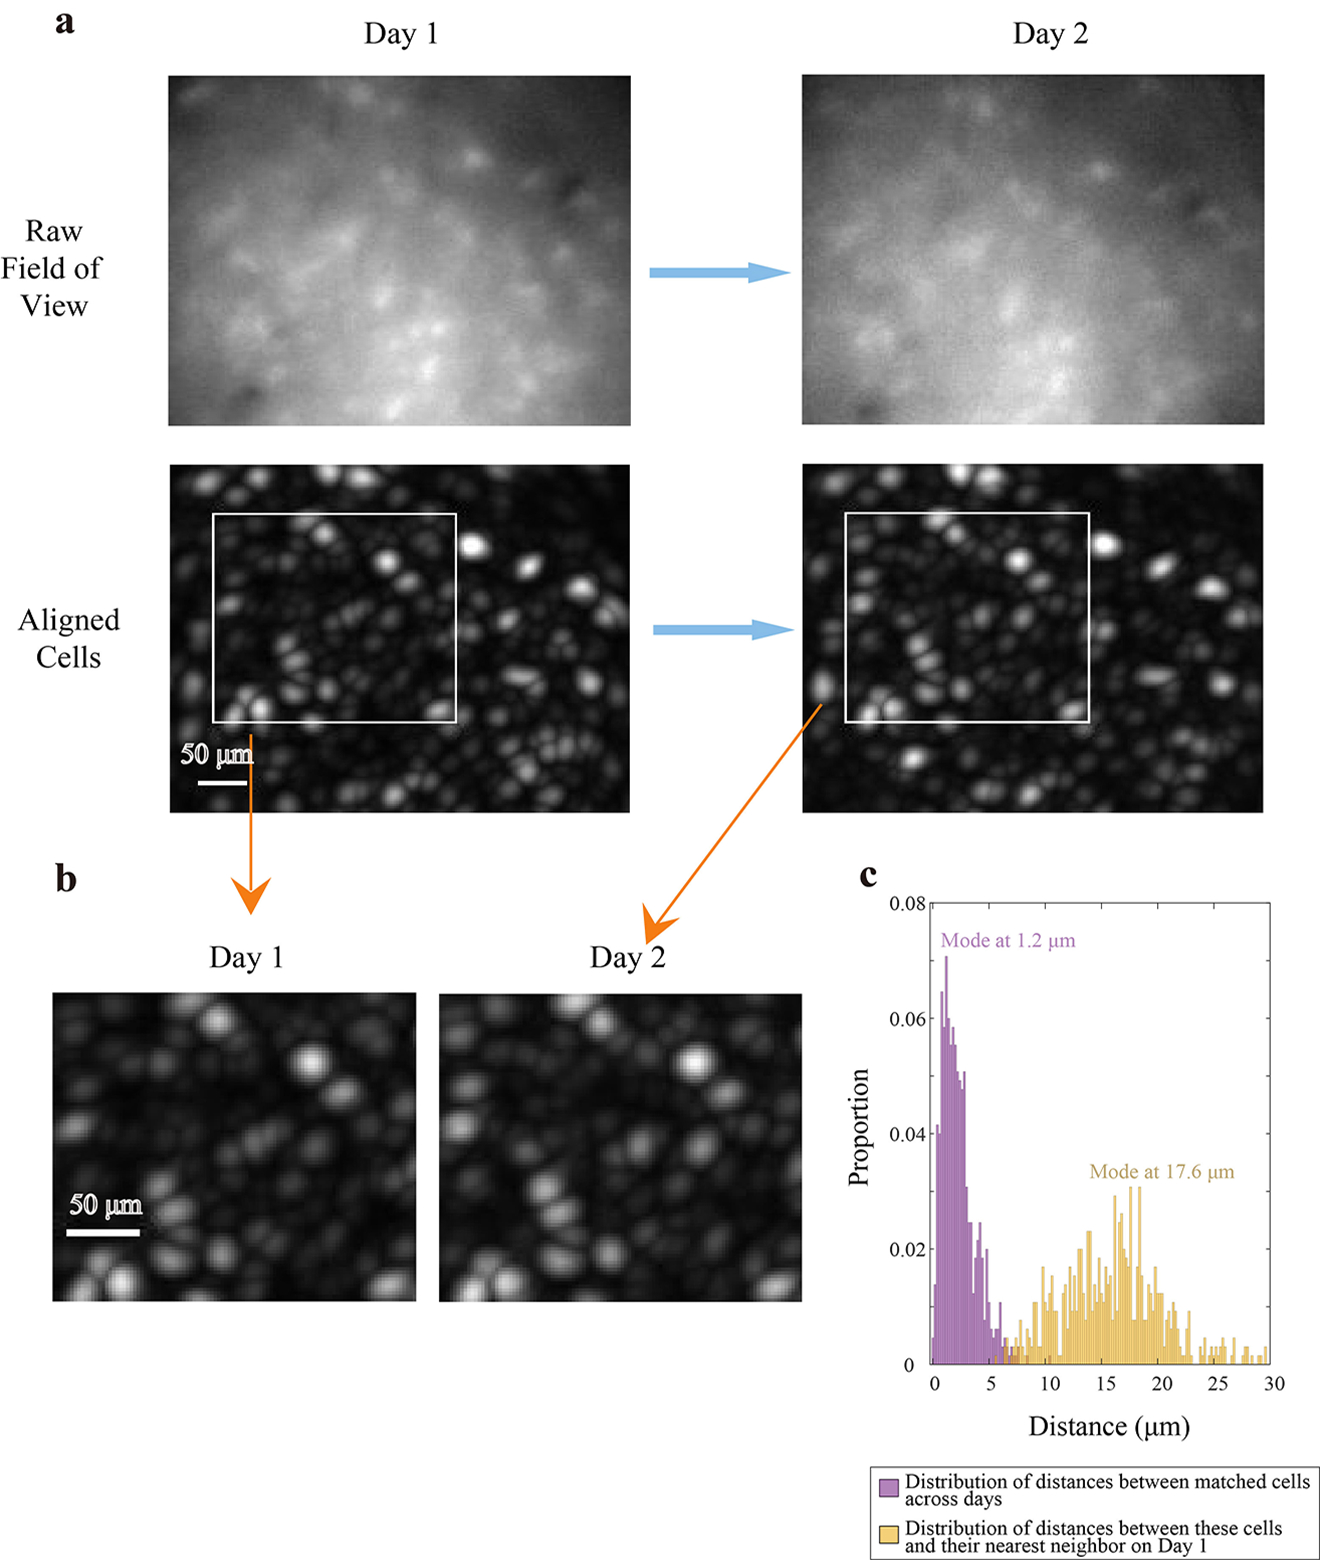
a) Field of view of raw endoscopic image (Top) during day 1 (Left) and day 2 (right) in one example animal. Corresponding locations of cells (Bottom) during the same two sessions, as seen in max projection images after motion correction. Representative of images from n = 4 mice.
b) Expanded view of aligned cell locations on day 1 and day 2 from (a).
c) Purple: Distances between active cells on Day 1 and their putatively matched cells on Day 2 (650 cells, n = 4 animals). Yellow: Distances between the same cells and their nearest neighbor within Day 1. Plot is cut off at 30μm.
Extended Data Fig. 6: ESR correlation across sessions as calculated using raw ΔF/F activity without model correction.
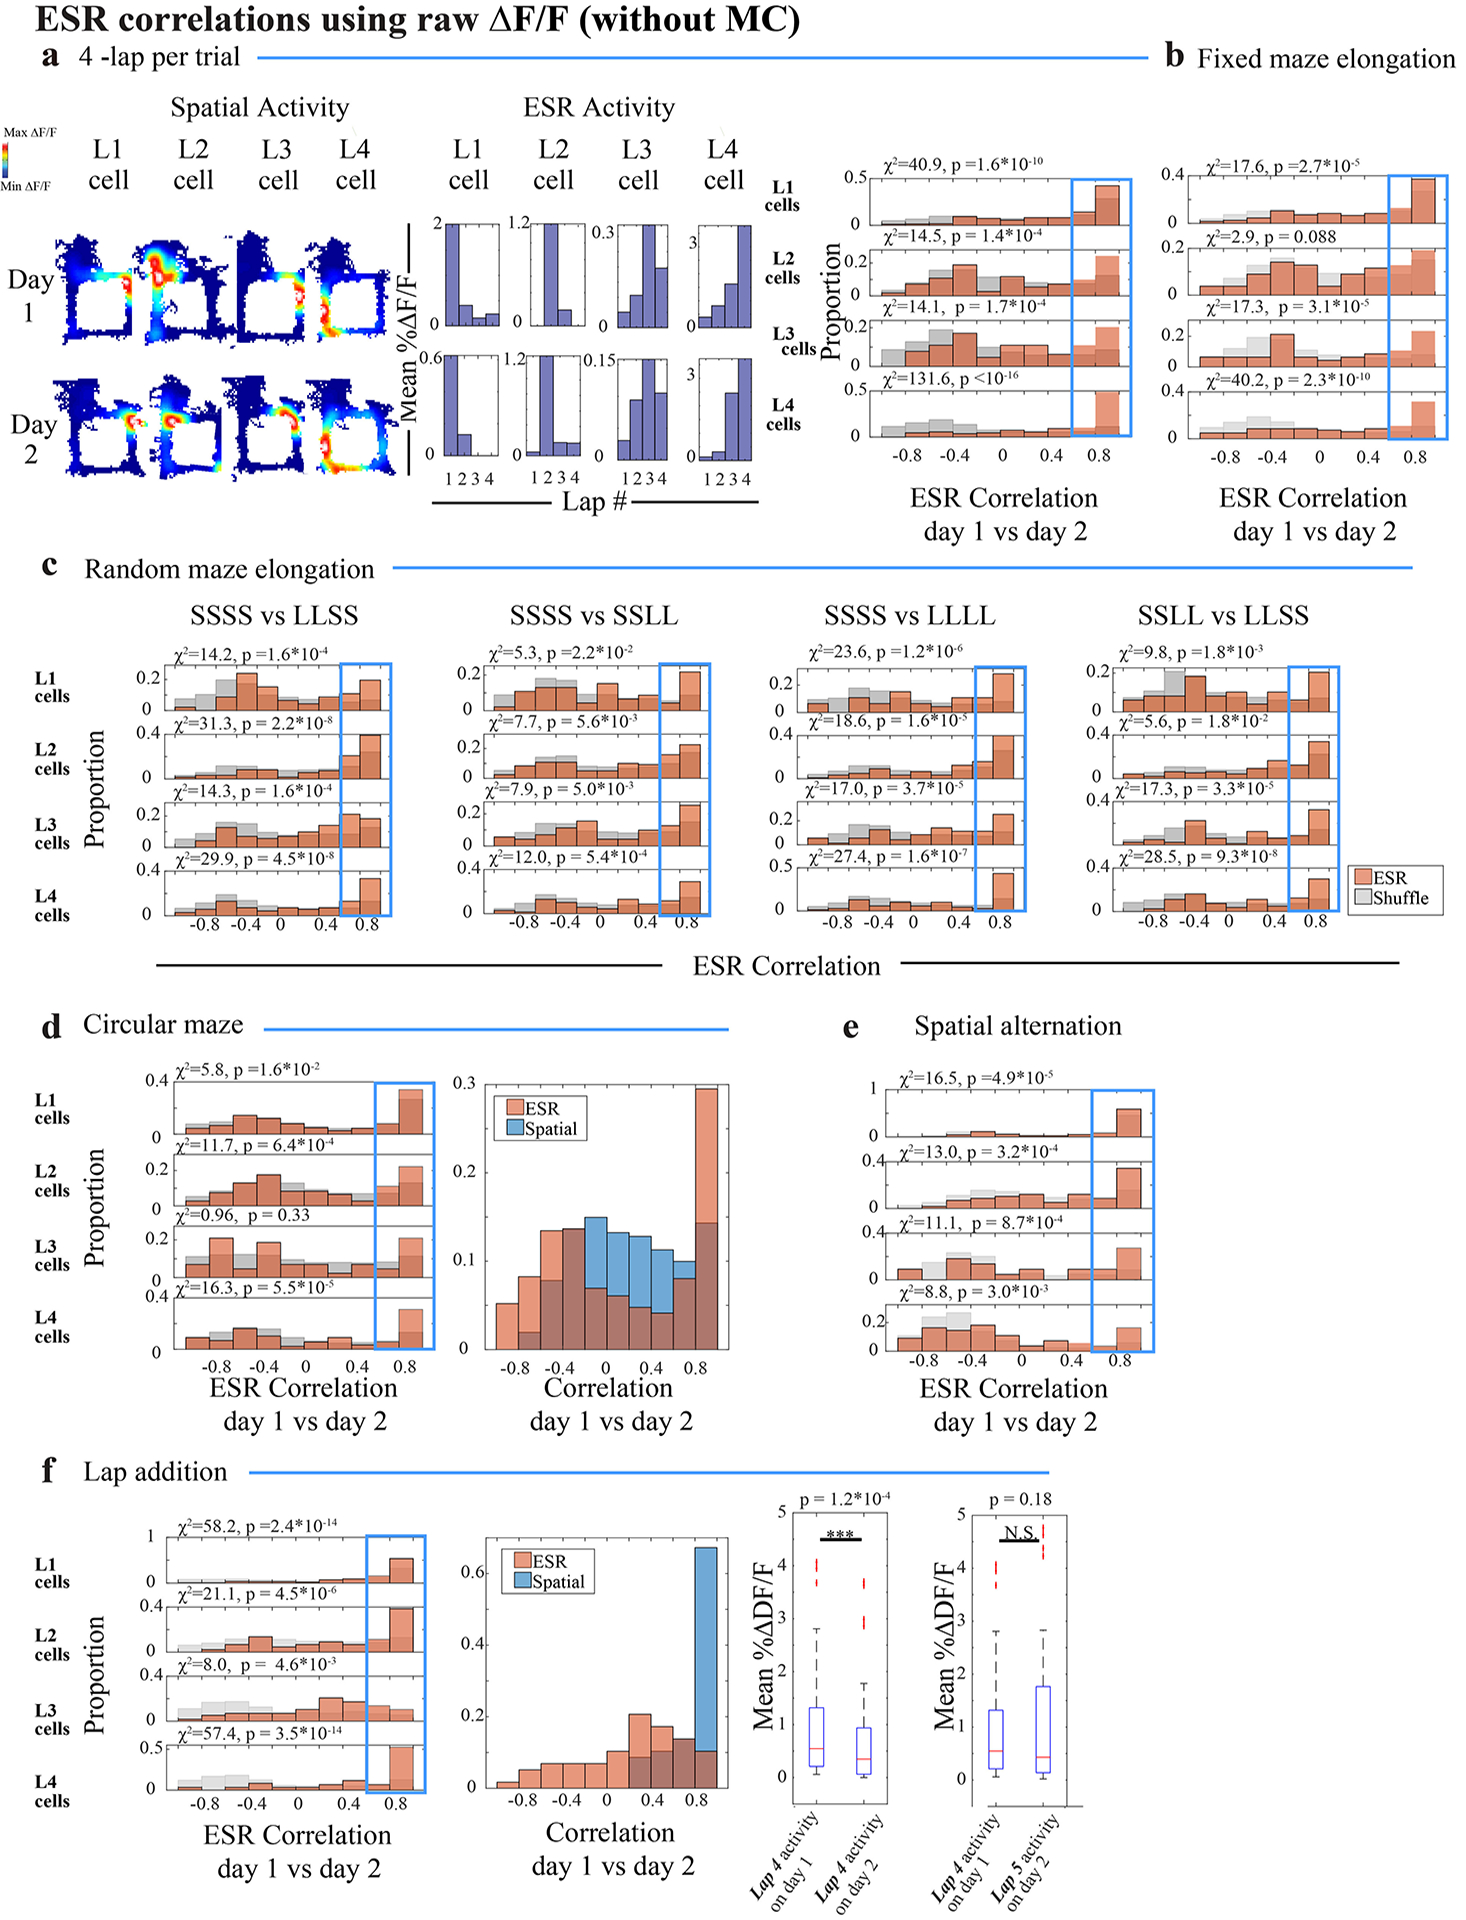
a) Left: The same single example lap 1, 2, 3, and 4 neurons matched across 2 consecutive test days as Fig 2a–c, measured by raw ΔF/F calcium activity (i.e. without model correction)
Right: ESR correlation across days, calculated using raw ΔF/F activity. The cells here were the same animals and experimental sessions as Fig. 2 above, plotted separately for lap 1, 2, 3 and 4 cell populations (621 cells total).
b) – f) ESR correlation of individual cells across sessions, calculated using raw ΔF/F activity, for the (b) fixed maze elongation experiment from Extended Data Fig. 8 (446 cells), (c) random maze elongation experiment from Fig. 3a–f (306 cells), (d) circular maze experiment from Fig. 4 (461 cells), (e) spatial alternation experiment from Extended Data Fig. 10 (371 cells), (f) lap addition experiment from Fig. 5 (378 cells in the first left panel, 58 cells in the second left panel, 41 cells in the two right panels). The cells here were from the same animals and experimental sessions as the corresponding plots in the main Figures, plotted separately for lap 1, 2, 3 and 4 cell populations. (f) right two panels: Box and whisker plots display median, 25th and 75th percentiles (box), and maximum and minimum values (whiskers).
Extended Data Fig. 7: Robustness of ESR preservation across days.

a) ESR correlation analysis of the standard 2-day experiment from Fig. 2(a) above, in which trials during day 2 were separated into even numbered trials, and odd numbered trials.
b) ESR correlations between (left) all trials from day 1 and even numbered trials from day 2, and (right) all trials from day 1 and odd numbered trials from day 2, of the standard 2-day 4-lap experiment. See Fig. 2(e) for description and methods.
c) Proportion of ESR cells that were highly preserved across sessions (Orange) (ESR correlation > 0.6) in each experiment, compared to shuffles (Grey). ESR correlations were calculated between all trials from session 1 and even numbered trials from session 2 (left), and all trials from session 1 and odd numbered trials from session 2 (right). Note that in the optogenetic inhibition experiment, session 1 refers to light-Off trials, while session 2 refers to light-On trials. Blue dots: shows the proportion of cells for each individual animal, in each experiment. χ2 and p values are shown in the Figure. (c) (left): from left to right: 579, 422, 457, 367, 366, 168, 121 total cells respectively. (c) (right): from left to right: 588, 413, 459, 367, 363, 172, 122 total cells respectively.
Extended Data Fig. 8: ESR is unaffected by temporal and spatial variations within events.
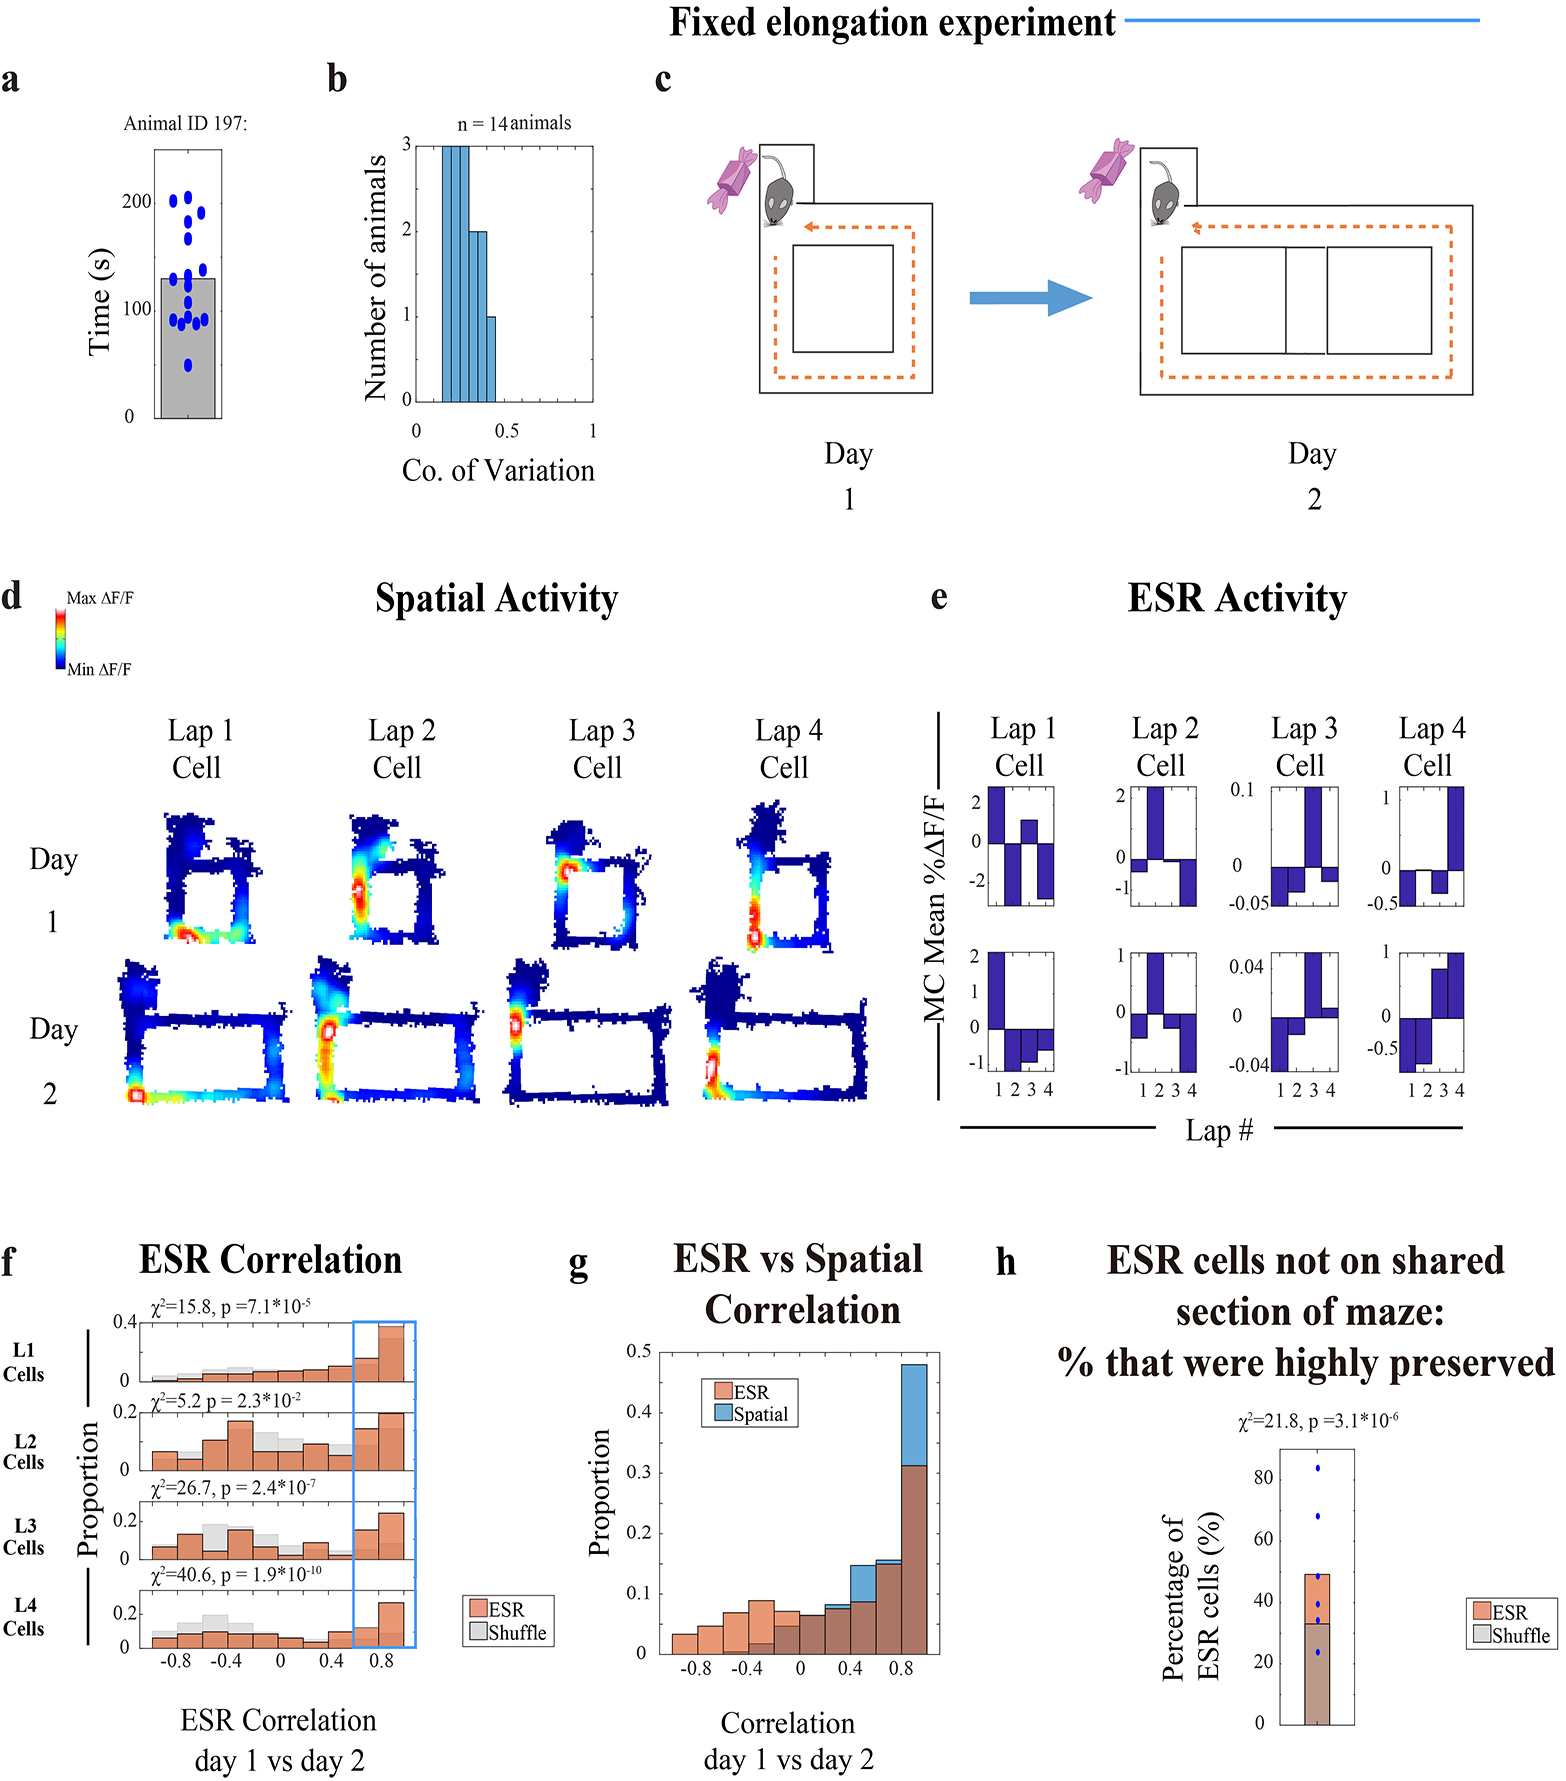
a) Distribution of running time across trials for animal 197 during 18 trials;
b) Coefficient of variation for running time among trials in n = 14 animals.
c) Fixed maze elongation experiment: 4-lap-per-trial task on: Day 1: the standard maze and Day 2: the elongated maze.
d—e) Example lap 1, 2, 3, and 4 preferring neurons matched across standard and elongated maze sessions.
f) ESR correlations across standard and elongated maze sessions (448 cells, n = 6 mice). The proportion of cells with highly preserved ESR patterns across days (Pearson’s r > 0.6, shown in the Blue box) was significantly greater compared to shuffles.
g) Spatial correlations and ESR correlations across days, during the fixed maze elongation experiment (448 cells).
h) 185 out of 448 ESR cells had main spatial field not on the shared unstretched half of the maze. Within these 185 cells, 91 cells had highly preserved (Pearson’s r > 0.6) ESR patterns across days (Orange bar) significantly greater compared to shuffles (Grey bar). Blue dots: shows the proportion of cells for each individual animal. χ2 and p values are shown in the Figure.
Extended Data Fig. 9: ESR during the treadmill period.
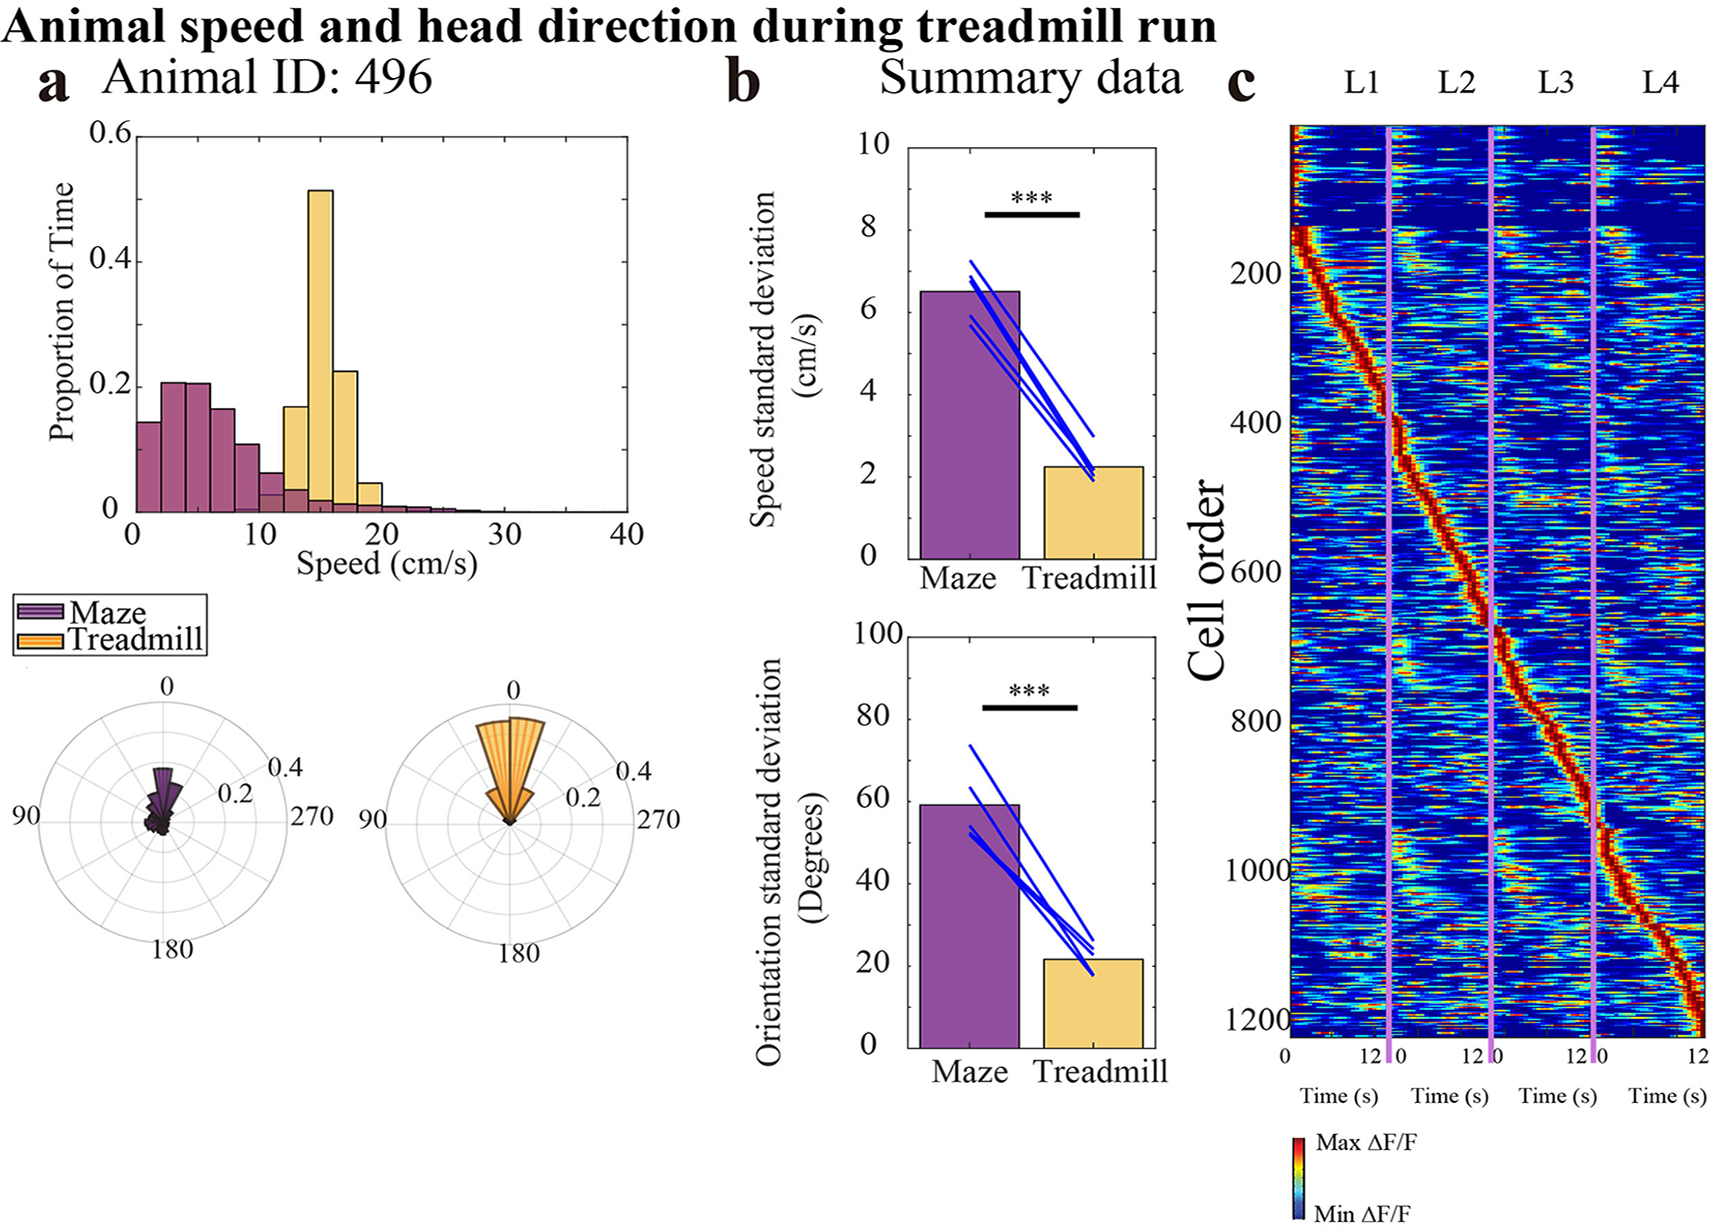
a) Distribution of top: animal running speed, and bottom: animal head direction during the maze running portion (purple) versus the treadmill running portion (yellow) of the task, for animal 496 in 20 trials.
b) Summary data: comparison of standard deviation of top: animal running speed (Paired T-test: tstat = 19.65, df = 4, p = 4.0 * 10−5), and bottom: animal head direction (Paired T-test: tstat = 9.32, df = 4, p = 7.4 * 10−4) during the maze running portion (purple) versus the treadmill running portion (yellow) of the task, for 5 animals.
c) CA1 calcium activity sorted by spatial position and lap number (1222 cells, n = 5 animals).
Extended Data Fig. 10: ESR tracks lap events despite spatial trajectory alternation.
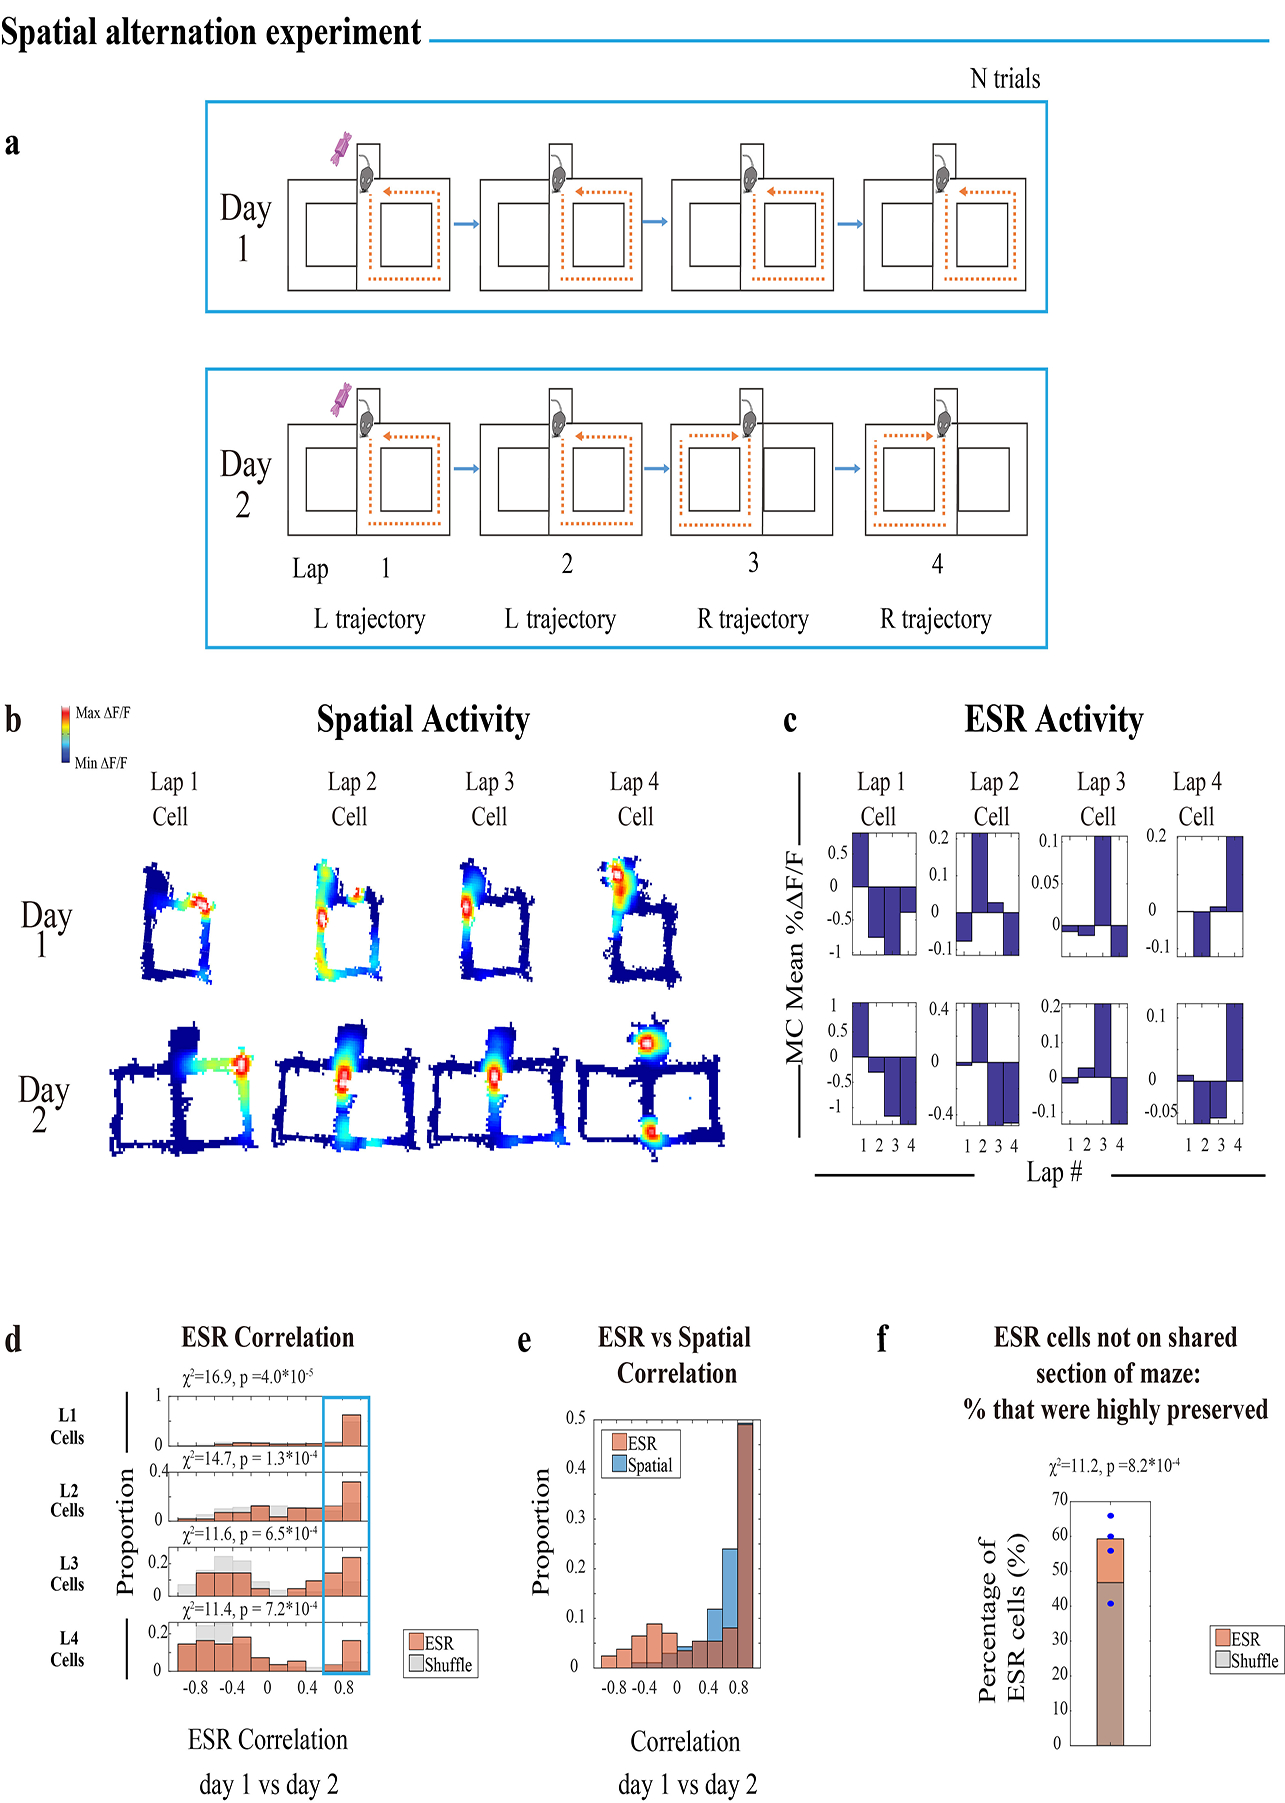
a) Alternation experiment: Day 1: standard 4-lap experiment and Day 2: alternating trajectory experiment.
b—c) Example lap 1, 2, 3, and 4 preferring neurons, matched across standard and alternating maze sessions.
d) ESR correlations across the standard and alternating maze sessions (371 cells, n = 4 mice). The proportion of cells with highly preserved ESR patterns across days (Pearson’s r > 0.6, shown in the Blue box) was significantly greater compared to shuffles.
e) Spatial correlations and ESR correlations across days, during the alternation experiment (371 cells).
f) 177 cells out of 371 ESR cells had main spatial field not on the shared unstretched half of the maze. Within these 177 cells, 105 cells had highly preserved (Pearson’s r > 0.6) ESR patterns across days (Orange bar) significantly greater compared to shuffles (Grey bar). Blue dots: shows the proportion of cells for each individual animal. χ2 and p values are shown in the Figure.
Supplementary Material
Acknowledgements
We thank M. Wilson, T. Kitamura, J. Z. Young, D. Roy, G. Buzsaki, G. Dragoi, E. Brown, M. Sur, M. Harnett, M. Hasselmo, C. MacDonald, K. Allen, J. Correa, A. Aqrabawi, S. Muralidhar, Q. Ferry, K. Flick, Z. Yang, N. Chen and J. Tao for comments; F. Bushard, C. Twiss, A. Hamalian, C. Ragion, C. Lovett, D. King, and Ella Maru Studio for technical assistance; L. Brenner for paper preparation, and the members of Tonegawa lab for their support. We wish to thank Inscopix, Inc. for a scientific collaboration and providing access to nVoke integrated imaging and optogenetics system. This work was supported by the RIKEN Center for Brain Science, the Howard Hughes Medical Institute, and the JPB Foundation (to ST).
Footnotes
Data and Materials Availability
The data, code, reagents, and materials that support the findings of this study are available from the corresponding authors upon request.
DECLARATION OF INTERESTS
The authors declare no competing interests.
REFERENCES AND NOTES
- 1.Sakurai Y Coding of auditory temporal and pitch information by hippocampal individual cells and cell assemblies in the rat. Neuroscience 115, 1153–1163 (2002). [DOI] [PubMed] [Google Scholar]
- 2.O’Keefe J & Dostrovsky J The hippocampus as a spatial map. Preliminary evidence from unit activity in the freely-moving rat. Brain research 34, 171–175 (1971). [DOI] [PubMed] [Google Scholar]
- 3.MacDonald CJ, Lepage KQ, Eden UT & Eichenbaum H Hippocampal “Time Cells” Bridge the Gap in Memory for Discontiguous Events. Neuron 71, 737–749, doi: 10.1016/j.neuron.2011.07.012 (2011). [DOI] [PMC free article] [PubMed] [Google Scholar]
- 4.Pastalkova E, Itskov V, Amarasingham A & Buzsaki G Internally generated cell assembly sequences in the rat hippocampus. Science 321, 1322–1327, doi: 10.1126/science.1159775 (2008). [DOI] [PMC free article] [PubMed] [Google Scholar]
- 5.Aronov D, Nevers R & Tank DW Mapping of a non-spatial dimension by the hippocampal-entorhinal circuit. Nature 543, 719–722, doi: 10.1038/nature21692 (2017). [DOI] [PMC free article] [PubMed] [Google Scholar]
- 6.Schapiro AC, Rogers TT, Cordova NI, Turk-Browne NB & Botvinick MM Neural representations of events arise from temporal community structure. Nature Neuroscience 16, 486–492 (2013). [DOI] [PMC free article] [PubMed] [Google Scholar]
- 7.Richmond LL & Zacks JM Constructing Experience: Event Models from Perception to Action. Trends in Cognitive Sciences 21, 962–980 (2017). [DOI] [PMC free article] [PubMed] [Google Scholar]
- 8.Ben-Yakov A & Henson RN The Hippocampal Film Editor: Sensitivity and Specificity to Event Boundaries in Continuous Experience. Journal of Neuroscience 38, 10057–10068 (2018). [DOI] [PMC free article] [PubMed] [Google Scholar]
- 9.Zacks JM et al. Human brain activity time-locked to perceptual event boundaries. Nature Neuroscience 4, 651–655 (2001). [DOI] [PubMed] [Google Scholar]
- 10.Friston K & Buzsaki G The Functional Anatomy of Time: What and When in the Brain. Trends in Cognitive Sciences 20, 500–511 (2016). [DOI] [PubMed] [Google Scholar]
- 11.Hard BM, Tversky B & Lang D Making sense of abstract events: Building event schemas. Memory & Cognition 34, 1221–1235 (2006). [DOI] [PubMed] [Google Scholar]
- 12.Schank RC & Abelson RP Scripts, plans, goals and understanding: An inquiry into human knowledge structures. (L. Erlbaum, 1977). [Google Scholar]
- 13.Baldassano C et al. Discovering Event Structure in Continuous Narrative Perception and Memory. Neuron 95, 709–721 (2017). [DOI] [PMC free article] [PubMed] [Google Scholar]
- 14.Leutgeb S et al. Independent codes for spatial and episodic memory in hippocampal neuronal ensembles. Science 309, 619–623, doi: 10.1126/science.1114037 (2005). [DOI] [PubMed] [Google Scholar]
- 15.Wood ER, Dudchenko PA, Robitsek RJ & Eichenbaum H Hippocampal neurons encode information about different types of memory episodes occurring in the same location. Neuron 27, 623–633, doi:Doi 10.1016/S0896-6273(00)00071-4 (2000). [DOI] [PubMed] [Google Scholar]
- 16.Frank LM, Brown EN & Wilson M Trajectory encoding in the hippocampus and entorhinal cortex. Neuron 27, 169–178, doi:Doi 10.1016/S0896-6273(00)00018-0 (2000). [DOI] [PubMed] [Google Scholar]
- 17.Bulkin DA, Sinclair DG, Law LM & Smith DM Hippocampal state transitions at the boundaries between trial epochs. Hippocampus, doi: 10.1002/hipo.23180 (2019). [DOI] [PMC free article] [PubMed] [Google Scholar]
- 18.Terada S, Sakurai Y, Nakahara H & Fujisawa S Temporal and Rate Coding for Discrete Event Sequences in the Hippocampus. Neuron 94, 1248–1262, doi: 10.1016/j.neuron.2017.05.024 (2017). [DOI] [PubMed] [Google Scholar]
- 19.Wood ER, Dudchenko PA & Eichenbaum H The global record of memory in hippocampal neuronal activity. Nature 397, 613–616 (1999). [DOI] [PubMed] [Google Scholar]
- 20.Chen TW et al. Ultrasensitive fluorescent proteins for imaging neuronal activity. Nature 499, 295–300, doi: 10.1038/nature12354 (2013). [DOI] [PMC free article] [PubMed] [Google Scholar]
- 21.Kitamura T et al. Island Cells Control Temporal Association Memory. Science 343, 896–901, doi: 10.1126/science.1244634 (2014). [DOI] [PMC free article] [PubMed] [Google Scholar]
- 22.Okuyama T, Kitamura T, Roy DS, Itohara S & Tonegawa S Ventral CA1 neurons store social memory. Science 353, 1536–1541, doi: 10.1126/science.aaf7003 (2016). [DOI] [PMC free article] [PubMed] [Google Scholar]
- 23.Ziv Y et al. Long-term dynamics of CA1 hippocampal place codes. Nat Neurosci 16, 264–266, doi: 10.1038/nn.3329 (2013). [DOI] [PMC free article] [PubMed] [Google Scholar]
- 24.Czurko A, Hirase H, Csicsvari J & Buzsaki G Sustained activation of hippocampal pyramidal cells by ‘space clamping’ in a running wheel. Eur J Neurosci 11, 344–352, doi:DOI 10.1046/j.1460-9568.1999.00446.x (1999). [DOI] [PubMed] [Google Scholar]
- 25.McNaughton BL, Barnes CA & O’Keefe J The Contributions of Position, Direction, and Velocity to Single Unit-Activity in the Hippocampus of Freely-Moving Rats. Exp Brain Res 52, 41–49 (1983). [DOI] [PubMed] [Google Scholar]
- 26.Leutgeb S, Ragozzino KE & Mizumori SJY Convergence of head direction and place information in the CA1 region of hippocampus. Neuroscience 100, 11–19, doi:Doi 10.1016/S0306-4522(00)00258-X (2000). [DOI] [PubMed] [Google Scholar]
- 27.O’Keefe JN, The L Hippocampus as a Cognitive Map. (Clarendon Press, 1978). [Google Scholar]
- 28.Behrens TEJ et al. What Is a Cognitive Map? Organizing Knowledge for Flexible Behavior. Neuron 100, 490–509 (2018). [DOI] [PubMed] [Google Scholar]
- 29.Hahn TTG, McFarland JM, Berberich S, Sakmann B & Mehta MR Spontaneous persistent activity in entorhinal cortex modulates cortico-hippocampal interaction in vivo. Nature Neuroscience 15, 1531–1538 (2012). [DOI] [PMC free article] [PubMed] [Google Scholar]
- 30.Robinson NTM et al. Medial Entorhinal Cortex Selectively Supports Temporal Coding by Hippocampal Neurons. Neuron 94, 677–688 (2017). [DOI] [PMC free article] [PubMed] [Google Scholar]
- 31.Miao C et al. Hippocampal Remapping after Partial Inactivation of the Medial Entorhinal Cortex. Neuron 88, 590–603 (2015). [DOI] [PubMed] [Google Scholar]
- 32.Tsao A et al. Integrating time from experience in the lateral entorhinal cortex. Nature 561, 57–62 (2018). [DOI] [PubMed] [Google Scholar]
- 33.Ito HT, Zhang SJ, Witter MP, Moser EI & Moser MB A prefrontal–thalamo–hippocampal circuit for goal-directed spatial navigation. Nature 522, 50–55 (2015). [DOI] [PubMed] [Google Scholar]
- 34.Suh J, Rivest AJ, Nakashiba T, Tominaga T & Tonegawa S Entorhinal Cortex Layer III Input to the Hippocampus Is Crucial for Temporal Association Memory. Science 334, 1415–1420 (2011). [DOI] [PubMed] [Google Scholar]
- 35.Yamamoto J, Suh J, Takeuchi D & Tonegawa S Successful execution of working memory linked to synchronized high-frequency gamma oscillations. Cell 157, 845–857 (2014). [DOI] [PubMed] [Google Scholar]
- 36.Zacks JM, Speer NK, Swallow KM, Braver TS & Reynolds JR Event Perception: A Mind/Brain Perspective. Psychol Bull 133, 273–293 (2007). [DOI] [PMC free article] [PubMed] [Google Scholar]
- 37.Tulving E Organization of Memory. (Academic Press, 1972). [Google Scholar]
- 38.Whittington JC et al. The Tolman-Eichenbaum Machine: Unifying space and relational memory through generalisation in the hippocampal formation. bioRxiv, 770495, doi: 10.1101/770495 (2019). [DOI] [PMC free article] [PubMed] [Google Scholar]
- 39.Gauthier JL & Tank DW A Dedicated Population for Reward Coding in the Hippocampus. Neuron 99, 179–193 (2018). [DOI] [PMC free article] [PubMed] [Google Scholar]
- 40.Dragoi G & Tonegawa S Preplay of future place cell sequences by hippocampal cellular assemblies. Nature 469, 397–401 (2011). [DOI] [PMC free article] [PubMed] [Google Scholar]
- 41.Foster D & Wilson M Reverse replay of behavioural sequences in hippocampal place cells during the awake state. Nature 440, 680–683 (2006). [DOI] [PubMed] [Google Scholar]
- 42.Pratt LY Discriminability-Based Transfer between Neural Networks. Advances in Neural Information Processing Systems 5, 204–211 (1992). [Google Scholar]
- 43.Tse D et al. Schemas and memory consolidation. Science 316, 76–82 (2007). [DOI] [PubMed] [Google Scholar]
- 44.Hinton GE & Morris RGM in Parallel distributed processing: Implications for psychology and neurobiology 46–61 (Clarendon Press/Oxford University Press, 1986). [Google Scholar]
- 45.Yosinski J, Clune J, Bengio Y & Lipson H How transferable are features in deep neural networks? Advances in Neural Information Processing Systems 27, 3320–3328 (2014). [Google Scholar]
- 46.Spiers HJ, Hayman RM, Jovalekic A, Marozzi E & Jeffery KJ Place field repetition and purely local remapping in a multicompartment environment. Cerebral cortex (New York, N.Y. : 1991) 25, 10–25, doi: 10.1093/cercor/bht198 (2015). [DOI] [PMC free article] [PubMed] [Google Scholar]
- 47.Grieves RM, Jenkins BW, Harland BC, Wood ER & Dudchenko PA Place field repetition and spatial learning in a multicompartment environment. Hippocampus 26, 118–134, doi: 10.1002/hipo.22496 (2016). [DOI] [PMC free article] [PubMed] [Google Scholar]
- 48.Derdikman D et al. Fragmentation of grid cell maps in a multicompartment environment. Nature Neuroscience 12, 1325–1332, doi: 10.1038/nn.2396 (2009). [DOI] [PubMed] [Google Scholar]
- 49.Singer AC, Karlsson MP, Nathe AR, Carr MF & Frank LM Experience-dependent development of coordinated hippocampal spatial activity representing the similarity of related locations. The Journal of neuroscience : the official journal of the Society for Neuroscience 30, 11586–11604, doi: 10.1523/jneurosci.0926-10.2010 (2010). [DOI] [PMC free article] [PubMed] [Google Scholar]
- 50.Mukamel EA, Nimmerjahn A & Schnitzer MJ Automated Analysis of Cellular Signals from Large-Scale Calcium Imaging Data. Neuron 63, 747–760, doi: 10.1016/j.neuron.2009.08.009 (2009). [DOI] [PMC free article] [PubMed] [Google Scholar]
- 51.Dombeck DA, Harvey CD, Tian L, Looger LL & Tank DW Functional imaging of hippocampal place cells at cellular resolution during virtual navigation. Nature Neuroscience 13, 1433–1440 (2010). [DOI] [PMC free article] [PubMed] [Google Scholar]
- 52.Skaggs WE, McNaughton BL & Gothard KM in Advances in neural information processing systems. 1030–1037. [PubMed] [Google Scholar]
- 53.Wills TJ, Cacucci F, Burgess N & O’Keefe J Development of the Hippocampal Cognitive Map in Preweanling Rats. Science 328, 1573–1576 (2010). [DOI] [PMC free article] [PubMed] [Google Scholar]
- 54.Gamble D (MATLAB Central File Exchange, https://www.mathworks.com/matlabcentral/fileexchange/22282-venn, 2011).
Associated Data
This section collects any data citations, data availability statements, or supplementary materials included in this article.


