

ABSTRACT
Damaged mitochondria accumulation in diabetes is one of the main features that contribute to increased incidence of cognitive impairment by inducing apoptosis. Butyrate is a major metabolite produced by microbiota that has neuroprotective effects by regulating mitochondrial function. However, detailed mechanisms underlying how butyrate can regulate neuronal mitophagy remain unclear. Here, we examined the regulatory effects of sodium butyrate (NaB) on high glucose-induced mitophagy dysregulation, neuronal apoptosis, and cognitive impairment and its underlying mechanisms in human-induced pluripotent stem cell-derived neurons, SH-SY5Ys, and streptozotocin (STZ)-induced diabetic mice. In our results, diabetic mice showed gut-microbiota dysbiosis, especially a decreased number of butyrate-producing bacteria and reduced NaB plasma concentration. NaB ameliorated high glucose-induced neuronal mitochondrial dysfunction by recovering PRKN/Parkin-mediated mitophagy. High glucose-induced reactive oxygen species (ROS) and -inhibited PRKAA/AMPKα stimulated the RELA/p65-HDAC8 complex, which downregulated PRKN protein expression by binding to the PRKN promoter region. NaB restored PRKN expression by blocking RELA nuclear translocation and directly inhibiting HDAC8 in the nucleus. In addition, HDAC8 overexpression inhibited the positive effect of NaB on high glucose-induced mitophagy dysfunction and neuronal apoptosis. Oral administration of NaB improved cognitive impairment in diabetic mice by restoring mitophagy in the hippocampus. Taken together, NaB ameliorates neuronal mitophagy through PRKN restoration by inhibiting RELA-HDAC8 complexes, suggesting that NaB is an important substance for protecting neuronal apoptosis in diabetes-associated cognitive impairment.
KEYWORDS: autophagy, diabetes, gut-brain axis, mitochondria, neuronal apoptosis, short-chain fatty acids
Introduction
Dysregulation of mitochondrial clearance is a main feature of diabetes that contributes to an increased risk of neurological disorders in the central nervous system (CNS) [1–4]. Mitophagy, which selectively removes damaged mitochondria through the autophagy/lysosome pathway, is essential for appropriate mitochondrial function by maintaining mitochondrial quality control [5]. PINK1 (PTEN induced kinase 1), PRKN/Parkin (parkin RBR E3 ubiquitin protein ligase), BNIP3L/NIX (BCL2 interacting protein 3 like), BNIP3 (BCL2 interacting protein 3), and FUNDC1 (FUN14 domain containing 1) are mitophagy-inducing and regulating proteins reportedly dysregulated in diabetes and cognitive impairment [1,6,7]. However, the roles of mitophagy and related proteins in the pathogenesis of these diseases remain unclear. Indeed, elevated PINK1 and PRKN protein levels in db/db mice and increased BNIP3, BNIP3L, and FUNDC1 protein levels in diabetic canines result in overactivation of mitophagy and the development of diabetes [8,9]. Hyperactivation of mitophagy in the sensory neurons of diabetic mice is considered to be a mechanism involved in neuropathy development [10]. Conversely, prkn deletion in diabetic mice inhibited mitophagy, exacerbated mitochondrial dysfunction and disease progression [11]. In particular, PINK1 reduction in the dorsal root ganglion neurons of db/db mice also inhibited mitophagy and induced diabetic neuropathy [12]. Thus, given that regulation of mitophagy is controversial in the pathogenesis of diabetes and associated neurological disorders, identifying the effects and regulatory mechanisms of neuronal mitophagy on high glucose conditions is essential for proper mitochondrial clearance. Moreover, modulation of mitophagy provides therapeutic and preventive insights into diabetes-associated cognitive impairment.
Abnormal gut-microbiota composition in diabetic patients is considered a risk factor for cognitive impairment [13,14]. Recently, microbiota transplantation or administration of short-chain fatty acids (SCFAs), metabolites produced in the colon, has been used to elucidate the role of the gut-brain axis (GBA), the bidirectional communication between the enteric and central nervous systems, and the development of new therapeutics for diabetes and cognitive impairment [15,16]. SCFAs such as acetate, butyrate, and propionate have the highest concentration in the ascending colon (70–140 mM) and gradually decrease in the descending colon (20–40 mM) [17]. They exert a variety of neuronal functions by modulating oxidative stress, cellular homeostasis, nutrient metabolism, and inflammation through transporter- and receptor-mediated signaling pathways [18–20]. In particular, SCFAs act as potent histone deacetylase (HDAC) inhibitors, epigenetically modulating gene expression to ameliorate diabetes progression; especially, acetate and butyrate protect against neuronal cell death and improve neurogenesis and cognitive functions [21,22]. Previous studies have shown that propionate attenuates the structural disruption of mitochondria, and that butyrate positively modulates neuronal mitochondrial function by enhancing OXPHOS metabolism through epigenetic regulation [20,23]. In addition, butyrate induces mitophagy and enhances the expression of the mitophagy-related proteins PINK1, MAP1LC3B/LCB (microtubule associated protein 1 light chain 3 beta), PTEN (phosphatase and tensin homolog), and PRKN which improves cell viability [24–26]. Although SCFAs are sufficient to suggest that can modulate neuronal mitophagy, specific SCFAs that have optimal effects on neuronal mitochondrial function and the detailed molecular mechanism underlying their effects on mitophagy and specific mitophagy-related proteins under high glucose conditions still need to be investigated. In the present study, we explored the effects and regulatory mechanisms of SCFAs on high glucose-induced mitophagy dysregulation, subsequent neuronal apoptosis, and cognitive impairment using human induced pluripotent stem cell-derived neuronal differentiated cells (iPSC-NDs), SH-SY5Ys, and streptozotocin (STZ)-induced diabetic mice. Our study elucidates SCFAs as mitophagy enhancers and potential therapeutic candidate for diabetes-associated cognitive impairment.
Results
Sodium butyrate, but not propionate or acetate, ameliorates diabetes-induced mitochondrial dysfunction and neuronal apoptosis
Changes in mitochondrial membrane potential and mtROS production disrupt mitochondrial function, which is a hallmark of the early stage of programmed cell death [27]. SCFAs affect mitochondrial function, thereby maintaining cellular homeostasis [22]. Thus, we investigated whether any of the three major SCFAs, sodium propionate (NaP), sodium acetate (NaA), or sodium butyrate (NaB), prevents dysregulation of the mitochondrial ROS, mitochondrial membrane potential, and cell death in neuronal cells exposed to high glucose. Our results showed that among all SCFAs, only NaB pretreatment decreased high glucose-evoked mtROS levels and mitochondrial depolarization in SH-SY5Ys and iPSC-NDs (Figure 1A–D). Furthermore, NaB, but not NaP or NaA, protected against high glucose-induced neuronal apoptosis (Figure 1E,F).
Figure 1.

Among SCFAs, NaB ameliorated high glucose-induced mitochondrial dysfunction, and neuronal cell death. (A–D) SH-SY5Ys and iPSC-NDs were pretreated with NaA (500 µM), NaB (500 µM), NaP (500 µM) for 30 min prior to high glucose (HG; 25 mM) treatment for 24 h. (A and B) The mean fluorescence intensities of MitoSOX were measured by flow cytometric analysis. n = 4 and n = 5, respectively. (C and D) The mean fluorescence intensities of TMRE were measured by flow cytometric analysis. n = 4,n = 5, respectively. (E and F) SH-SY5Ys and iPSC-NDs were pretreated with NaA (500 µM), NaB (500 µM), NaP (500 µM) for 30 min prior to HG (25 mM) treatment for 72 h. (E) The protein levels of cleaved-CASP3 and ACTB were detected by western blotting. n = 4. (F) The percentage of apoptotic cells (ANXA5 and PI positive) were measured by flow cytometric analysis. n = 5. (G–J) Mice were injected with either vehicle (0.05 M citrate buffer) or STZ (75 mg/kg/day) for the first 3 days of 8 weeks of diabetes induction. (G) β diversity between vehicle (red) and STZ (blue); weighted UniFrac distance, bray – Curtis. (H) The taxonomic abundance of annotation at the genus level. n = 4. (I) The concentration of NaB in the plasma of mice, measured by GC – MS. n = 4. (J) Representative immunohistochemistry images of the hippocampus stained with cleaved-CASP3 and DAPI. n = 4. Scale bars: 20 μm. All data are representative. Quantitative data are represented as mean ± SEM. *p < 0.05 versus vehicle-injected mice or control; #p < 0.05 versus HG.
To further elucidate how NaB is involved in diabetes-induced mitochondrial dysfunction and neuronal cell death, we first investigated whether diabetes alters the composition of the gut microbiota using α-and β-diversity analysis in STZ-induced diabetic mice. The diversity analysis was used to evaluate the distribution of species abundance in a given sample into a single number that depends on species richness and evenness. β-diversity indicates the differences between two samples, whereas α-diversity represents diversity within a sample. There was no significant difference in microbial diversity between the groups (Figure S1A); however, the microbial composition of the control and STZ-induced diabetic mice differed significantly (Figure 1G). Given that butyrate is the major gut microbial metabolite that plays a key role in the neuronal protection through antioxidant mechanisms [19] and Figure 1A–F, we analyzed changes in the proportion of butyrate-producing bacteria in STZ-induced diabetic mice using taxonomic analysis. As known, the main butyrate-producing bacteria are anaerobes, including Bacteroidetes, Firmicutes, and Proteobacteria [13]. In our results at the total phylum level, the proportion of Bacteroidetes and Proteobacteria decreased, that of Firmicutes increased in STZ-induced diabetic mice compared with that in control mice (Figure S1B). Specifically, the proportion of Bacteroides in Bacteroidetes and Clostridium, Coprococcus, and Ruminococcus in Firmicutes decreased at the genus level (Figure 1H). Next, we measured the plasma butyrate concentration in STZ-induced diabetic mice. Using gas chromatography – mass spectrometry, we observed decreased plasma butyrate levels in STZ-induced diabetic mice (Figure 1I). Furthermore, the signal intensity of cleaved-CASP3 increased in the hippocampus of STZ-induced diabetic mice compared with that in control mice (Figure 1J). These findings demonstrated that diabetes reduces the number of butyrate-producing gut microbiota and butyrate production and induces neuronal apoptosis.
NaB restores the PRKN-mediated mitophagy suppressed by high glucose
Since the accumulation of damaged mitochondria is a major pathological mechanism of diabetes-mediated mitochondrial dysfunction [11], we investigated the effect of NaB on mitochondrial mass under high glucose conditions. Our data showed that NaB reduced the mean fluorescence intensity of MitoTracker Green, a mitochondria-specific dye verifying mitochondrial content, which was increased in SH-SY5Ys and iPSC-NDs exposed to high glucose (Figure 2A,B). The protein level of TOMM20, a marker of mitochondrial mass, was also reversed by NaB treatment in the high glucose-exposed iPSC-NDs (Figure 2C). To maintain mitochondrial function, damaged mitochondria are normally degraded through the process of mitophagy [5]. By measuring the amount of mtDNA accumulated under impaired mitophagy [28], we found that NaB restored impaired mitochondrial clearance under high glucose conditions (Figure 2D). We also used the mitophagy reporter mitochondria-targeted Keima (mt-Keima) and co-stained MAP1LC3B and TOMM20 to elucidate the effect of NaB on mitophagy under high glucose conditions. mt-Keima is a coral-derived acid-stable protein that changes color from green to red in lysosomes when mitophagosomes are acidic [29]. NaB increased the red signal of mt-Keima, indicating mitophagic flux, under high glucose conditions (Figure 2E). The lower degree of colocalization between MAP1LC3B and TOMM20 in high glucose-exposed SH-SY5Ys was recovered by NaB (Figure 2F). Moreover, we identified the stage of mitophagy inhibited under high glucose conditions using bafilomycin A1 which blocks the fusion between mitophagosomes and lysosomes. Our results show that high glucose increased mitochondrial contents; bafilomycin A1 alone increased TOMM20 levels and the MAP1LC3B-II:MAP1LC3B-I ratio, however, in combination with high glucose, it did not significantly alter the MAP1LC3B-II:MAP1LC3B-I ratio (Figure 2G).
Figure 2.
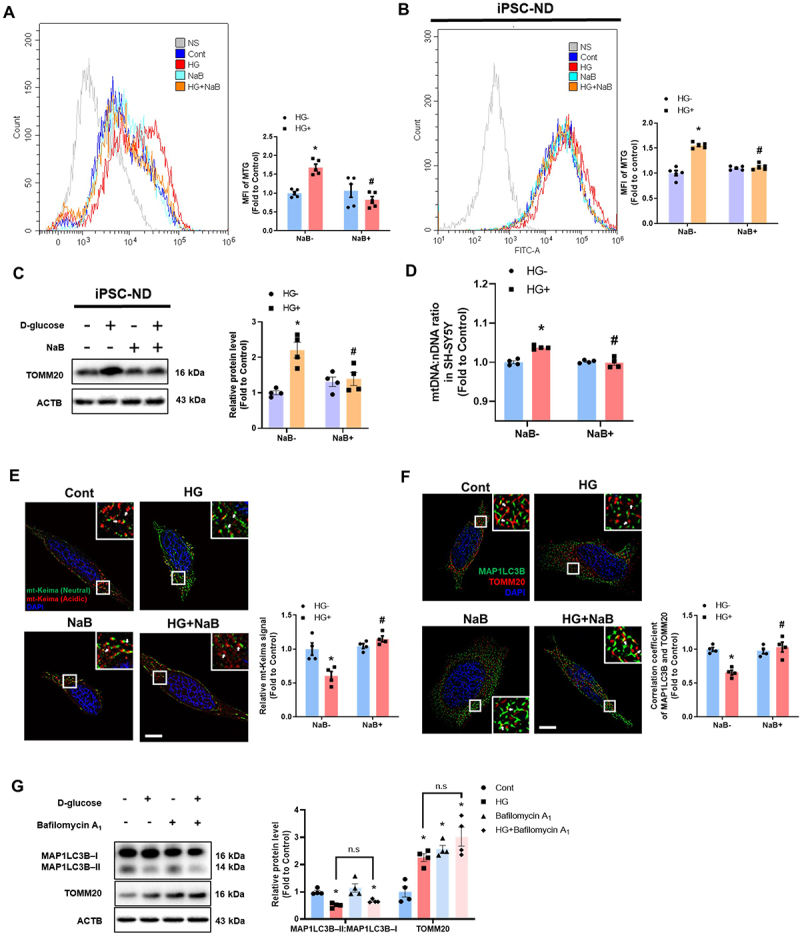
NaB recovered neuronal mitophagy suppressed by high glucose. (A–F) SH-SY5Ys and iPSC-NDs were pretreated with NaB for 30 min prior to HG treatment for 24 h. (A and B) The mean fluorescence intensities of MitoTracker green (MTG) were measured by flow cytometric analysis. n = 5. (C) The protein levels of TOMM20 and ACTB were detected by western blotting. n = 4. (D) The DNA levels of mtDNA and nDNA were analyzed by real-time PCR. ACTB was used as a loading control. (E) SH-SY5Y cells were transfected with mt-keima 24 h prior to NaB treatment for 30 min and visualized. n = 4. Scale bars: 10 μm. (F) Immunofluorescence staining of TOMM20, MAP1LC3B, and DAPI were visualized. n = 4. Scale bars: 10 μm. (G) SH-SY5Ys were treated with HG for 24 h. Bafilomycin A1 (10 nM) was applied for 2 h prior to harvest. The protein levels of TOMM20, MAP1LC3B – I, MAP1LC3B – II, and ACTB were detected by western blotting. All data are representative. Quantitative data are represented as mean ± SEM. *p < 0.05 versus control; #p < 0.05 versus HG.
To elucidate how NaB recovers from high glucose-inhibited mitophagy, we first analyzed changes in the levels of mitophagosome formation-related proteins in the hippocampus of STZ-induced diabetic mice and high glucose-treated SH-SY5Ys. Our data showed that only the PRKN protein level decreased in the hippocampus of STZ-induced diabetic mice compared to control mice, whereas PINK1 increased (Figure 3A). The protein levels of PRKN were also reduced in SH-SY5Y cells exposed to high glucose (Figure 3B). Based on our results, we speculated that reduced PRKN protein levels might inhibit mitophagy under high glucose conditions despite increased PINK1 expression. Thus, we analyzed the mRNA levels in SH-SY5Ys and iPSC-NDs to determine whether the reduced PRKN protein level was due to the restriction of the amount of mRNA that is produced from a particular gene or is regulated through post-transcriptional events that regulate the translation of mRNA into proteins. NaB restored high glucose-inhibited mRNA levels of PRKN in SH-SY5Ys and iPSC-NDs exposed to high glucose (Figure 3C,D). NaB also restored PRKN expression in iPSC-NDs exposed to high glucose (Figure 3E). To investigate the effect of PRKN downregulation on mitophagy, we transfected cells with mt-Keima-PRKN, which overexpresses PRKN and identifies mitophagic flux. Our data found that either NaB treatment or PRKN overexpression restored the high glucose-decreased red signal of mt-Keima cells (Figure 3F). Moreover, as ubiquitination is required for PRKN-mediated mitophagy upon mitochondrial damage [5], we showed that NaB recovered the degree of co-localization between UB/ubiquitin and MFN1, one of the outer mitochondrial membrane proteins that is well known as a PRKN substrate, which was inhibited by high glucose treatment (Figure 3G). These data demonstrate that NaB ameliorated high glucose-suppressed neuronal mitophagy by normalizing PRKN expression.
Figure 3.

NaB recovered PRKN expression decreased by high glucose. (A) Mice were injected with either vehicle (0.05 M citrate buffer) or STZ (75 mg/kg/day) for the first 3 days of 8 weeks of diabetes induction. The protein level of PINK1, BNIP3, BNIP3L/NIX, PRKN, OPTN/optineurin, CALCOCO2/NDP52, and ACTB in hippocampal were subjected to western blotting. n = 4. (B) SH-SY5Ys were exposed to HG for 24 h. The protein levels of PINK1, BNIP3, BNIP3L, PRKN, OPTN, CALCOCO2, and ACTB were subjected to western blotting. n = 4. (C – G) SH-SY5Ys and iPSC-NDs were pretreated with NaB for 30 min prior to HG treatment for 24 h. (C) The mRNA expression levels of PINK1, BNIP3, BNIP3L, PRKN, OPTN, CALCOCO2 were investigated. n = 4. (D) The mRNA expression levels of PRKN were investigated n = 4. (E) Protein levels of the PRKN and ACTB were determined by western blotting. n = 4. (F) Cells were transfected with mt-keima-red or mt-keima-red-PRKN 24 h prior to NaB treatment for 30 min and visualized. n = 4. Scale bars: 10 μm. (G) Immunofluorescence staining of MFN1, UB, and DAPI were visualized. n = 4. Scale bars: 10 μm. All data are representative. Quantitative data are represented as mean ± SEM. *p < 0.05 versus vehicle-injected mice or control; #p < 0.05 versus HG.
PRKN was selectively decreased by high glucose-activated RELA and HDAC8
Since NaB acts through SLC5A8/SMCT1 (solute carrier family 5 member 8) or G protein-coupled receptor (GPCR)-mediated signaling, we used ibuprofen (an SLC5A8 inhibitor) and pertussis toxin (PTX, a GNAI/Gαi inhibitor) to investigate how NaB enters the cell and block high glucose-inhibited PRKN expression. We found that pretreatment with ibuprofen, but not PTX, blocked mean fluorescence intensities of MitoTracker that were reversed by NaB in SH-SY5Ys exposed to high glucose (Figure 4A). Furthermore, ibuprofen inhibited NaB-mediated PRKN and TOMM20 restoration (Figure 4B). These results indicate that NaB regulates PRKN expression and mitochondrial mass via SLC5A8. The transcription factors ATF4, JUN/c-JUN, MYCN/n-Myc, AHR, TP53/p53, and RELA/p65 bind to the PRKN promoter, thus regulating its expression [30]. Among them, to further investigate how NaB restores PRKN expression under high glucose conditions, we focused on RELA, as it can repress gene expression in an ROS-dependent manner in the pathogenesis of diabetes [31,32] and can be modulated by NaB-mediated antioxidant effects [19]. Indeed, high glucose induced RELA nuclear translocation, which was reversed by pretreatment with NAC, a ROS scavenger, and NaB (Figure 4C). Moreover, RELA silencing restored the high glucose reduced PRKN protein levels (Figure 4D). Since RELA requires a co-repressor to downregulate transcription [33] and HDAC is a major epigenetic regulator in diabetic pathogenesis [34], we hypothesized that HDACs could repress PRKN expression together with RELA in our experimental conditions. Therefore, we used class-specific inhibitors, TC-H 106 (class I inhibitor; HDAC1, HDAC2, HDAC3), PCI 34,051 (HDAC8 inhibitor), and TMP269 (class II inhibitor; HDAC4, HDAC5, HDAC7, and HDAC9) to investigate which HDAC isotypes were involved in PRKN downregulated by high glucose. We found that blocking class I HDACs (HDACs 1, 2, 3, and 8) recovered the PRKN protein levels reduced by high glucose (Figure 4E). Among class I HDACs, there were no significant changes in either HDAC mRNA or protein levels under high glucose conditions (Figure 4F,G). However, HDAC8 silencing recovered high glucose-downregulated PRKN mRNA expression, whereas silencing HDAC1, HDAC2, or HDAC3 had no effect (Figure 4H). Similarly, HDAC8 silencing recovered the high glucose-downregulated PRKN protein levels (Figure 4I). These data suggest that high glucose-activated RELA and HDAC8 are involved in PRKN downregulation.
Figure 4.

SLC5A8 is involved in the inhibitory effect of NaB of PRKN expression on suppressing high glucose activated RELA and HDAC8. (A and B) SH-SY5Ys were pretreated with NaB or PTX (200 nM), or Ibuprofen (500 µM) for 30 min before HG treatment for 24 h. (A) The mean fluorescence intensities of MTG were measured by flow cytometric analysis. n = 4. (B) The protein levels of PRKN, TOMM20, and ACTB were detected by western blotting. n = 4. (C) SH-SY5Ys were pretreated with NAC (2 mM) or NaB for 30 min prior to HG treatment for 24 h. Immunofluorescence staining of RELA and DAPI were visualized. n = 4. Scale bars: 10 μm. (D) SH-SY5Ys were transfected with RELA siRNA or NT siRNA for 24 h and exposed to HG for 24 h. The protein levels of PRKN and ACTB were detected by western blotting. n = 4. (E) SH-SY5Ys were pretreated with TC-H 106 (10 µm) + PCI 34051 (10 µm), or TMP269 (5 µm) for 30 min before HG treatment for 24 h. The protein levels of PRKN, TOMM20, and ACTB were detected by western blotting. n = 4. (F and G) SH-SY5Ys were exposed to HG for 24 h. (F) The mRNA expression levels of HDAC1, HDAC2, HDAC3, HDAC8 were investigated. n = 4. (G) The protein levels of HDAC1, HDAC2, HDAC3, HDAC8 were detected by western blotting. n = 4. (H and I) SH-SY5Ys were transfected with HDAC1, HDAC2, HDAC3, HDAC8 siRNA or NT siRNA for 24 h, and exposed to HG for 24 h. (H) The mRNA expression of PRKN was detected by PCR. n = 4. (I) The protein levels of PRKN and ACTB were detected by western blotting. n = 4. All data are representative. Quantitative data are represented as mean ± SEM. *p < 0.05 versus control; #p < 0.05 versus HG.
NaB restores mitophagy and protects from neuronal death by disrupting the high glucose-induced RELA-HDAC8 complex
Previous studies have shown that phosphorylation of HDAC8 reduces its activity and have suggested 5’adenosine monophosphate-activated protein kinase (AMPK) and PRKA/PKA (protein kinase cAMP-activated) as the candidate enzymes that phosphorylates HDAC8 [35,36]. Given that, since increase in the AMP:ADP/ATP ratio due to glucose deprivation induces PRKAA/AMPKα (protein kinase AMP-activated catalytic subunit alpha) phosphorylation and that PKA is increased in high-glucose conditions [37], we focused on PRKAA to investigate how high glucose and NaB regulate HDAC8 activity. High glucose treatment inhibited phosphorylation of both PRKAA at Thr172 and HDAC8 at Ser39 (Figure 5A). Pretreatment with AICAR (5-aminoimidazole-4-carboxamide ribonucleotide), a PRKAA activator, recovered the high glucose-inhibited HDAC8 phosphorylation, but NaB did not (Figure 5B). However, NaB reversed the high glucose-induced HDAC8 activity in the nucleus (Figure 5C), suggesting that NaB directly inhibits HDAC8 as it is an inhibitor of HDAC [38]. These results suggest that high glucose-inhibited PRKAA increases HDAC8 activity and that NaB directly blocks HDAC8 activity in the nucleus. To further investigate how RELA and HDAC8 repress PRKN expression, we showed that the degree of colocalization between HDAC8 and RELA in the nucleus increased by high glucose was blocked by NaB (Figure 5D). In addition, NaB also reversed the interaction between RELA and HDAC8 increased in the SH-SY5Ys exposed to high glucose (Figure 5E). Given that RELA represses PRKN expression [39], we surmised existence of RELA binding motifs in the PRKN promoter region, −500 bp from the transcription start site (Figure S2A). High-glucose-induced RELA binding to the PRKN promoter was blocked by NaB (Figure 5F). NaB also inhibited the increased HDAC8 binding to RELA in the PRKN promoter under high glucose conditions (Figure 5G). Simultaneously, both overall chromatin relaxation and binding of acetylated-histone H3 to the RELA region of the PRKN promoter were reduced by high glucose, which was restored by NaB (Figure 5H,I). These results indicate that NaB restored PRKN levels by blocking high glucose-mediated formation of the RELA-HDAC8 complex in the PRKN promoter region and deacetylation-mediated chromosome condensation.
Figure 5.

PRKAA-mediated HDAC8 activity and ROS-induced RELA stimulate complex that suppresses transcription of PRKN under high glucose conditions. (A) SH-SY5Ys were treated with HG for 1, 3, and 6 h. The protein levels of p-PRKAA, PRKAA, p-HDAC8, HDAC8 and ACTB were detected by western blotting. n = 4. (B) SH-SY5Ys were pretreated with AICAR (1 mM) for 30 min prior to treatment of HG for 6 h. The protein levels of p-HDAC8, HDAC8 and ACTB were detected by western blotting. n = 4. (C – E) NaB were pretreated 30 min prior to HG treatment for 24 h. (C) HDAC8 activity in the nucleus were measured with HDAC8 activity assay kit. n = 4. (D) Immunofluorescence staining of HDAC8, RELA, and DAPI were visualized in SH-SY5Ys. n = 4. Scale bars: 10 μm. (E) Interaction between RELA and HDAC8 (RELA+HDAC8, red) was assessed by PLA assay. n = 4. Scale bars: 10 μm. (F – I) SH-SY5Y cells were were pretreated with NaB 30 min prior to HG treatment for 6 h. (F, G, I) DNA was immunoprecipitated with RELA, HDAC8, and acetyl-histone H3 antibody, respectively. The immunoprecipitation and input samples were amplified with primers of GAPDH and PRKN gene. n = 3. (H) Fold enrichment of PRNK region was assayed by chromatin accessibility assay kit. n = 4. All data are representative. Quantitative data are represented as mean ± SEM. *p < 0.05 versus control; #p < 0.05 versus HG.
To verify the inhibitory effect of NaB on RELA-HDAC8 complex-mediated mitochondrial accumulation, dysfunction, and neuronal cell death under high glucose conditions, we performed a gain-of-function study through HDAC8 overexpression, since the repressive effect of RELA relies on HDACs [31]. The mean fluorescence intensity of MitoSox in SH-SY5Ys exposed to high glucose with NaB pretreatment and pcDNA3.1-GFP transfection was lower than that of high glucose with NaB pretreatment and pcDNA3.1-HDAC8-GFP transfection (Figure 6A). In addition, HDAC8 overexpression blocked NaB-restored mitochondrial membrane potential under high-glucose conditions (Figure 6B). Also, TOMM20 and PRKN protein levels recovered by NaB were blocked by pcDNA3.1-HDAC8-GFP transfection (Figure 6C). Moreover, neuronal cell death that was protected by NaB under high glucose conditions was induced by HDAC8 overexpression (Figure 6D,E). These findings demonstrate that NaB restored high glucose-induced abnormal mitochondrial accumulation, mitochondrial dysfunction, and neuronal cell death through HDAC8 inhibition.
Figure 6.

Overexpressed HDAC8 blocked the protective effect of NaB under high glucose conditions. (A – C) SH-SY5Ys were transfected with pcDNA3.1-GFP or pcDNA3.1-HDAC8-GFP 24 h prior to NaB treatment for 30 min and exposed to HG for 24 h. (A) The mean fluorescence intensities of MitoSOX were measured by flow cytometric analysis. n = 4. (B) The mean fluorescence intensities of TMRE were measured by flow cytometric analysis, respectively. n = 4. (C) tThe protein levels of PRKN, TOMM20 and ACTB were detected by western blotting. n = 3. (D and E) SH-SY5Ys were transfected with pcDNA3.1-GFP or pcDNA3.1-HDAC8-GFP prior to NaB treatment for 30 min and exposed to HG for 72 h. (D) The protein levels of cleaved-CASP3 and ACTB were detected by western blotting. n = 3. (E) LDH from cell supernatant were measured by LDH cytotoxicity assay kit. n = 4. All data are representative. Quantitative data are represented as mean ± SEM. *p < 0.05 versus pcDNA3.1-GFP; #p < 0.05 versus HG+pcDNA3.1-GFP.
Oral administration of NaB alleviated cognitive impairment in diabetic mice by restoring mitophagy and inhibiting neuronal apoptosis in the hippocampus
Next, we investigated whether NaB alleviated impaired mitophagy, neuronal apoptosis, and cognitive impairment in STZ-induced diabetic mice. Diabetic mice with NaB oral treatment restored weight loss and prevented further increases in blood glucose levels. (Figure S3A). NaB restored PRKN expression in the hippocampus of STZ-induced diabetic mice (Figure 7A). In addition, STZ-induced diabetic mice showed reduced co-localization between MAP1LC3B with TOMM20 in the hippocampus, which was recovered by NaB (Figure 7B). The degree of co-localization between TOMM20 and oxidative stress markers 4-hydroxy-2-noneal (4-HNE) or 8-hydroxy-2-deoxyguanosine (8-oxo-dG) [40,41] was increased in the hippocampus of STZ-induced diabetic mice, and this was inhibited by NaB oral treatment (Figure 7C,D). The increased levels of cleaved-CASP3 in the hippocampus of STZ-induced diabetic mice were reduced by NaB oral treatment (Figure 7E). We used the Y-maze, novel object recognition, and open field tests to evaluate cognitive impairment. We observed that diabetic mice with NaB oral treatment recovered cognitive function compared with STZ-induced diabetic mice (Figure 7F,G). Moreover, compared to STZ-induced diabetic mice, which were more active in the peripheral regions than in the center of the open field and less mobile, NaB oral treated mice explored the center and become more mobile (Figure 7H). These results suggest that NaB exerts a protective effect against diabetes-induced mitophagy impairment, neuronal apoptosis, and cognitive impairment.
Figure 7.

Oral administration of NaB recovered cognitive impairment in diabetic mice by preventing apoptosis through mitophagy restoration. (A – H) Mice were injected with either vehicle (0.05 M citrate buffer) or STZ (75 mg/kg/day) for the first 3 days of 8 weeks of diabetes induction. Mice injected with either vehicle or STZ were orally administered vehicle or NaB (0.5 g/kg/day) once daily for 8 weeks after diabetes induction. (A) The protein levels of the hippocampal PRKN and ACTB were determined by western blotting. n = 4. (B) Representative immunohistochemistry images of the hippocampus stained with TOMM20, MAP1LC3B, and DAPI. n = 4. Scale bars: 20 μm. (C) Representative immunohistochemistry images of the hippocampus stained with TOMM20, 4-HNE, and DAPI. n = 4. Scale bars: 20 μm. (D) Representative immunohistochemistry images of the hippocampus stained with TOMM20, 8-oxo-dG, and DAPI. n = 4. Scale bars: 20 μm. (E) The protein levels of the hippocampal cleaved-CASP3 and ACTB were determined by western blotting. n = 4. (F – H) The mice were subjected to Y-maze test, NOR test, and open field test, respectively. n = 5. (I) The schematic model for the protective effect of NaB against HG-suppressed PRKN-dependent mitophagy leading to cognitive impairment. All data are representative. Quantitative data are represented as mean ± SEM. *p < 0.05 versus vehicle-injected mice; #p < 0.05 versus STZ-injected mice.
Discussion
Our study reveals evidence that the protective effect of NaB on diabetes-associated cognitive impairment is by ameliorating PRKN-mediated mitophagy through the inhibition of RELA-HDAC8 complexes. SCFAs have been found to have effects to protect oxidative stress and improve mitochondrial dysfunction, which is considered a major factor in diabetes and neuronal apoptosis [19,42]. Our results showed that NaB prevented high glucose-induced mitochondrial ROS, mitochondrial membrane potential disruption, and neuronal apoptosis, whereas NaA and NaP did not. These results suggest that NaB may have a better protective effect against neuronal mitochondrial dysfunction under hyperglycemic conditions, but further studies are needed to elucidate the modulation of mitochondria function. Recently, several studies have reported the imbalance in the intestinal microbiome that is associated with diabetes causes GBA disturbances, which may significantly contribute to the pathogenesis of cognitive impairment [13,14]. With respect to butyrate-producing bacteria, patients with diabetes were characterized by fewer Firmicutes and more Bacteroidetes and Proteobacteria at the phylum level. At the genus level, dysbiosis presents a decrease in Clostridium, Faecalibacterium, Ruminococcus, and Roseburia [13,43]. Interestingly, we found that STZ-induced diabetic mice showed more Firmicutes and fewer Bacteroidetes, which paradoxically led to the prediction of increased butyrate-producing bacterial levels in diabetes. However, our data showed both a decreased population of butyrate-producing bacteria at the genus level and lower plasma butyrate concentration in STZ-induced diabetic mice, similar to previous research showing decreased fecal butyrate levels in patients with diabetes or cognitive impairment [13,44]. Given that the dysbiosis of the gut microbiome in STZ-induced diabetic mice is caused by an increase in microbial population with high respiratory activity through alterations in the gut metabolome, and a disruption of the integrity of the gut barrier in the hyperglycemic environment [45,46], these discrepancies at the phylum level might be due to interspecies differences; thus, our data provided basic information on the change in the population of butyrate-producing bacteria in diabetes. At the same time, inconsistencies in the changes in bacteria between studies support the administration of NaB itself rather than bacteria transplantation for the treatment of diabetes-related diseases.
The reduction of PINK1 and PRKN inhibits mitophagy in the pathogenesis of diabetes [11,12]. Our results showed an interesting finding that among several mitophagy-related factors, high glucose increased the protein levels of neuronal PINK1 but decreased those of PRKN. As a result, mitophagy suppression and mitochondrial dysfunction were induced, possibly because despite the increased PINK1 levels trying to maintain mitochondrial quality control, the reduction in PRKN expression blocked it. Meanwhile, another study examined that hyperactivity of mitophagy in sensory neurons of STZ-induced diabetic mice was a mechanism that induces diabetic neuropathy [10]. These differences might be due to disease progression or cell-specific responses. Although additional causes need to be identified, regulating mitophagy plays an important role in suppressing diabetes-induced neuronal mitochondrial dysfunction. NaB has been shown to exhibit protective effects against diseases through the regulation of autophagy [47–49]. In particular, NaB resumed mitophagy by recovering the protein levels of PRKN [25] and by normalizing PRKN recruitment to damaged mitochondria [26]. However, no studies have identified the effects and related mechanisms of NaB on mitophagy in neuronal cells and tissues. We found, for the first time, that NaB mitigated the dysfunction of neuronal mitophagy induced by high glucose through recovering PRKN protein and mRNA levels. NaB also restored suppressed mitophagy in the hippocampus of STZ-induced diabetic mice. Moreover, both PRKN overexpression and NaB treatment reversed the high glucose-inhibited mitophagy. This indicates that NaB is a promising substance for restoring the impairment of neuronal mitochondrial clearance caused by diabetes via restoring PRKN-mediated mitophagy.
Despite the fact that NaB has mitophagy-regulating effects [25,26], the detailed molecular and cellular mechanisms underlying its effects on neurons have not been thoroughly investigated. NaB regulates cellular function through GPCRs that are mainly expressed in neurons, or enter the cytoplasm through SLC5A8 to directly affect neurons [50]. We showed that SLC5A8, but not GPCRs, was involved in the protective effect of NaB against high glucose-reduced PRKN and suppressed neuronal mitophagy. The different contributions of GPCRs and SLC5A8 to PRKN regulation may rely on the preferentially involved mechanisms. After entering the cytosol via SLC5A8, NaB affects neurons either by inhibiting the ROS-mediated signaling pathway or by directly inhibiting HDACs [51]. Indeed, given that the antioxidative effect of NaB inhibits RELA [19,32], which can regulate PRKN expression [52] and is considered a major factor in the pathogenesis of diabetes [32] our data showed that high glucose-induced nuclear translocation of RELA was inhibited by both ROS scavenger and NaB treatment. Moreover, RELA silencing restored the high glucose-reduced PRKN protein levels. As putative co-repressors of RELA, HDACs modulate epigenetic repression in diabetes[34]. Our results showed that the high glucose-induced decrease in PRKN protein levels was caused by HDAC class I but not class IIa. Other HDAC classes, such as HDAC5 and SIRT1, have been involved in the pathogenesis of diabetic neuropathy [53,54], so they might affect PRKN protein levels under high glucose conditions. However, given our results that high glucose-decreased PRKN and suppressed mitophagy were restored by NaB, and that NaB mainly inhibited HDAC class I and class IIa[38], our experiments targeting HDAC class I were reasonable. We found that there were no significant changes in the mRNA or protein levels of class I HDACs under high glucose conditions. Interestingly, only HDAC8 silencing in class I HDACs regulated PRKN mRNA and protein levels. On the other hand, NaB inhibited the activities of HDAC1 and HDAC3 and decreased the mRNA expression of HDAC2 and HDAC8 [55–58]; however, no previous study has investigated the regulation of specific subtypes of HDAC classes in neurons by NaB. Our data showed that high glucose activates HDAC8 in the nucleus by inhibiting PRKAA-mediated phosphorylation. In contrast, NaB did not affect HDAC8 phosphorylation, but inhibited high glucose-activated HDAC8, suggesting that NaB directly inhibits HDAC8. Taken together, our data demonstrated that NaB entering the cytosol via SLC5A8 blocked the nuclear translocation of RELA, directly inhibiting HDAC8 in the nucleus, thus restoring high glucose-reduced PRKN.
HDACs are drawn to DNA by transcription factor protein complexes because they lack inherent DNA-binding abilities [59]. Nuclear RELA interacts with transcriptional co-regulatory proteins to regulate transcription at multiple steps [33,60]. Thus, the importance of HDACs in the regulation of RELA activity associated with transcriptional repression has been studied [31]. In particular, HDAC1 and HDAC2 interact with RELA to negatively regulate gene expression [61]. Although a previous study reported a correlation between HDAC8 expression and RELA immunoreactivity [62], no studies have investigated their interaction. Our data showed that high glucose-induced HDAC8 interaction with RELA in the nucleus and binding to the PRKN promoter, thereby downregulating PRKN expression. Given that lysine acetylation enhances RELA DNA-binding activity and prevents nuclear export of the RELA complex [63], HDAC8 may not have induced lysine deacetylation of RELA under our experimental conditions, since we found that high glucose increased the nuclear translocation of RELA and its binding to the PRKN promoter. Moreover, other studies have shown that HDAC-interacting RELA inhibits the transcriptional activity of other transcription factors [64]; however, through interaction with HDAC8, we suggest that RELA acts as an active repressor of PRKN expression rather than a transrepressor. We showed that both RELA and HDAC8 are required for high glucose-induced PRKN repression, considering our results of increased RELA binding to the PRKN promoter despite histone H3 deacetylation-mediated chromatin condensation of the PRKN promoter. In addition, examining our data of high glucose-reduced PRKN was reversed by silencing RELA and HDAC8, respectively, we clarified that both HDAC8 and RELA are required for PRKN downregulation under high glucose conditions. Subsequently, we demonstrated for the first time the underlying molecular mechanism by which NaB restores PRKN levels by inhibiting the RELA-HDAC8 complex. Moreover, HDAC8 overexpression blocked NaB-restored mitophagy dysfunction, disruption of the mitochondrial membrane potential, and apoptosis under high glucose conditions, indicating that HDAC8 may be a key factor in NaB-mediated mitophagy enhancement.
Studies on the protective effect of NaB on neurological disorders revealed that either intraperitoneal or subcutaneous butyrate administration at supraphysiological levels prevented neuronal damage [65,66], but using these methods may not translate into gut microbiome-derived butyrate. Our results showed that oral administration of NaB restored hippocampal PRKN protein levels, which alleviated mitophagy impairment and consequently reduced mitochondrial oxidative stress. In addition, NaB prevented neuronal apoptosis and improved cognitive impairment in STZ-induced diabetic mice, proving that gut-derived butyrate has a neuronal protective effect. Other experiments in which butyrate-producing bacteria were fed also had the effect of improving cognitive impairment [13,67,68], and this may have an advantage in that it is a more fundamental treatment method than NaB administration. However, considering that certain butyrate-producing bacteria can have a negative effect on disease pathogenesis [69] and that there may be differences in specifying the bacteria, we believe it is better to administer NaB itself. Collectively, our results demonstrated that high glucose suppressed neuronal mitophagy via RELA-HDAC8 complex-mediated PRKN downregulation, leading to mitochondrial dysfunction, neuronal apoptosis, and cognitive impairment; NaB restores this by blocking nuclear translocation of RELA and directly inhibiting HDAC8 in the nucleus (Figure 7I). Thus, our study elucidated the specific mechanism of butyrate-mediated mitophagy regulation and presents butyrate as a potential therapeutic candidate for diabetes-associated cognitive impairment.
Materials and methods
Materials
The iPSCs and SH-SY5Ys were acquired from the National Stem Cell Bank of Korea and Korean Cell Line Bank (KSCBi005-A and KCLB-22266). Antibiotics (15240096) and FBS (SV30207.02) were purchased from Hyclone. RNA laterTM solution was obtained from Thermo Fisher (AM7021). Paraformaldehyde (LGB-1175) was purchased from Lugen. Sodium acetate was purchased from FUJIFILM Wako Pure Chemical Corporation. TOMM20 (ab56783) and PRKN (ab77924) were obtained from abcam. HDAC8 (A5829), p-HDAC8 (AP0360) and Ac-H3 (A22054) were purchased from AB clonal. HDAC1 (5356), HDAC2 (5113), HDAC3 (3949), PRKAA (2532S), and cleaved-CASP3 (9661S) were acquired from Cell Signaling Technology. CALCOCO2/NDP52 (NBP2–19499), OPTN (NBP1–84682), BNIP3 (NBP1–77683), BNIP3L (NBPI-88558), PINK1 (BC100–494), and MAP1LC3B (NB100–2220) were purchased from Novus Biologicals. MFN1 (sc -166,644), p-PRKAA (Thr172) (sc -33,524), ACTB (sc -47778), and UB (sc-8017) were obtained from Santa Cruz Biotechnology. 8-Hydroxy-2-deoxyguanosine (bs-1278 R) and 4-hydroxy-2-noneal (bs-6313 R) were obtained from Bioss. Secondary antibodies for anti-rabbit Alexa Fluor 488 (A32731), anti-mouse Alex Fluor 555 (A32727) were obtained from Thermo Fisher Scientific. N-acetyl cysteine (NAC; A7250), bafilomycin A1 (B1793), D-glucose (G8769), normal goat serum (NGS; 566380), DAPI (D9542), streptozotocin (S0130), sodium propionate (P1880), sodium butyrate (B5887; for cell 303,410; for animal), butyric acid (B103500), acrylic acid (8.00181), m-phosphoric acid (100546), propyl formate (W294306), Triton X-100 (T8787), ibuprofen (I4883), PTX (P7208) and carbonyl cyanide m-chlorophenyl hydrazone (CCCP; 215911) were purchased from Sigma Chemical Company. TC-H 106 (HY-19348), PCI 34,051 (HY-15224), and TMP269 (HY-18360) were purchased from MedChemExpress. Vector for mt-Keima (AM-V0251) and mt-Keima-Red-PRKN (AM-V0259M) were purchased from MBL. The plasmids for pcDNA3.1(+)-HDAC8-C-GFP and pcDNA3.1(+)-C-GFP were manufactured by Koma Biotech. A gene encoding full-length HDAC8 (Uniprot: Q9BY41) with a C-terminal GFP tag was synthesized and cloned into a pcDNA3.1(+) vector. mRNA primers for PINK1, PRKN, OPTN, CALCOCO2, HDAC1, HDAC2, HDAC3, HDAC8, and ACTB were purchased from Cosmo Genetech. HDAC1, HDAC2, HDAC3, HDAC8, RELA, and NT siRNA were acquired from Bioneer.
Cell culture
Undifferentiated SH-SY5Y cells were cultured in Dulbecco’s modified eagle medium (DMEM) low-glucose, supplemented with a 1% antibiotic-antimycotics solution and 10% FBS. Cells were grown in 35-mm, 60-mm and 100-mm culture dishes, or a 6-well plate in an incubator (37°C, CO2 5%, and air 95%). When the cells reached 60–70% confluency, the culture medium was replaced with serum-free low-glucose DMEM containing 1% antibiotic-antimycotic combination for 24 h for starvation. Neuronal stem cells (NSCs) were cultured on plates coated with geltrex LDEV-Free (Thermo Fisher, A1413302) in the presence of Neurobasal Medium (Thermo Fisher 21103049) and Advanced DMEM/F12 (Thermo Fisher 12634028). For neural differentiation, NSCs were re-cultured on dishes covered with poly-L-ornithine (Sigma, P3655) and laminin (Thermo Fisher 23017), cultured in neural differentiation media for more than 10 days (Neurobasal medium supplemented with 2% B27 serum-free supplement [Thermo Fisher 17,504] and 1% GlutaMax-1 supplement [Thermo Fisher 35050]). After incubation, the cells were incubated for the designated treatment time. The cells were exposed to 25 mM D-glucose to mimic diabetic conditions [3].
Reverse transcription-polymerase chain reaction (RT-PCR)
RNA samples were extracted using an RNA Extraction kit (TaKaRa, 9767) according to the manufacturer’s instructions. Reverse transcription was performed using 1 μg of RNA and a Maxime™ RT-PCR premix kit (iNtRON 25081) for 1 h at 45°C followed by 5 min at 95°C to obtain cDNA. The cDNA samples were then amplified using Using a Rotor-Gene 6000 real-time system (Corbett Research), TB™ Green Premix Ex Taq™ (TaKaRa, RR420A), and mRNA primers (Table S1). qPCR was performed, data were collected during the extension step, and melting curve analysis was validated to verify the specificity and identity of the PCR products. ΔCt analysis was used to quantify mRNA expression and normalization of gene expression by using the ACTB gene as a control.
Western blot analysis
Cells were washed once with cold PBS (WelGene, LB 001–02) harvested by using a cell scraper and gathered by centrifugation (16,000 g, 4°C, 5 min). Harvested cells and brain tissues were lysed by RIPA buffer (ATTO Corporation, WSE-7420) containing cocktail of inhibitors of phosphatase and protease (100×) (Thermo Fisher 78440) with a vortex and sonicator for 30 min on ice. The lysates were then cleared by centrifugation (16,000 g, 4°C, 20 min). The protein concentration was measured by the bicinchoninic acid (BCA) assay kit (Bio-Rad 23227). Samples containing equal amounts of protein were prepared for 8–12% sodium dodecyl sulfate-polyacrylamide gel electrophoresis/SDS-PAGE and then transferred to a polyvinylidene fluoride/PVDF membrane and blocked with 5% skim milk (Gibco 232100) dissolved in Tris-buffered saline (TBST; 10 mM Tris-HCl, pH 7.6, 0.2% Tween-20 [Sigma, 9005–64], 150 mM NaCl) for 30 min. The blocked membranes were washed with TBST and incubated with primary antibody overnight at 4°C. The membranes were subsequently washed and incubated with HRP-conjugated secondary antibody at room temperature for 2 h. The western blotting bands were visualized by means of chemiluminescence (Bio-Rad 1705061). Specific bands were detected using a ChemiDoc™ XRS+System (Bio-Rad) and analyzed by using ImageJ software.
Chromatin immunoprecipitation (ChIP) assay
ChIP assay was performed using EpiQuik™ Chromatin Immunoprecipitation Kit (Epigentek, p-2002) according to the manufacturer’s instructions, antibodies for RELA, HDAC8, Ac-H3, normal IgG, and the RNA polymerase was bound to the assay plate for 90 min. Normal IgG was used as negative control and RNA polymerase was a positive control. Samples were extracted and measured the protein enrichment at the PRKN promoter region by amplified with quantitative real-time PCR using a designed primer. The sequences of PRKN primer are as follows: forward primer, 5′-ATT CTA ACA ACC TAG CCT GCC C-3′ and reverse primer, 5′-TTG TTG CAG CTC TAG CCA AG-3′. One percent of the sample chromatin extract was used as an input.
Flow cytometry analysis
TMRE (200 nM; Sigma Chemical Company 87917) was used to measure mitochondrial membrane potential, and MitoSOXTM (5 μM; Thermo Fisher Scientific, M36008) for mtROS. MitoTracker Green (200 μM; Thermo Fisher Scientific, M7514) was used to analyzed mitochondrial mass. The cell incubation time of each reagent was decided by the manufacturer’s instructions. Cells were collected by trypsinization and washed twice then analyzed using a flow cytometry and analyzed with CytExpert 2.3 software. The results were obtained by comparing the percentage of cells with the control and non-stained cells or single stained cells were counted for negative control.
DNA extraction and mtDNA content (damage) assay
Using AccuPrep® Genomic DNA extraction kit (Bioneer Corporation, K-3032), DNA samples were extracted according to the manufacturer’s instruction. After, mtDNA and nDNA levels were evaluated by real-time PCR. The Rpl13 gene was used as targeting nDNA and the mitochondrial-DNA encoded gene mt-Atp6 was used as targeting mtDNA. mtDNA normalized to nDNA was quantified. Primer sequences of mtDNA and nDNA were obtained from a previous study [70].
ANXA5/annexinV-PI staining apoptosis detection
AnnexinV-FITC apoptosis detection kit (BD Biosciences 556547) was used toperform ANXA5-PI staining. Following the manufacturer’s instructions, SH-SY5Y cells were trypsinized and suspended in binding buffer. Then 5 μl ANXA5 and 5 μl of PI were added to the samples and incubated for 15 min at room temperature. With the flow cytometry (Quanta SC; Beckman Coulter), apoptosis of the samples was detected, and data were analyzed by CytExpert 2.3 software provided from Beckman Coulter. ANXA5-negative and PI-negative cells (Q3) were considered viable, and ANXA5-negative with PI-positive cells (Q1) were considered necrosis. ANXA5-positive with PI-positive (Q2) or PI-negative cells (Q4) were considered early and late apoptosis respectively. The percentage of apoptotic cells was followed by the next formula: Apoptotic cells=Q2+Q4.
siRNA transfection
SH-SY5Y cells were grown until approximately 50–60% confluency of the plate then incubated with the mixture of the transfection reagent TurboFect (Thermo Fisher, R0531) and 25 nM of indicated siRNAs for 24 h without antibiotics. nontargeting (NT) siRNA was used as a control.The medium was changed to serum-free low-glucose DMEM with antibiotics and after, drug was treated.
Transfection of plasmid DNA
After reaching 80% confluence, the SH-SY5Ys were incubated with a mixture of plasmid DNA, opti-MEM (Gibco 31985062), and Lipofectamine 2000 (Thermo Fisher 11668027). The cells were incubated in the fresh serum-free medium prior to experiments. pcDNA3.1-GFP plasmid was used as a negative control. The cells were transfected before being exposed to NaB and high glucose.
HDAC8 activity fluorometric assay
HDAC8 activity fluorometric assay was performed in compliance with the manufacturer’s protocol (BioVision, K348–100). Briefly, harvested cells were used to extract the nucleus by proper lysis buffer, and an equal amount of lysate was loaded into a 96-well plate with reaction buffer for 10 min, substrates for 60 min, and developer 5 min at 37°C. Fluorescence intensities were read by a fluorometer equipped with an Ex/Em = 380/500 nm filter.
Chromatin accessibility assay
Chromatin accessibility assay was performed in compliance with the manufacturer’s protocol (Epigentek, p-1047). Briefly, the trypsinized cell was centrifuged for 5 min at 100 g and washed with PBS once. Cells were lysed by proper lysis buffer for chromatin extraction. After the extraction, a digestion buffer was used and DNA was extracted. qPCR was used to analyze whether the gene region in the opened chromatin (>1600% compared to the Nse-treated samples) or closed (<400% compared to the Nse-treated samples).
Immunocytochemistry
SH-SY5Y cells were fixed with 4% paraformaldehyde for 10 min and then permeabilized with 0.1% Triton X-100 for 5 min and blocked with 5%NGS for 1 h. Cells were incubated in PBS containing 5% NGS for overnightat 4°C with primary antibodies (1:300 dilution) and washed with PBS three times. Cells were incubated with Alexa Fluor 488 or 555-conjugated secondary antibodies in PBS (1:100 dilution) for 2 h at room temperature in dark. Stained samples were visualized by a super-resolution radial fluctuation (SRRF) imaging system (AndorTechnology, Belfast, UK). Analysis of colocalization was performed by measuring Pearson’s correlation coefficient using Fiji 1.53 software.
In situ proximity ligation assay
In situ using Duolink II secondary antibodies and detection kits (Sigma, DUO92001, DUO92005, and DUO92008) were used to detect RELA-HDAC8 interactions according to the supplier’s protocols. Cells were fixed with 4% paraformaldehyde and blocked with 5% FBS in 0.1%Tween-20. RELA, HDAC8 antibodies, and PLA probe were applied, then secondary antibodies were added. DAPI was used to define the nuclei and visualized by SRRF microscopy. Polymerization and amplification solutions were supplemented to amplify the signal (red), which implies antibodies were closely in proximity and ligated together(<40 nm).
Experimental design of animal study
Male ICR mice were used to investigate the effects of NaB on diabetic hippocampal mitochondria accumulations, mitophagy impairment, and cognitive impairment. Animal handling and experimentation were compliant and approved by the Institutional Animal Care and Use Committee of Seoul National University (IACUC, Approval No.: SNU-210216-2-1). Mice (9 weeks of age) were housed under standard conditions of temperature (20–25°C), humidity (less than 60%), and a 12 h dark/12 h light cycle and free to access autoclaved chow and tap water. Group size estimation was performed in compliance with the instructions given by IACUC (effect size: 15%, standard deviation [SD]: 6%, number of groups: 4; alpha: 0.05, power [1-β]: 0.8). STZ was injected into mice to induce diabetes, as previously described[3]. Mice were randomized to receive STZ (75 mg/kg in 0.1 M sodium citrate buffer, pH 4.5) or vehicle (0.1 M sodium citrate buffer, pH4.5) intraperitoneally (i.p.) once daily for three days after 12 h of fasting. The blood glucose level was measured 1 week after the STZ injection, using a glucose monitor (Roche, B07Z9N65F8). When the blood glucose level was 300 mg/dl or higher, severe diabetes was determined. Mice were separated into 4 groups at random (n = 5 per group): vehicle, STZ, NaB, and STZ+NaB. NaB (0.5 g/kg in filtered tab water) was orally administrated by gavage once daily for 8 weeks following diabetes induction, as previously reported with slight modifications[71,72]. At 18 weeks of age, body weight and blood glucose levels were measured followed by behavioral tests. For additional biochemical analysis, mice were anesthetized by i.p. injection of avertin solution (250 mg/kg, a mixture containing 2-methyl-2-butanol [Sigma Aldrich 152,463] and 2,2,2-tribromoethanol [Sigma Aldrich, T48402]) and euthanized by exsanguination.
Immunohistochemistry
Mice underwent deep anesthesia with an avertin solution followed by transcardially perfused with PBS and fixed in 4% paraformaldehyde. The removed brain hemispheres were post-fixed for 2 h in 4% paraformaldehyde and subsequently dehydrated in 30% sucrose (Sigma, 57–50–1) in PBS for 1–2 days at 4°C. Coronal sections of the hippocampus (40-μm thick) were acquired by continuous cutting with a cryostat (Leica Biosystems). To stain hippocampus, we used Free-floating method[3]. The brain sections were incubated with 5% NGS dissolved in 0.1% Triton X-100 at room temperature for 1 h. Samples were incubated with primary antibodies for 2 days at 4°C and then followed by secondary antibodies for 2 h at room temperature. Completed samples were visualized by the confocal microscope system (Carl Zeiss, LSM 710). Because the CA3 region has specific role in memory processes, and neurodegeneration[73], the region of interest was set to analyze the CA3 region. The fluorescent intensity was calculated by applying an equal threshold to subtract background noise and dividing the intensity-grayscale average by the area. Acquirement of Pearson’s correlation coefficient values and intensity were undertaken using Fiji software.
GC-MS analysis and plasma sample preparation
Sample preparation procedures were performed by the previous report[19]. The internal standard solution (150 µM acrylic acid, 1500 µM m-phosphoric acid) was added to 200 µl plasma, vortexed for 5 min followed by centrifugation (30 min 20,000 g) and solidified for 30 min at 4°C. Clear supernatant was transferred into a new tube and added 100 µl propyl formate. After, samples were vortexed for 5 min followed by centrifugation at 20,000 g for 10 min, 50 µl of the organic layer was transferred into GC vials (Waters,186001127) for analysis. Helium (1 ml/min) was used as carrier gasin TR-FAME (25 m × 0.32 mm × 0.25 µm) and samples were injected into a 200°C straight glass liner. The initial oven temperature of 60°C was maintained for 4 min, then increased upto 130°C by 50°C/min speed and held for 3.7 min, then raised to 240°C at 30°C/min speed and held for 10 min. The transfer lineand ion source temperature were 250°C. Trace 1300 Series gas chromatograph with TSQ Series mass spectrometer (Thermo Fisher) was used and integrations were performed automatically with Triplus RSH autosampler (Thermo Fisher). Blanks, standards, and samples were analyzed randomly at the GC – MS system.
Metagenomic analysis
Mouse fecal samples were stored in RNA laterTMsolution at − 80°C until processing. DNA extractions for 16 SrRNA analysis were performed by using Fast DNA® SPIN Kit for Soil (MPBiomedicals,116560200-CF) based on manufacturer’s recommendations. The bacterial 16 S rRNA V3-V4 region was amplified in accordance with the Illumina adapter sequences of the paired-end reads were removed using Cutadapt version 2.2[74]. Then, the trimmed sequences were processed using QIIME2 version 2020. 8. Briefly, the reads were assigned toeach sample according to a unique index; pairs of reads from theoriginal DNA fragments were merged using an import tool in QIIME2[75]. Quality control and trimming were performed to yield sequences with lengths of 270 and 210 bp for the forward and reverse reads, respectively. To remove low-quality bases at the end of the reads, the DADA2 software package wrapped in QIIME2 was applied[76]. To remove chimeras from the FASTQ files, a consensus method implemented in DADA2 was used. α and β diversity were analyzed using core-metrics-phylogenetic in the QIIME2 diversity plugin. α-and β-diversities were calculated using α-and β-group-significance in the QIIME2 diversity plugin, respectively. α diversity was calculated by evenness, faith-PD, observed features, and Shannon Index and β diversity was compared by principal coordinate analysis using Bray-Curtis distances and Weighted Uni-Frac. Significance of similarity among the groups was evaluated using permutational multivariate analysis of variance (PERMANOVA) with 999 permutations. Taxonomic annotation was performedby mapping the training reference set with primers (forward,5′-CCTACGGGNGGCWGCAG-3′; reverse, 5′-GACTACHVGGGTATCTAATCC-3′) and extracting the V3–V4 region using GreenGenes version 13_8 4[77].
Y-maze spontaneous alternation test
To reduce stress before the test, animals were acclimatized to the testing chamber for 2 h. Y-maze was used to determine hippocampal-dependent spatial learning and memory, as mice spontaneously explore the new arms of the maze. Each mouse was placed on a different arm of the Y-maze equipment at random (GaonBio, 76–0079) and had 10 min to explore the maze at will. Four limbs have to be in the arm for entry to be considered complete. We divide the number of triads by the maximum alternation (total entries-2) of 100 to obtain the percentage of spontaneous alternation. An animal’s ability to learn and remember spatial information is impaired when its alternation % is low.
Novel object recognition test (NOR)
The novel object recognition test, which relies on mice’s intrinsic desire for novelty, is frequently used as a behavioral test for assessing object working memory. For habituation, the mice were housed in an open-field box in the testing chamber for 4 h. On the next day, the mice were given with two similar objects from the first session and were free to move around for 10 min. After 4 h one of the two objects were changed. The mouse was then given a second chance to explore freely for 10 min in the open field. The time spent exploring a new object minus the time spent examining a familiar object was divided from the total exploration time to generate the discrimination index, which is used to evaluate cognition. The novelty preference was determined as the proportion of total exploration time spent on novel objects. A decrease in the discrimination index indicates impairment of object working memory.
Open field test
The mice were kept in the testing room for 2 h before a test to reduce stress. Because they navigate around the open field when they feel anxious, the open-field test is used to assess anxiety in rodents. Mice were put into rectangular plastic boxes (H30 × L30 × W30 cm) and their activities were monitored for 10 min. The amount of time spent in the open field’s center and periphery was examined using Smart 3.0 video tracking system.
Statistical analysis
The sample size n refers to the number of biologically independent replicates and is used for statistical analysis. Using the Prism 8 analysis program (GraphPad), quantitative data were expressed as mean± standard error of mean (SEM). An unpaired Student’s t-test with two-tailed was performed to compare the means of two groups. One-way or two-way ANOVA followed by Tukey’s multiple comparisons test for multiple comparisons was used to compare the differences between various groups. A level of probability of p < 0.05 was considered statistically significant.
Abbreviations
- BNIP3
BCL2 interacting protein 3
- BNIP3L/NIX
BCL2 interacting protein 3 like
- CALCOCO2/NDP52
calcium binding and coiled-coil domain 2
- FUNDC1
FUN14 domain containing 1
- HDAC
histone deacetylase
- iPSC-NDs
induced pluripotent stem cell-derived neuronal differentiated cells
- MAP1LC3B/LC3B
microtubule associated protein 1 light chain 3 β
- mt-Keima
mitochondria-targeted Keima
- NaB
Sodium butyrate
- PINK1
PTEN induced kinase 1
- PRKAA/AMPKα
protein kinase AMP-activated catalytic subunit α
- PRKN/Parkin
parkin RBR E3 ubiquitin protein ligase
- RELA/p65
RELA proto-oncogene, NF-kB subunit
- ROS
reactive oxygen species
- SCFAs
short-chain fatty acids
- STZ
streptozotocin
- TOMM20
translocase of outer mitochondrial membrane 20
Supplementary Material
Funding Statement
This work was supported by the National Research Foundation of Korea (NRF) grant funded by the Korea government (MSIT) (RS-2023-00208475) and BK21 FOUR Future Veterinary Medicine Leading Education & Research Center.
Disclosure statement
No potential conflict of interest was reported by the author(s).
Supplementary material
Supplemental data for this article can be accessed online at https://doi.org/10.1080/15548627.2024.2323785
References
- [1].Onphachanh X, Lee HJ, Lim JR, et al. Enhancement of high glucose-induced PINK1 expression by melatonin stimulates neuronal cell survival: involvement of MT2/Akt/NF-κB pathway. J Pineal Res. 2017;63(2):63. doi: 10.1111/jpi.12427 [DOI] [PubMed] [Google Scholar]
- [2].Wilson DM 3rd, Cookson MR, Van Den Bosch L, et al. Hallmarks of neurodegenerative diseases. Cell. 2023;186(4):693–714. doi: 10.1016/j.cell.2022.12.032 [DOI] [PubMed] [Google Scholar]
- [3].Chae CW, Yoon JH, Lim JR, et al. TRIM16-mediated lysophagy suppresses high-glucose-accumulated neuronal Aβ. Autophagy. 2023;19(10):2752–2768. doi: 10.1080/15548627.2023.2229659 [DOI] [PMC free article] [PubMed] [Google Scholar]
- [4].Li Q, Zhao Y, Guo H, et al. Impaired lipophagy induced-microglial lipid droplets accumulation contributes to the buildup of TREM1 in diabetes-associated cognitive impairment. Autophagy. 2023;19(10):2639–2656. doi: 10.1080/15548627.2023.2213984 [DOI] [PMC free article] [PubMed] [Google Scholar]
- [5].Palikaras K, Lionaki E, Tavernarakis N.. Mechanisms of mitophagy in cellular homeostasis, physiology and pathology. Nat Cell Biol. 2018;20(9):1013–1022. doi: 10.1038/s41556-018-0176-2 [DOI] [PubMed] [Google Scholar]
- [6].Shan Z, Fa WH, Tian CR, et al. Mitophagy and mitochondrial dynamics in type 2 diabetes mellitus treatment. Aging (Albany NY). 2022;14(6):2902–2919. doi: 10.18632/aging.203969 [DOI] [PMC free article] [PubMed] [Google Scholar]
- [7].Wang Y, Liu N, Lu B. Mechanisms and roles of mitophagy in neurodegenerative diseases. CNS Neurosci Ther. 2019;25(7):859–875. doi: 10.1111/cns.13140 [DOI] [PMC free article] [PubMed] [Google Scholar]
- [8].Xiang J, Zhang C, Di T, et al. Salvianolic acid B alleviates diabetic endothelial and mitochondrial dysfunction by down-regulating apoptosis and mitophagy of endothelial cells. Bioengineered. 2022;13(2):3486–3502. doi: 10.1080/21655979.2022.2026552 [DOI] [PMC free article] [PubMed] [Google Scholar]
- [9].Ma F, Li H, Huo H, et al. N-acetyl-L-cysteine alleviates FUNDC1-mediated mitophagy by regulating mitochondrial dynamics in type 1 diabetic nephropathy canine. Life Sci. 2023;313:121278. doi: 10.1016/j.lfs.2022.121278 [DOI] [PubMed] [Google Scholar]
- [10].Rodriguez YA, Kaur S, Nolte E, et al. Novologue therapy requires heat shock protein 70 and thioredoxin-interacting protein to improve mitochondrial bioenergetics and decrease mitophagy in diabetic sensory neurons. ACS Chem Neurosci. 2021;12(16):3049–3059. doi: 10.1021/acschemneuro.1c00340 [DOI] [PMC free article] [PubMed] [Google Scholar]
- [11].Tong M, Saito T, Zhai P, et al. Mitophagy is essential for maintaining cardiac function during high fat diet-induced diabetic cardiomyopathy. Circ Res. 2019;124(9):1360–1371. doi: 10.1161/CIRCRESAHA.118.314607 [DOI] [PMC free article] [PubMed] [Google Scholar]
- [12].Yuan P, Song F, Zhu P, et al. Poly (ADP-ribose) polymerase 1-mediated defective mitophagy contributes to painful diabetic neuropathy in the db/db model. J Neurochem. 2022;162(3):276–289. doi: 10.1111/jnc.15606 [DOI] [PubMed] [Google Scholar]
- [13].Yuan X, Wang R, Han B, et al. Functional and metabolic alterations of gut microbiota in children with new-onset type 1 diabetes. Nat Commun. 2022;13(1):6356. doi: 10.1038/s41467-022-33656-4 [DOI] [PMC free article] [PubMed] [Google Scholar]
- [14].Liang X, Fu Y, Cao WT, et al. Gut microbiome, cognitive function and brain structure: a multi-omics integration analysis. Transl Neurodegener. 2022;11(1):49. doi: 10.1186/s40035-022-00323-z [DOI] [PMC free article] [PubMed] [Google Scholar]
- [15].Yadav S, Dwivedi A, Tripathi A, et al. Therapeutic potential of short-chain fatty acid production by gut microbiota in neurodegenerative disorders. Nutr Res. 2022;106:72–84. doi: 10.1016/j.nutres.2022.07.007 [DOI] [PubMed] [Google Scholar]
- [16].Arora T, Tremaroli V. Therapeutic potential of butyrate for treatment of type 2 diabetes. Front Endocrinol. 2021;12:761834. doi: 10.3389/fendo.2021.761834 [DOI] [PMC free article] [PubMed] [Google Scholar]
- [17].den Besten G, van Eunen K, Groen AK, et al. The role of short-chain fatty acids in the interplay between diet, gut microbiota, and host energy metabolism. J Lipid Res. 2013;54(9):2325–2340. doi: 10.1194/jlr.R036012 [DOI] [PMC free article] [PubMed] [Google Scholar]
- [18].Hu S, Kuwabara R, de Haan BJ, et al. Acetate and butyrate improve β-cell metabolism and mitochondrial respiration under oxidative stress. Int J Mol Sci. 2020;21(4):21. doi: 10.3390/ijms21041542 [DOI] [PMC free article] [PubMed] [Google Scholar]
- [19].Kim SY, Chae CW, Lee HJ, et al. Sodium butyrate inhibits high cholesterol-induced neuronal amyloidogenesis by modulating NRF2 stabilization-mediated ROS levels: involvement of NOX2 and SOD1. Cell Death Dis. 2020;11(6):469. doi: 10.1038/s41419-020-2663-1 [DOI] [PMC free article] [PubMed] [Google Scholar]
- [20].Cheng Y, Mai Q, Zeng X, et al. Propionate relieves pentylenetetrazol-induced seizures, consequent mitochondrial disruption, neuron necrosis and neurological deficits in mice. Biochem Pharmacol. 2019;169:113607. doi: 10.1016/j.bcp.2019.08.009 [DOI] [PubMed] [Google Scholar]
- [21].Jaworska J, Zalewska T, Sypecka J, et al. Effect of the HDAC inhibitor, sodium butyrate, on neurogenesis in a rat model of neonatal hypoxia–ischemia: potential mechanism of action. Mol Neurobiol. 2019;56(9):6341–6370. doi: 10.1007/s12035-019-1518-1 [DOI] [PMC free article] [PubMed] [Google Scholar]
- [22].Erny D, Dokalis N, Mezö C, et al. Microbiota-derived acetate enables the metabolic fitness of the brain innate immune system during health and disease. Cell Metab. 2021;33(11):2260–76.e7. doi: 10.1016/j.cmet.2021.10.010 [DOI] [PubMed] [Google Scholar]
- [23].Uittenbogaard M, Brantner CA, Chiaramello A. Epigenetic modifiers promote mitochondrial biogenesis and oxidative metabolism leading to enhanced differentiation of neuroprogenitor cells. Cell Death Dis. 2018;9(3):360. doi: 10.1038/s41419-018-0396-1 [DOI] [PMC free article] [PubMed] [Google Scholar]
- [24].Rose S, Bennuri SC, Davis JE, et al. Butyrate enhances mitochondrial function during oxidative stress in cell lines from boys with autism. Transl Psychiatry. 2018;8(1):42. doi: 10.1038/s41398-017-0089-z [DOI] [PMC free article] [PubMed] [Google Scholar]
- [25].Li X, Wang C, Zhu J, et al. Sodium butyrate ameliorates oxidative stress-induced intestinal epithelium barrier injury and mitochondrial damage through AMPK-mitophagy pathway. Oxid Med Cell Longev. 2022;2022:3745135. doi: 10.1155/2022/3745135 [DOI] [PMC free article] [PubMed] [Google Scholar]
- [26].Lee JS, Lee GM. Effect of sodium butyrate on autophagy and apoptosis in Chinese hamster ovary cells. Biotechnol Prog. 2012;28(2):349–357. doi: 10.1002/btpr.1512 [DOI] [PubMed] [Google Scholar]
- [27].Jung YH, Chae CW, Choi GE, et al. Cyanidin 3-O-arabinoside suppresses DHT-induced dermal papilla cell senescence by modulating p38-dependent ER-mitochondria contacts. J Biomed Sci. 2022;29(1):1–17. doi: 10.1186/s12929-022-00800-7 [DOI] [PMC free article] [PubMed] [Google Scholar]
- [28].Mishra P, Chan DC. Metabolic regulation of mitochondrial dynamics. J Cell Bio. 2016;212(4):379–387. doi: 10.1083/jcb.201511036 [DOI] [PMC free article] [PubMed] [Google Scholar]
- [29].Redmann M, Benavides GA, Wani WY, et al. Methods for assessing mitochondrial quality control mechanisms and cellular consequences in cell culture. Redox Biol. 2018;17:59–69. doi: 10.1016/j.redox.2018.04.005 [DOI] [PMC free article] [PubMed] [Google Scholar]
- [30].Murillo-González FE, García-Aguilar R, Vega L, et al. Regulation of Parkin expression as the key balance between neural survival and cancer cell death. Biochem Pharmacol. 2021;190:114650. doi: 10.1016/j.bcp.2021.114650 [DOI] [PubMed] [Google Scholar]
- [31].Moreno JA, Izquierdo MC, Sanchez-Nino MD, et al. The inflammatory cytokines TWEAK and TNFα reduce renal klotho expression through NFκB. J Am Soc Nephrol. 2011;22(7):1315–1325. doi: 10.1681/ASN.2010101073 [DOI] [PMC free article] [PubMed] [Google Scholar]
- [32].Chae CW, Choi GE, Jung YH, et al. High glucose-mediated VPS26a down-regulation dysregulates neuronal amyloid precursor protein processing and tau phosphorylation. Br J Pharmacol. 2022;179(15):3934–3950. doi: 10.1111/bph.15836 [DOI] [PubMed] [Google Scholar]
- [33].Kaikkonen MU, Spann NJ, Heinz S, et al. Remodeling of the enhancer landscape during macrophage activation is coupled to enhancer transcription. Mol Cell. 2013;51(3):310–325. doi: 10.1016/j.molcel.2013.07.010 [DOI] [PMC free article] [PubMed] [Google Scholar]
- [34].Kato M, Natarajan R. Epigenetics and epigenomics in diabetic kidney disease and metabolic memory. Nat Rev Nephrol. 2019;15(6):327–345. doi: 10.1038/s41581-019-0135-6 [DOI] [PMC free article] [PubMed] [Google Scholar]
- [35].Lee H, Rezai-Zadeh N, Seto E. Negative regulation of histone deacetylase 8 activity by cyclic AMP-dependent protein kinase a. Mol Cell Biol. 2004;24(2):765–773. doi: 10.1128/MCB.24.2.765-773.2004 [DOI] [PMC free article] [PubMed] [Google Scholar]
- [36].Li Y, Liang R, Sun M, et al. AMPK-dependent phosphorylation of HDAC8 triggers PGM1 expression to promote lung cancer cell survival under glucose starvation. Cancer Lett. 2020;478:82–92. doi: 10.1016/j.canlet.2020.03.007 [DOI] [PubMed] [Google Scholar]
- [37].Steinberg GR, Carling D. AMP-activated protein kinase: the current landscape for drug development. Nat Rev Drug Discov. 2019;18(7):527–551. doi: 10.1038/s41573-019-0019-2 [DOI] [PubMed] [Google Scholar]
- [38].Yuille S, Reichardt N, Panda S, et al. Human gut bacteria as potent class I histone deacetylase inhibitors in vitro through production of butyric acid and valeric acid. PLoS One. 2018;13(7):e0201073. doi: 10.1371/journal.pone.0201073 [DOI] [PMC free article] [PubMed] [Google Scholar]
- [39].Tran TA, Nguyen AD, Chang J, et al. Lipopolysaccharide and tumor necrosis factor regulate Parkin expression via nuclear factor-κB. PLoS One. 2011;6(8):e23660. doi: 10.1371/journal.pone.0023660 [DOI] [PMC free article] [PubMed] [Google Scholar]
- [40].Adeniyi PA, Gong X, MacGregor E, et al. Ferroptosis of microglia in aging human white matter injury. Ann Neurol. 2023;94(6):1048–1066. doi: 10.1002/ana.26770 [DOI] [PMC free article] [PubMed] [Google Scholar]
- [41].Brown EE, DeWeerd AJ, Ildefonso CJ, et al. Mitochondrial oxidative stress in the retinal pigment epithelium (RPE) led to metabolic dysfunction in both the RPE and retinal photoreceptors. Redox Biol. 2019;24:101201. doi: 10.1016/j.redox.2019.101201 [DOI] [PMC free article] [PubMed] [Google Scholar]
- [42].Chae CW, Lee HJ, Choi GE, et al. High glucose‐mediated PICALM and mTORC1 modulate processing of amyloid precursor protein via endosomal abnormalities. Br J Pharmacol. 2020;177(16):3828–3847. doi: 10.1111/bph.15131 [DOI] [PMC free article] [PubMed] [Google Scholar]
- [43].Siptroth J, Moskalenko O, Krumbiegel C, et al. Variation of butyrate production in the gut microbiome in type 2 diabetes patients. Int Microbiol. 2023;26(3):601–610. doi: 10.1007/s10123-023-00324-6 [DOI] [PMC free article] [PubMed] [Google Scholar]
- [44].Tan AH, Chong CW, Lim SY, et al. Gut microbial ecosystem in Parkinson disease: New Clinicobiological Insights from Multi-Omics. Ann Neurol. 2021;89(3):546–559. doi: 10.1002/ana.25982 [DOI] [PubMed] [Google Scholar]
- [45].Wurster JI, Peterson RL, Brown CE, et al. Streptozotocin-induced hyperglycemia alters the cecal metabolome and exacerbates antibiotic-induced dysbiosis. Cell Rep. 2021;37(11):110113. doi: 10.1016/j.celrep.2021.110113 [DOI] [PMC free article] [PubMed] [Google Scholar]
- [46].Thaiss CA, Levy M, Grosheva I, et al. Hyperglycemia drives intestinal barrier dysfunction and risk for enteric infection. Science. 2018;359(6382):1376–1383. doi: 10.1126/science.aar3318 [DOI] [PubMed] [Google Scholar]
- [47].Donohoe DR, Garge N, Zhang X, et al. The microbiome and butyrate regulate energy metabolism and autophagy in the mammalian colon. Cell Metab. 2011;13(5):517–526. doi: 10.1016/j.cmet.2011.02.018 [DOI] [PMC free article] [PubMed] [Google Scholar]
- [48].Kalkan H, Pagano E, Paris D, et al. Targeting gut dysbiosis against inflammation and impaired autophagy in Duchenne muscular dystrophy. EMBO Mol Med. 2023;15(3):e16225. doi: 10.15252/emmm.202216225 [DOI] [PMC free article] [PubMed] [Google Scholar]
- [49].Qiao CM, Sun MF, Jia XB, et al. Sodium butyrate causes α-synuclein degradation by an Atg5-dependent and PI3K/Akt/mTOR-related autophagy pathway. Exp Cell Res. 2020;387(1):111772. doi: 10.1016/j.yexcr.2019.111772 [DOI] [PubMed] [Google Scholar]
- [50].Vijay N, Morris ME. Role of monocarboxylate transporters in drug delivery to the brain. Curr Pharm Des. 2014;20(10):1487–1498. doi: 10.2174/13816128113199990462 [DOI] [PMC free article] [PubMed] [Google Scholar]
- [51].Zhang L, Liu C, Jiang Q, et al. Butyrate in energy metabolism: there is still more to learn. Trends Endocrinol Metab. 2021;32(3):159–169. doi: 10.1016/j.tem.2020.12.003 [DOI] [PubMed] [Google Scholar]
- [52].Zhao Y, Sun M. Metformin rescues Parkin protein expression and mitophagy in high glucose-challenged human renal epithelial cells by inhibiting NF-κB via PP2A activation. Life Sci. 2020;246:117382. doi: 10.1016/j.lfs.2020.117382 [DOI] [PubMed] [Google Scholar]
- [53].Fan T, Yu Y, Chen Y, et al. Histone deacetylase 5‐induced deficiency of signal transducer and activator of transcription‐3 acetylation contributes to spinal astrocytes degeneration in painful diabetic neuropathy. Glia. 2023;71(4):1099–1119. doi: 10.1002/glia.24328 [DOI] [PubMed] [Google Scholar]
- [54].Pan Q, Gao Z, Zhu C, et al. Overexpression of histone deacetylase SIRT1 exerts an antiangiogenic role in diabetic retinopathy via miR-20a elevation and YAP/HIF1α/VEGFA depletion. Am J Physiol Endocrinol Metab. 2020;319(5):E932–E43. doi: 10.1152/ajpendo.00051.2020 [DOI] [PubMed] [Google Scholar]
- [55].Pan X, Fang X, Wang F, et al. Butyrate ameliorates caerulein‐induced acute pancreatitis and associated intestinal injury by tissue‐specific mechanisms. Br J Pharmacol. 2019;176(23):4446–4461. doi: 10.1111/bph.14806 [DOI] [PMC free article] [PubMed] [Google Scholar]
- [56].Li H, Gao Z, Zhang J, et al. Sodium butyrate stimulates expression of fibroblast growth factor 21 in liver by inhibition of histone deacetylase 3. Diabetes. 2012;61(4):797–806. doi: 10.2337/db11-0846 [DOI] [PMC free article] [PubMed] [Google Scholar]
- [57].Du Y, Tang G, Yuan W. Suppression of HDAC2 by sodium butyrate alleviates apoptosis of kidney cells in db/db mice and HG‑induced NRK‑52E cells. Int J Mol Med. 2020;45:210–222. doi: 10.3892/ijmm.2019.4397 [DOI] [PMC free article] [PubMed] [Google Scholar]
- [58].Forouzesh F, Ghiaghi M, Rahimi H. Effect of sodium butyrate on HDAC8 mRNA expression in colorectal cancer cell lines and molecular docking study of LHX1-sodium butyrate interaction. EXCLI J. 2020;19:1038. doi: 10.17179/excli2020-2010 [DOI] [PMC free article] [PubMed] [Google Scholar]
- [59].Parbin S, Kar S, Shilpi A, et al. Histone deacetylases: a saga of perturbed acetylation homeostasis in cancer. J Histochem Cytochem. 2014;62(1):11–33. doi: 10.1369/0022155413506582 [DOI] [PMC free article] [PubMed] [Google Scholar]
- [60].Barboric M, Nissen RM, Kanazawa S, et al. NF-κB binds P-TEFb to stimulate transcriptional elongation by RNA polymerase II. Mol Cell. 2001;8(2):327–337. doi: 10.1016/S1097-2765(01)00314-8 [DOI] [PubMed] [Google Scholar]
- [61].Ashburner BP, Westerheide SD, Baldwin AS Jr.. The p65 (RelA) subunit of NF-κB interacts with the histone deacetylase (HDAC) corepressors HDAC1 and HDAC2 to negatively regulate gene expression. Mol Cell Biol. 2001;21(20):7065–7077. doi: 10.1128/MCB.21.20.7065-7077.2001 [DOI] [PMC free article] [PubMed] [Google Scholar]
- [62].Wilmott JS, Colebatch AJ, Kakavand H, et al. Expression of the class 1 histone deacetylases HDAC8 and 3 are associated with improved survival of patients with metastatic melanoma. Mod Pathol. 2015;28(7):884–894. doi: 10.1038/modpathol.2015.34 [DOI] [PubMed] [Google Scholar]
- [63].Chen L-F, Mu Y, Greene WC. Acetylation of RelA at discrete sites regulates distinct nuclear functions of NF-κB. EMBO J. 2002;21(23):6539–6548. doi: 10.1093/emboj/cdf660 [DOI] [PMC free article] [PubMed] [Google Scholar]
- [64].Aarenstrup L, Flindt EN, Otkjaer K, et al. HDAC activity is required for p65/RelA-dependent repression of PPARδ-mediated transactivation in human keratinocytes. J Invest Dermatol. 2008;128(5):1095–1106. doi: 10.1038/sj.jid.5701146 [DOI] [PubMed] [Google Scholar]
- [65].Bayazid AB, Kim JG, Azam S, et al. Sodium butyrate ameliorates neurotoxicity and exerts anti-inflammatory effects in high fat diet-fed mice. Food Chem Toxicol. 2022;159:112743. doi: 10.1016/j.fct.2021.112743 [DOI] [PubMed] [Google Scholar]
- [66].Jia M, Liu WX, Yang JJ, et al. Role of histone acetylation in long-term neurobehavioral effects of neonatal exposure to sevoflurane in rats. Neurobiol Dis. 2016;91:209–220. doi: 10.1016/j.nbd.2016.03.017 [DOI] [PMC free article] [PubMed] [Google Scholar]
- [67].Sun J, Wang F, Ling Z, et al. Clostridium butyricum attenuates cerebral ischemia/reperfusion injury in diabetic mice via modulation of gut microbiota. Brain Res. 2016;1642:180–188. doi: 10.1016/j.brainres.2016.03.042 [DOI] [PubMed] [Google Scholar]
- [68].Stilling RM, van de Wouw M, Clarke G, et al. The neuropharmacology of butyrate: the bread and butter of the microbiota-gut-brain axis? Neurochem Int. 2016;99:110–132. doi: 10.1016/j.neuint.2016.06.011 [DOI] [PubMed] [Google Scholar]
- [69].Cui J, Ramesh G, Wu M, et al. Butyrate-producing bacteria and insulin homeostasis: the microbiome and insulin longitudinal evaluation study (MILES). Diabetes. 2022;71(11):2438–2446. doi: 10.2337/db22-0168 [DOI] [PMC free article] [PubMed] [Google Scholar]
- [70].Yuan Y, Zheng Y, Zhang X, et al. BNIP3L/NIX-mediated mitophagy protects against ischemic brain injury independent of PARK2. Autophagy. 2017;13(10):1754–1766. doi: 10.1080/15548627.2017.1357792 [DOI] [PMC free article] [PubMed] [Google Scholar]
- [71].Xu YH, Gao CL, Guo HL, et al. Sodium butyrate supplementation ameliorates diabetic inflammation in db/db mice. J Endocrinol. 2018;238(3):231–244. doi: 10.1530/JOE-18-0137 [DOI] [PubMed] [Google Scholar]
- [72].Gao F, Lv YW, Long J, et al. Butyrate improves the metabolic disorder and gut microbiome dysbiosis in mice induced by a high-fat diet. Front Pharmacol. 2019;10:1040. doi: 10.3389/fphar.2019.01040 [DOI] [PMC free article] [PubMed] [Google Scholar]
- [73].Cherubini E, Miles R. The CA3 region of the hippocampus: how is it? What is it for? How does it do it? Front Cell Neurosci. 2015;9:19. doi: 10.3389/fncel.2015.00019 [DOI] [PMC free article] [PubMed] [Google Scholar]
- [74].Kechin A, Boyarskikh U, Kel A, et al. cutPrimers: a new tool for accurate cutting of primers from reads of targeted next generation sequencing. J Comput Biol. 2017;24(11):1138–1143. doi: 10.1089/cmb.2017.0096 [DOI] [PubMed] [Google Scholar]
- [75].Bolyen E, Rideout JR, Dillon MR, et al. Reproducible, interactive, scalable and extensible microbiome data science using QIIME 2. Nat Biotechnol. 2019;37(9):1091. doi: 10.1038/s41587-019-0252-6 [DOI] [PMC free article] [PubMed] [Google Scholar]
- [76].Callahan BJ, McMurdie PJ, Rosen MJ, et al. DADA2: high-resolution sample inference from Illumina amplicon data. Nat Methods. 2016;13(7):581–583. doi: 10.1038/nmeth.3869 [DOI] [PMC free article] [PubMed] [Google Scholar]
- [77].DeSantis TZ, Hugenholtz P, Larsen N, et al. Greengenes, a chimera-checked 16S rRNA gene database and workbench compatible with ARB. Appl Environ Microbiol. 2006;72(7):5069–5072. doi: 10.1128/AEM.03006-05 [DOI] [PMC free article] [PubMed] [Google Scholar]
Associated Data
This section collects any data citations, data availability statements, or supplementary materials included in this article.