

ABSTRACT
Accumulating evidence suggests that cancer-associated fibroblast (CAF) macroautophagy/autophagy is crucial in tumor development and may be a therapeutic target for pancreatic ductal adenocarcinoma (PDAC). However, the role of CAF autophagy during immune surveillance and cancer immunotherapy is unclear. The present study revealed that the inhibition of CAF autophagy suppresses in vivo tumor development in immune-deficient xenografts. This deletion compromises anti-tumor immunity and anti-tumor efficacy both in vitro and in vivo by upregulating CD274/PDL1 levels in an immune-competent mouse model. A block in CAF autophagy reduced the production of IL6 (interleukin 6), disrupting high desmoplastic TME and decreasing USP14 expression at the transcription level in pancreatic cancer cells. We further identify USP14 as the post-translational factor responsible for downregulating CD274 expression by removing K63 linked-ubiquitination at the K280 residue. Finally, chloroquine diphosphate-loaded mesenchymal stem cell (MSC)-liposomes, by accurately targeting CAFs, inhibited CAF autophagy, improving the efficacy of immunochemotherapy to combat pancreatic cancer.
Abbreviation: AIR: adaptive immune resistance; ATRA: all-trans-retinoicacid; CAF: cancer-associated fibroblast; CD274/PDL1: CD274 molecule; CM: conditioned medium; CQ: chloroquine diphosphate; CyTOF: Mass cytometry; FGF2/bFGF: fibroblast growth factor 2; ICB: immune checkpoint blockade; IF: immunofluorescence; IHC: immunohistochemistry; IP: immunoprecipitation; MS: mass spectrometer; MSC: mesenchymal stem cell; PDAC: pancreatic ductal adenocarcinoma; TEM: transmission electron microscopy; TILs: tumor infiltrating lymphocytes; TME: tumor microenvironment; USP14: ubiquitin specific peptidase 14.
KEYWORDS: Adaptive immune resistance, autophagy, cancer-associated fibroblast, pancreatic ductal adenocarcinoma, programmed cell death 1 ligand 1
Introduction
Pancreatic ductal adenocarcinoma (PDAC) is notoriously resistant to chemotherapy, targeted therapies, and even immunotherapy, primarily due to abundant desmoplasia and an immunosuppressive tumor microenvironment (TME) [1–3]. Thus, there is an urgent need to identify new treatments to remodel the TME that can improve the prognosis of this disease.
Multiple clinical trials of ICB therapy have been launched as a treatment for melanoma, lung cancer, and kidney cancer, with promising clinical results. However, it is estimated that, on average, 25% of patients with solid tumors response to ICB therapy, due to the presence of adaptive immune resistance (AIR) [4–7]. Based on the presence of CD274/PDL1 expression and tumor infiltrating lymphocytes (TILs) (primarily based on CD8+ T cells), the tumors could be divided into four types: CD274− TIL− (type I); CD274+ TIL+ (type II); CD274− TIL+ (type III); and CD274+ TIL− (type IV) [8]. A poor response to anti-CD274, anti-PDCD1/CD279 therapy was observed in solid tumor patients with tumor immune microenvironment (TIME) types I, III and IV. Due to abundant desmoplasia and the immunosuppressive TME of pancreatic cancer, most pancreatic cancers belong to type I and type IV. Thus, ICB therapy has demonstrated limited effectiveness in PDAC to date [9,10]. In theory, an attractive strategy is to convert TIME types (I, III and IV) into type II, making them susceptible to anti-CD274, anti-PDCD1/CD279 therapy in pancreatic cancer.
Carcinoma-associated fibroblasts (CAFs) play a crucial role in promoting the desmoplastic and immunosuppressive TME and thus represent potential therapeutic targets for cancer [11–13]. Autophagy is a multistep-regulated mechanism by which cellular material is delivered to lysosomes for degradation, and supports nutrient recycling and metabolic adaptation [14,15]. Outside of the immune microenvironment, the effects of CAF autophagy on desmoplasia have been previously described [16]. However, it remains unknown what role CAF autophagy plays in immune surveillance and cancer immunotherapy.
Here, we reported that in PDAC, CAF autophagy plays a more important role in immune regulation and immunotherapy than the autophagy of tumor cells themselves. In detail, genetic and chemical autophagy inhibition of CAFs convert TME type I and type IV into type II so it could make sense to enhance the efficacy of ICB and gemcitabine treatment in immune-competent mouse models.
Results
Mutual regulation of CAF autophagy and activation in pancreatic cancer correlates with desmoplasia, an immunosuppressive TME, and poor patient survival
Consistent with previous studies [17], multiplex immunohistochemistry (mIHC) and IF revealed MAP1LC3B/LC3B and SQSTM1/p62 staining intensity in CAFs in pancreatic cancer (Figure S1A and Figure 1A). By classifying our cohorts into MAP1LC3B staining intensity-high or MAP1LC3B staining intensity-low groups and SQSTM1 staining intensity-high or SQSTM1 staining intensity-low groups based on their IHC intensity and area, we found that MAP1LC3B staining intensity in the cancer cells of patients was correlated with poor survival (p = 0.0303). It was also uncovered that MAP1LC3B staining intensity in the patient’s CAFs was correlated with poor survival (p = 0.0002) (Figure 1B,C). But SQSTM1 staining intensity in CAF cells and cancer cells was not correlated with poor survival (Figure S1B). To determine whether CAF autophagy is relevant to AIR, we next evaluated collagen deposition and tumor-infiltrating immune cell populations in human PDAC tissues. Impressively, autophagy (MAP1LC3B/LC3B staining intensity high and SQSTM1 staining intensity low) in CAFs, but not in cancer cells, were significantly correlated with increased collagen deposition and with fewer infiltrating CD8+ T cells (Figure 1D,E). Thus, the results indicated that autophagy in CAFs, but not in tumor cells correlated well with the induction of AIR in pancreatic cancer.
Figure 1.
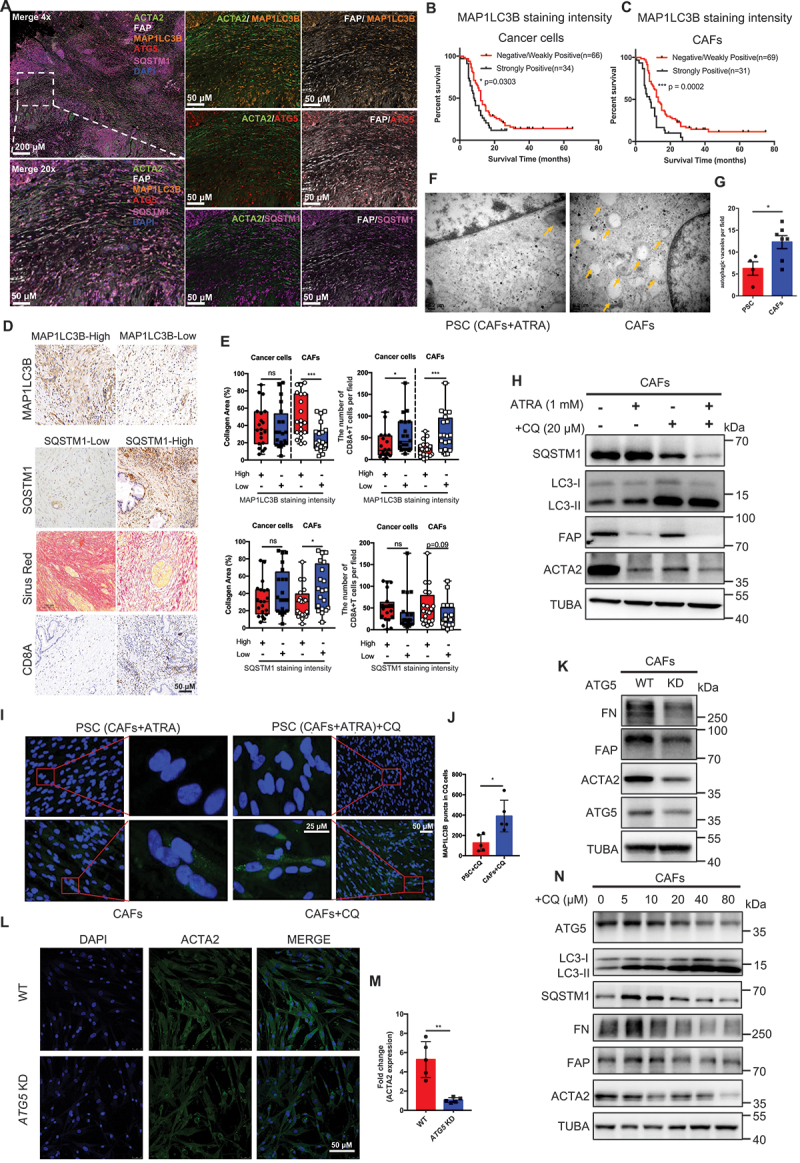
Mutual regulation of CAF autophagy and activation in pancreatic cancer. (A) multi-IHC staining for MAP1LC3B, ATG5, SQSTM1, ACTA2, FAP and DAPI in PDAC. (B and C) tissue microarray analysis of the prognostic role of MAP1LC3B staining intensity in cancer cells and CAFs in pancreatic cancer. (D and E) MAP1LC3B, SQSTM1, CD8A IHC and Sirius red staining in human PDAC tissues and quantification of collagen deposition using Sirius red staining and the CD8A-positive cell area per field. (F and G) Representative transmission electron microscopy images and statistical results of autophagosomes and autolysosomes in CAFs after adding ATRA (1 mM) or PBS. (H) Western blot analysis of LC3-I, LC3-II, SQSTM1, FAP and ACTA2 in CAFs and PSC (CAFs treated after ATRA) with or without CQ. (I and J) Representative microphotographs and statistical results of MAP1LC3B immunofluorescence staining in CAFs following CQ treatment. The addition of CQ to CAFs induced an accumulation of MAP1LC3B in the cytoplasm. (K) CAFs were subjected to Atg5 KD, followed by IB for the different indicated proteins. (L and M) CAFs were subjected to Atg5 KD, followed by IB for ACTA2 (green) and DAPI (blue). (N) CAFs were treated with CQ and then subjected to IB for the different indicated proteins.
To determine the relationship between CAF autophagy and activation, the correlation between MAP1LC3B, ATG5, ATG7, SQSTM1 and ACTA2/αSMA-FAP was first identified in multiple assays, including, but not limited to transcription in the TCGA database and tumor tissue microarrays (Figure S1C-S1F). Furthermore, the transmission electron microscopy (TEM), immunofluorescence staining and immunoblotting results demonstrated that there was a significant reduction in the number of autophagosomes and inhibition of autophagic flux in CAFs treated with all-trans-retinoic acid (ATRA) to decrease CAFs activation (Figure 1F–J). In addition, the inhibition of genetic (Atg5 knockdown) and chemical autophagy (chloroquine) can promote CAFs to enter a quiescent state by the immunofluorescence staining and immunoblotting analyses (Figure 1K–N). Importantly, we also have observed in CAFs that inhibiting autophagy with chloroquine diphosphate (CQ)-spautin-1 and autophagy-deficient (Atg5 KD) impaired collagen secretion (Figure S2A and S2B). The above results suggested that CAF autophagy and activation in pancreatic cancer regulate each other, and correlate with AIR induction and poor patient survival.
Genetic inhibition of CAF autophagy induces CD274/PDL1-upregualation, immune escape, and desmoplastic disruption in both immune-competent mice and pancreatic cancer cells
To investigate the effect of CAF autophagy on tumor cells in vivo, we orthotopically transplanted KPC (LSL-KrasG12D/+; LSL-Trp53R172H/+; Pdx1-Cre) with mouse CAFs (mCAFs)-WT or mCAFs-Atg5 KD cells into immunocompetent and immunodeficient mice (Figure 2A). The results in immunodeficient mice demonstrated that suppressing autophagy in mCAFs attenuated the effect of mCAFs on tumor growth and prolonged overall survival (OS) by reduced proliferation/increased cell death of tumor cells (Figure 2B–D, Figure S2C and Figure S2D), as previously reported [17]. In addition, in vitro, the results of CCK8 assay and immunoblot analysis confirmed this conclusion (Figure S2E and S2F). Intuitively, based on the results in immune-deficient mice and previous studies in our group [18,19], it is expected that mCAFs-Atg5 KD tumors can significantly decrease the tumor size and improve OS in immunocompetent C57BL/6 mice compared to immunodeficient nude mice; However, no significant differences were observed between the mCAFs-Atg5 KD groups and mCAFs-WT group regarding tumor growth and survival in immunocompetent mice (Figure 2E–G). Moreover, we observed that the activity (GZMB+) of infiltrating CD8+ T cells was significantly decreased, whereas no difference was observed in the number of CD8+ T cells in the mCAFs-Atg5 KD groups by flow cytometry and immunohistochemistry (Figure 2H,I, Figure S2G and S2H). Unexpectedly, we observed an obvious upregulation in the level of CD274 protein expression in the tumor cells in the mCAFs-Atg5 KD group, which was associated with a significant decrease in the tumor-infiltrated GZMB+CD8+ T cell population (Figure 2H,M, Figure S2G and Figure S2H). To confirm this conclusion, we performed immunofluorescence, immunoblotting analysis, and flow cytometry in pancreatic cancer cell lines cocultured with CAFs-WT or CAFs-Atg5 KD to detect the level of CD274 expression. Similarly, these results were confirmed in vitro (Figure 2Q–P and Figure S2I-S2M). Functionally, we demonstrated that KPC cells cocultured with CAFs-Atg5 KD rendered the cells more resistant to activated CD8+ T cells in T cell-mediated tumor cell-killing assays (Figure 2S,T) which was similar to the in vivo results. Unexpected, we found that MHC-1 expression was unchanged in tumor cells with CAFs-Atg5 KD and treated with CQ by flow cytometry and immunoblotting analysis both in vivo and in vitro (Figure 2H,I,N, S2N-S2Q). Similarly, no differences were found between the ctrl and CQ-treated groups in immunocompetent mice, compared to immunodeficient mice. In addition, tumors with a large number of CAFs are more resistant to CQ therapy than those with little or no CAFs (Figure S3A and S3B). However, inhibiting chemical autophagy (CQ) sensitizes PDAC tumors to ICB therapy in vivo, accompanied by upregulation of MHC-1 (Figure S3C-S3G), as previous reports [20]. Collectively, these findings suggest that the inhibited CAF autophagy induces CD274 expression in tumor cells, which promotes pancreatic cancer cell immune escape both in vitro and in vivo.
Figure 2.
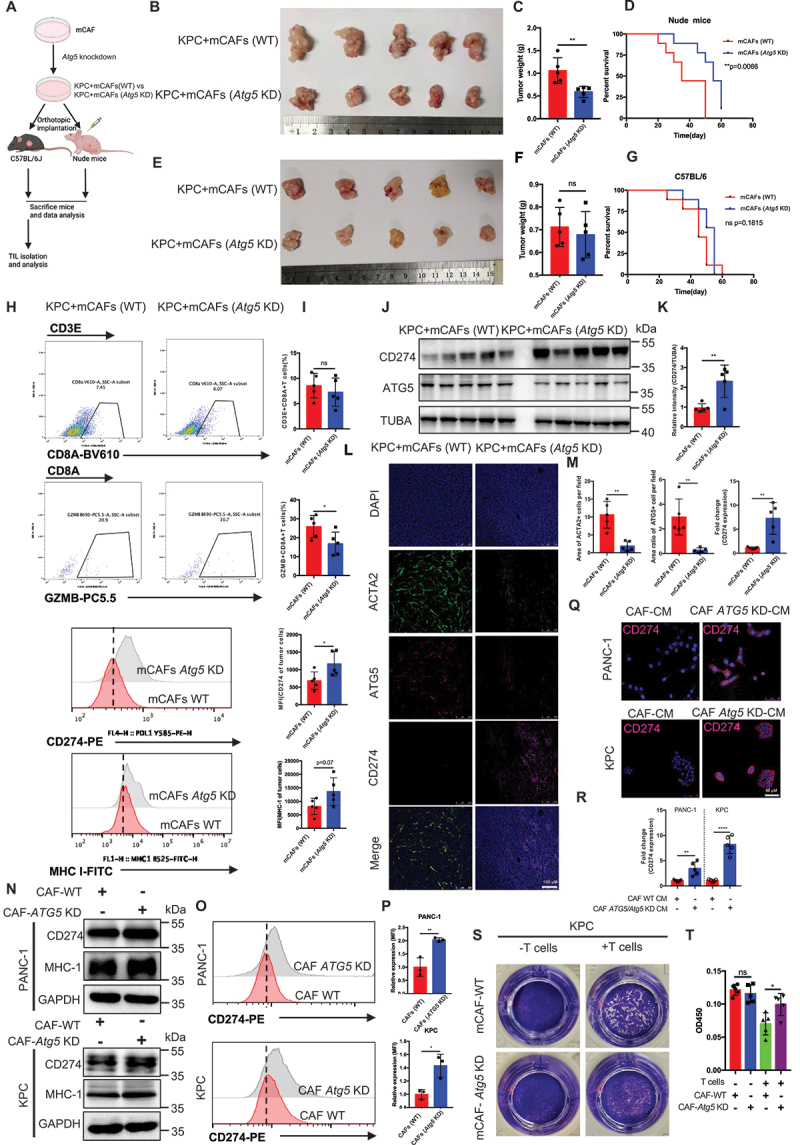
Genetic inhibition of CAF autophagy induced CD274-upregualtion mediated immune escape in both immune-competent mice and pancreatic cancer cells. (A) schematic protocols of WT-mCafs and Atg5 KD-mCafs with KPC separately and subcutaneously. injected into immunocompetent and immunodeficient mice (n = 5). (B-G) Representative images displaying tumors, tumor weight, and survival of immunocompetent and immunodeficient mice bearing WT-mCafs and Atg5 KD-mCafs with KPC. (H and I) Representative images and statistical results of tumor-infiltrating lymphocytes and immunomodulators in tumor cells (n = 5). (J and K) immunoblot analysis of CD274 expression in pancreatic tumors with Atg5 KD-mCafs. (L and M) Representative images and further quantification of tumor-bearing Atg5 KD-CAFs followed by immunofluorescence staining for ACTA2 (green), ATG5 (red), CD274 (pink) and DAPI (blue). (Q and R) Representative images and further quantification of tumor cells cocultured with Atg5 KD-CAFs followed by immunofluorescence staining for CD274 (red) and DAPI (blue). (N) immunoblot analysis of CD274 and MHC-1 expression in tumor cell lines cocultured with WT-CAFs and Atg5 KD-CAFs. (O and P) flow cytometry and further quantification of CD274 expression in tumor cell lines cocultured with WT-CAFs and Atg5 KD-CAFs. (S and T) Representative images and statistical results of T cell-mediated cancer cell-killing assay. KPC cells were pre-cocultured with WT-CAFs and Atg5 KD-CAFs for 24 h, then cocultured with activated T cells for 48 h and subjected to crystal violet staining. The ratio of tumor cells to T cells was 1:8.
Next, to examine the effect of genetic inhibition of CAF autophagy on disruption of high desmoplastic TME, IHC was performed to assess collagen deposition, CAF activation, and the microvascular area of the tumor tissues of immunocompetent C57BL/6 mice. The results demonstrated that the collagen area and ACTA2+CAFs was sharply reduced, which indirectly decreased microvascular intensity in KPC with the CAF Atg5 KD group (Figure S2G and S2H). Overall, these data indicate that the genetic inhibition of CAF autophagy induced CD274 upregulation and disrupted desmoplasia in the PDAC mouse model. These changes function to convert TME type I (CD274− TIL−) into type II (CD274+ TIL+), which may represent a prerequisite for enhancing the efficacy of ICB treatment for PDAC.
Inhibition of CAF autophagy improved the in vivo anti-tumor effect of immunotherapy
Given that the inhibition of CAF autophagy can convert TME type I (CD274− TIL−) into type II (CD274+ TIL+) in pancreatic cancer, one critical question is whether targeting CAF autophagy will have an effect on the therapeutic response to ICB treatment. Thus, we constructed a genetic mouse model atg5f/f-Acta2creERT2 mice to knock out atg5 in the CAFs of PDAC in vivo to investigate the effect of inhibiting CAF autophagy on enhancing the efficacy of ICB treatment of PDAC (Figure 3A). As expected, the genetic deletion of CAF autophagy can enhance the therapeutic efficacy of PDCD1/CD279-targeted drugs (Figure 3B–F). These tumors in atg5f/f-Acta2creERT2 combination with anti-PDCD1/CD279 displayed increased infiltration and cytotoxic effects with bulk CD8 T cells and decreased number of Tregs and tumor-associated macrophages (TAMs) (Figure 3G,H and Figure S4A-S4D). In addition, the upregulation of CD274 expression in tumor cells was confirmed in atg5f/f-Acta2creERT2 mouse model by flow cytometry and CyTOF (Figure 3I,J and Figure S4E-S4G) (List of Antibodies in CyTOF in Table S1). In particular, we found that the immune escape induced by inhibiting CAF autophagy in immune-competent mice was substantially abrogated in cd274 knockout KPC mice. This finding confirms that the immune escape induced by inhibiting CAF autophagy is primarily dependent on the PDCD1/CD279-CD274 signaling pathway (Figure S4H and S4I). At the endpoint, the efficiency of CD274 depletion using tumor cells from the mice was confirmed by flow cytometry (Figure S4J). In addition, CD8+ T cells or NK cells were depleted prior to an inoculation with KPC tumor cells with CAFs, and combined antibody treatment to determine which immune cell types were important for the effects of combination therapy. The efficacy of anti-PDCD1/CD279 treatment was substantially abrogated by the administration of anti-CD8A in mice bearing KPC tumors, whereas anti-KLRB1C/NK1.1 partially inhibited the antitumor response in the combined treatment, indicating that NK cells play a more limited role compared to CD8+ T cells (Figure 3K). Finally, the survival analysis also demonstrated that survival time was significantly prolonged in an atg5f/f-Acta2creERT2 combination with anti-PDCD1/CD279 compared with that in the other groups (Figure 3L).
Figure 3.
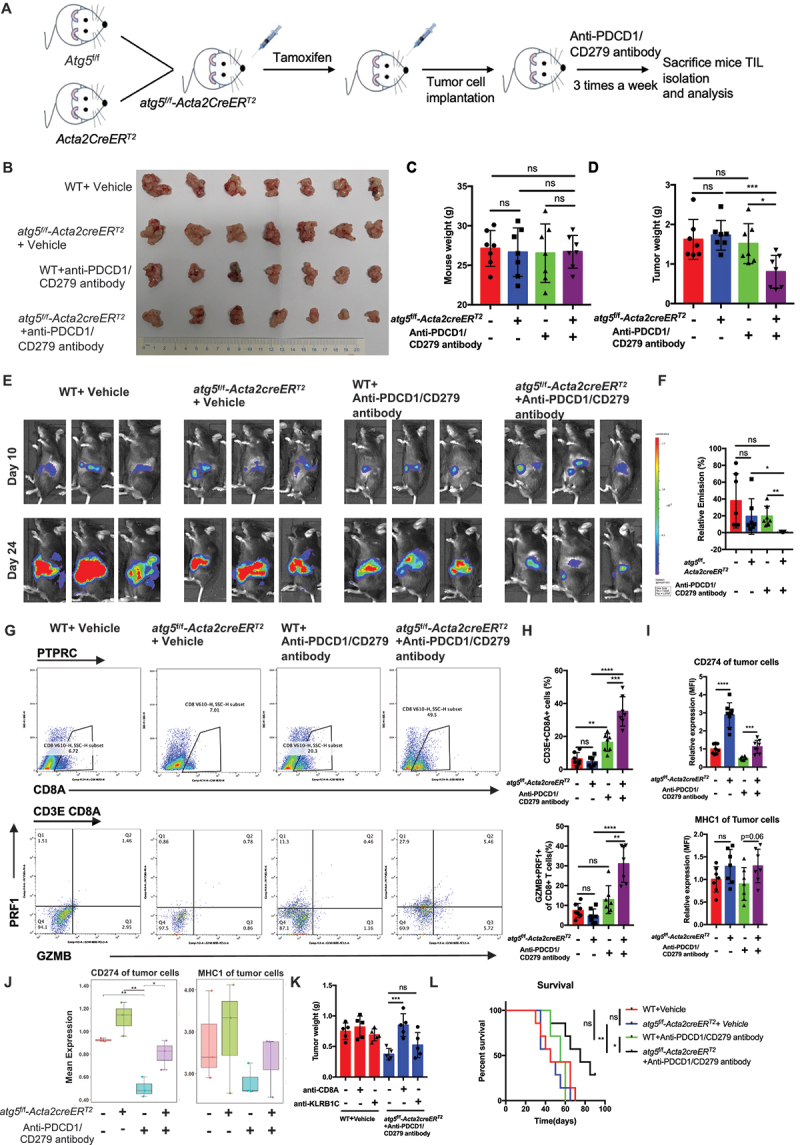
Inhibition of CAF autophagy improved the in vivo anti-tumor effect of immunotherapy. (A) schematic protocol for the genetic inhibition of CAF autophagy combined with anti-PDCD1/CD279 antibody. (B-D) Representative images displaying tumors, tumor weight, and mouse weight of atg5f/f-Acta2creERT2 genetic mice treated with anti-PDCD1/CD279 antibody. (E and F) Representative photograph and statistical results of the IVIS imaging system in mice orthotopically implanted with luciferase-expressing KPC in atg5f/f-Acta2creERT2 genetic mice. (G-I) flow cytometric analysis and statistical results of lymphocytes that have infiltrated the tumors and membrane CD274 and MHC-1 expression on tumor cells (n = 7). (J) CyTOF analysis of membrane CD274 and MHC-1 expression on tumor cells in the four treatment groups (n = 3). (K) the statistical results of tumor weight following pretreatment with anti-CD8A and anti-KLRB1C/NK1.1 in atg5f/f-Acta2creERT2 genetic mice combined with anti-PDCD1/CD279 antibodies. (L) survival curve of orthotopic tumor implantation in atg5f/f-Acta2creERT2 genetic mice. atg5f/f-Acta2creERT2 genetic mice-orthotopic mice were treated with anti-PDCD1/CD279 antibodies until the mice were at the point of death and met the prespecified early removal criteria approved by the IACUC.
Similar to anti-PDCD1/CD279/PD1 treatment for PDAC, we observed that anti-CD274 and anti-CTLA4 treatment in atg5f/f-Acta2creERT2 mice also significantly decreased the tumor weight and prolonged the survival time compared with the other groups (Figure S5A-S5N). To be closer to the clinical treatment, overt atg5f/f-Acta2creERT2 mice bearing with tumors were treated with GEM or/and anti- PDCD1/CD279. As expected, the atg5f/f-Acta2creERT2 group were sensitized to GEM or GEM plus anti-PDCD1/CD279 therapy, and exhibited drastically increased survival (Figure S5O-S5U). We further analyzed the response rate through three independently repeated treatment experiments in an orthotopic mouse model using an IVIS imaging system. The results showed that the response rate of the atg5f/f-Acta2creERT2 with the GEM plus anti-PDCD1/CD279 treatment group was significantly higher compared with that of the control and WT with GEM plus anti-PDCD1/CD279 groups (Figure S5V).
Taken together, these results suggested that combining the inhibition of CAF autophagy and ICB may provide an effective treatment strategy to enhance the therapeutic efficacy of pancreatic cancer.
Deletion of CAF autophagy decreased the secretion of IL6, which further increased CD274 expression via the ubiquitin proteasome system in pancreatic tumor cells
To investigate the detailed mechanism of inhibited CAF autophagy induced CD274-upregualtion immune escape, we determined the difference in cytokine expression between CAFs WT and CAFs Atg5 KD using a cytokine antibody array. The levels of IL6, IL11, CSF1/M-CSF, CCL5/RANTES, and TNFRSF1B/sTNFRII expression were significantly decreased, while other cytokines (IL1B, IL17, IL4, etc.) were unaltered in CAFs after Atg5 KD (Figure 4A,B and Table S2). Furthermore, reduced levels of IL6 derived from Atg5 KD CAFs were confirmed by ELISA (Figure 4C). In addition, the abundance of IL6 expression in CAFs from pancreatic cancer tissue was significantly higher than other four cytokines in patient PDAC tissues and genetically engineered mouse model-KPC tumor tissues (Figure S6A and S6B).
Figure 4.
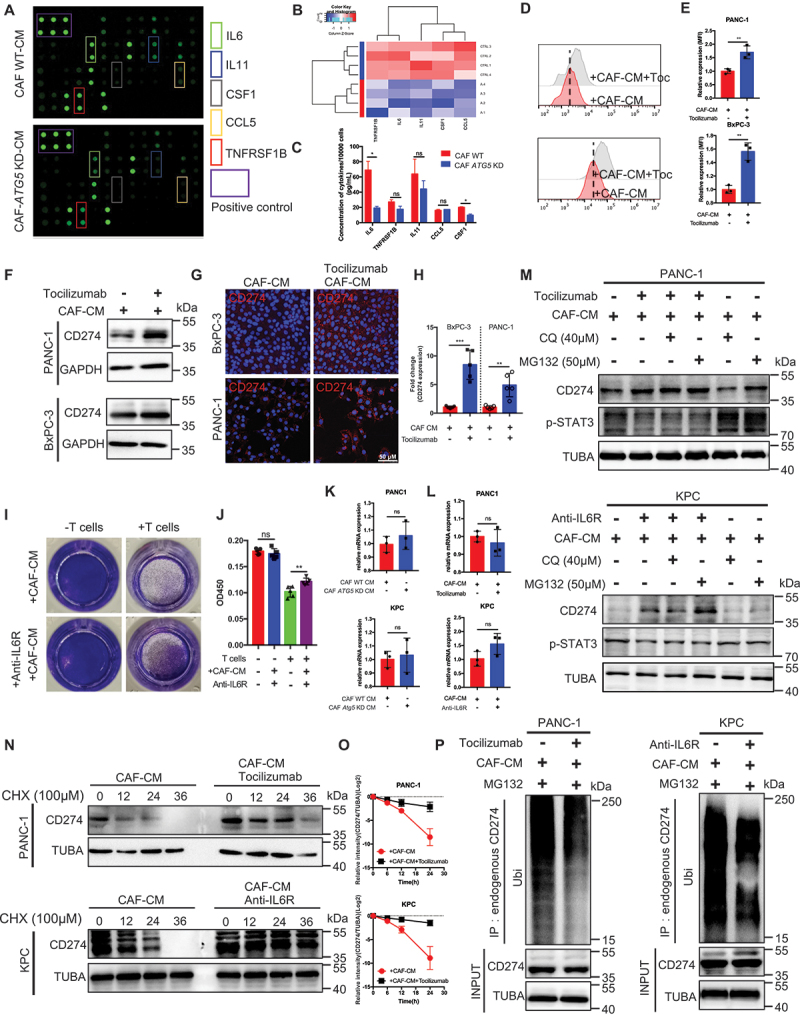
Deletion of CAF autophagy decreased IL6 secretion, which further increased CD274 expression by the ubiquitin proteasome system in pancreatic tumor cells. (A and B) differential cytokine expression was detected between WT and Atg5 KD CAFs using a cytokine antibody array and further quantified with a heatmap analysis. (C) the concentration of the top five secreted cytokines in the cytokine antibody array was identified by an ELISA. (D and E) flow cytometric analysis and statistical results of CD274 expression in tumor cells with or without tocilizumab under CAF-CM. (F) immunoblot analysis of CD274 expression in tumor cells with or without tocilizumab-treated CAFs. (G and H) Representative images and further quantification of tumor cells with or without tocilizumab-treated CAFs. (I and J) Representative images and statistical results of the T cell-mediated cancer cell-killing assay. KPC cells with or without anti-IL6R pre-cocultured CAFs for 24 h were cocultured with activated T cells for 48 h and subjected to crystal violet staining. The ratio of tumor cells to T cells was 1:8. (K) qRT-PCR examination of CD274 expression in tumor cells cocultured with WT-CAFs and Atg5 KD-CAFs for 24 h. (L) qRT-PCR examination of CD274 expression in tumor cells with or without tocilizumab-treated CAFs. (M) immunoblot analysis of CAFs treated with tocilizumab or anti-IL6R for 24 h with and without chloroquine (40 μM for last 6 h of treatment) or MG132 (20 μM for last 6 h of treatment). (N and O) stability analysis of CD274 in tumor cells treated with or without tocilizumab or anti-IL6R cocultured with CAFs following treatment with CHX. (P) ubiquitination assay of CD274 in tumor cells treated with or without tocilizumab or anti-IL6R and cocultured with CAFs after treatment with MG132.
The importance of CAF autophagy-derived IL6 in desmoplasia have been confirmed in vivo. The results revealed that neutralizing CAF autophagy-derived IL6 using neutralizing antibody attenuated induced of desmoplasia due to increased levels of autophagy (Figure S6C and S6D). Next, to explore whether reduced IL6 from Atg5 KD CAFs induced tumor CD274 expression, CD274 expression was examined in tumor cells with or without tocilizumab treatment (IL6R blockade) in CAFs-conditioned medium (CM) by flow cytometry, immunofluorescence, and immunoblotting analysis. The results demonstrated that the presence of increasingly elevated of CD274 expression in tumor cells under CAFs-CM treated with tocilizumab (Figure 4D–H). Similar to previous reports, IL6 upregulates CD274 expression by enhancing its association with N-glycosyltransferase STT3A in hepatocellular carcinoma [21]. Thus, pancreatic cancer cells were treated with IL6 to detect the level of CD274 expression by flow cytometry and immunoblotting analysis. Interestingly, decreased in CD274 expression treated with IL6 in SW1990 and Panc02 (CD274-high cell lines), while increased in CD274 expression treated with IL6 in PANC-1 and KPC (CD274-low cell lines), were detected by immunoblotting analysis (Figure S6F and S6G). By contrast, membrane CD274 expression remained unchanged under IL6-treatment (Figure S6H and S6I). In addition, HLA-ABC/MHC-1 was not significantly affected by IL6-treatment (Figure S6G). Indeed, CAFs-CM plus anti-IL6R significantly attenuated the T cell-mediated cytotoxic effect in vitro compared with CAFs-CM (Figure 4I,J).
To determine how the IL6 pathway blockade regulates the level of CD274 expression, the level of CD274 mRNA remained unchanged in the tumor cells under CAFs treated with Atg5 KD-CM or tocilizumab or anti-IL6R (Figure 4K,L). Moreover, treatment with tocilizumab or mouse anti-IL6R induced CD274/PDL1 protein expression, whereas the addition of the proteasome inhibitor, MG132, not the lysosome inhibitor, CQ, blocked CD274 protein degradation (Figure 4M), indicating that the IL6 pathway blockade regulates CD274 expression via the ubiquitin proteasome system at the post-translational level. Indeed, CD274 in tumor cells under CAF-CM combined with tocilizumab or anti-IL6R treatment exhibited a longer half-life than the control groups, as well as lower levels of ubiquitination (Figure 4N–P). In addition, we performed GeneOntology (GO) and enrichment plot of RNAseq in BxPC-3 with or without tocilizumab treatment cocultured with CAFs for 24 h. The GO analysis showed that proteasomal protein catabolic process and ubiquitin protein ligase binding were significantly altered under tocilizumab treatment (Figure S6J and Figure S6K).
Based on the above observations, our results indicated that the genetic inhibition of CAF autophagy decreased the level of IL6 secretion, which further increased the level of CD274 expression by the ubiquitin proteasome system in pancreatic tumor cells.
Transcriptional activation of USP14 by STAT3 interacted with and negatively regulated CD274/PDL1 in pancreatic cancer
To further illustrate the underlying mechanism by which a IL6 pathway blockade mediates CD274 regulation, we first performed an intersection analysis of the proteasome-mediated degradation pathway using RNAseq in BxPC-3 cells treated with or without tocilizumab (50 ng/mL) and cocultured with CAFs and CD274 flag-IP-LCMS. 35 genes/proteins were shown in the intersection analysis (Figure 5A–C). We also identified deubiquitinating enzyme 14 (USP14) to represent a critical regulator of IL6 pathway blockade-mediated CD274 regulation by an immunoblotting analysis (Figure 5D and Figure S6L). Such reduction in USP14 was also demonstrated in tumor cells under CAF Atg5 KD-CM (Figure 5E). Bioinformatic analyses across multiple cancers demonstrated that USP14 was significantly upregulated in PAAD tissues compared with the level of expression in normal tissues (Figure S7A and S7B). Importantly, USP14 in pancreatic tumor cells not regulated by TFEB (Figure S7C and S7D).
Figure 5.
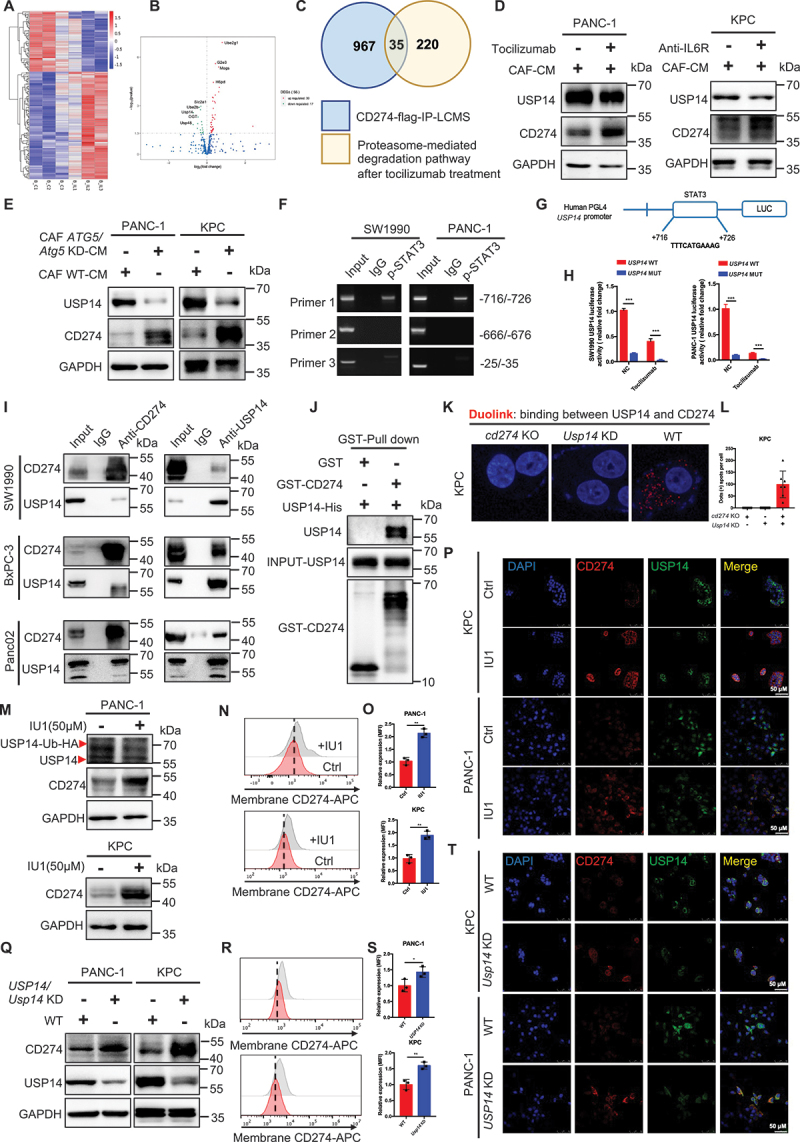
Transcriptional activation of USP14 by STAT3 interacted with and negatively regulated CD274 in pancreatic cancer. (A and B) heatmap and volcano plot of RNAseq in BxPC-3 with or without tocilizumab treatment cocultured with CAFs for 24 h. (C) intersection analysis of the proteasome-mediated degradation pathway in RNAseq and CD274 flag-IP-LCMS. (D) immunoblot analysis of USP14 expression in tumor cells with or without tocilizumab or anti-IL6R treatment and cocultured with CAFs. (E) immunoblot analysis of USP14 expression in tumor cells cocultured with WT-CAFs and Atg5 KD-CAFs for 48 h. (F) chromatin immunoprecipitation (ChIP) assay analysis of the STAT3-bound potential binding site in the USP14 promotor. (G and H) schematic representation of the USP14 promoter cloned into the pGL4 vector. The predicted STAT3-binding motifs were shown and the promoter constructs containing mutations in this region to cause a STAT3-binding deficiency were generated. (I) cell lysates from SW1990, BxPC-3, and Panc02 were separately analyzed by IP and western blotting using the antibodies indicated. Representative images are shown. (J) GST affinity-isolation assay of USP14-his and GST-CD274 proteins. Representative images are shown. (K and L) Representative images and statistical results of individual immunofluorescence staining of the USP14 and CD274 interaction in KPC cells by a duolink assay. The red dots (USP14/CD274 interaction) indicate their interaction. (M-T) immunoblot analysis, flow cytometric analysis, and immunofluorescence staining of CD274 expression in tumor cells following treatment with IU1 (USP14 inhibitor) and Usp14 knockdown.
It has been well-established that STAT3 represents the most important downstream transcription factor of IL6. Accordingly, we performed a CHIP assay to analyze the level of STAT3-bound potential binding site in the USP14 promotor. As shown in (Figure 5F,G) one putative binding region in STAT3 was found and promoter constructs containing mutations in this region were generated to cause a STAT3-binding deficiency. To determine whether this STAT3 site was a transcriptionally active region, a dual luciferase assay was performed in 293T cell lines to test the expression of USP14 containing WT or MUT promoter elements for STAT3. STAT3-Flag cells exhibited a significantly higher level of USP14 expression compared to the negative ctrl in both SW1990 and PANC-1. Moreover, mutating the USP14 promoter reduced the expression in NC and STAT3-Flag cells. Similar results were observed after tocilizumab treatment. Tocilizumab-treated cells had significantly lower USP14 expression than the ctrl group in SW1990 and PANC-1 cells. Mutating the USP14 promoter reduced the expression in the ctrl and tocilizumab-treated cells (Figure 5H).
Furthermore, the results of the IP showed tan endogenous interaction between USP14 and CD274 in multiple pancreatic cell lines (Figure 5I). Moreover, a GST (glutathione S-transferase) affinity-isolation assay showed that USP14 bound to CD274 directly (Figure 5J). A Duo-link assay consistently demonstrated the binding between USP14 and CD274 in the cells (Figure 5K,L). USP14 inhibitior (IU1) (deubiquitylating enzyme activity of USP14 was determined by HA-Ub-VS) or depletion increased the level of CD274 expression in pancreatic cancer by immunoblotting analysis, flow cytometry, and immunofluorescence (Figure 5M–T and Figure S7E-S7G). Functionally, a Usp14 knockdown in pancreatic cancer cells in vitro increased the resistance of tumor cells to activated CD8+ T cells in a T cell-mediated tumor cell-killing assay (Figure S7H and S7I). Next, we inoculated Usp14 KD KPC cells into immunodeficient mice to study the effects in vivo. The tumor volume was significantly reduced in Usp14 KD group compared with the WT group. In addition, a prolonged survival time was observed in the Usp14 KD groups compared with the WT group in immunodeficient mice; however, no significant differences were observed between the Usp14 KD groups and the ctrl group in terms of tumor growth and survival in immunocompetent mice (Figure S7J-S7M). To explore whether a USP14 deficiency enhanced the effect of anti-PDCD1/CD279 therapy, anti-PDCD1/CD279 was comminated with IU1 in an immune-competent orthotopic model. Importantly, a combination with anti-PDCD1/CD279 and IU1 further decreased the tumor weight and prolonged the animal survival time compared with that of other groups (Figure S7N-S7Q). Together, our results suggested that the transcriptional activation of USP14 by STAT3 interacted with and negatively regulated CD274 in pancreatic cancer.
USP14 destabilizes CD274 through specifically removing K63-linked poly-ubiquitination of CD274 at the K280 residue
In contrast to upregulated CD274 expression following the USP14 deletion, USP14 overexpression decreased the level of CD274 expression in pancreatic cancer, which was accumulated by treatment with the proteasome inhibitor, MG132, suggesting that USP14 regulated CD274 expression via the proteasome system (Figure 6A,B). Indeed, the USP14 deletion exhibited a longer half-life than the control groups, and elevated K63-linked ubiquitination of CD274, which was reduced by K48-linked ubiquitination (Figure 6C–E). Moreover, an in vitro deubiquitination assay in a cell-free system further confirmed that USP14 could directly remove K63-linked ubiquitin chains from CD274, but not cleave the canonical K48-linked ubiquitination of CD274, since this would be expected to negatively regulate the abundance of CD274 protein expression (Figure 6F). Data from the Duolink assay indicated that the binding between CD274 and USP14 (Duo: red) occurred in the ER (CANX; green) (Figure 6G). The number of CD274-USP14 PLA dots were positively correlated with the level of CANX fluorescence intensity (Figure 6H). In addition, the cell fractionation results showed that Eer I treatment indeed rescued the level of CD274 in the ER (Figure 6I).
Figure 6.
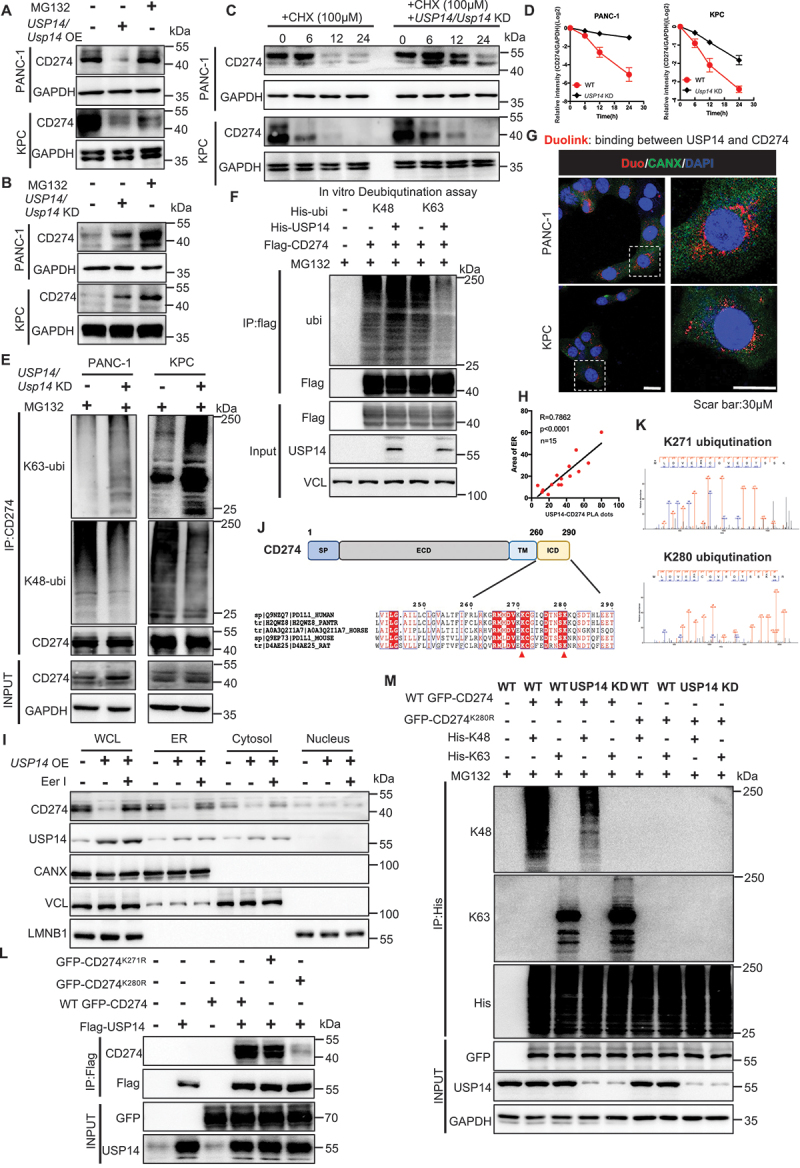
USP14 destabilizes CD274 and specifically removes the K63-linked poly-ubiquitination of CD274 at the K280 residue. (A and B) immunoblot analysis of CD274 expression in tumor cells with USP14 overexpression or knockdown after treatment with MG132. (C and D) stability analysis of CD274 in tumor cells with Usp14 knockdown following treatment with CHX. (E) ubiquitination assay of CD274 in tumor cells with a Usp14 knockdown after treatment with MG132. (F) in vitro deubiquitination assays of recombinant USP14 proteins and enriched K48-linked or K63-linked ubiquitinated CD274 from cell extracts. The mixture was incubated at 30°C for 4 h and subsequently analyzed by immunoblotting. (G and H) Representative images and statistical results of the tumor cells were subjected to a duolink assay combined with immunofluorescence staining using markers for ER (CANX) and nuclei (DAPI). (I) immunoblot analysis of CD274 and USP14 in different fractions, using antibodies against CD274 and USP14, the ER protein CANX, cytosolic TUBA, as well as the nuclear protein, LMNB1. (J) schematic diagram of the USP14-binding motif in amino acid sequences surrounding the potential binding sites of CD274 that were aligned in evolutionarily divergent species. (K) the ubiquitination site on CD274 as identified by mass spectrometry. (L) immunoblot analysis of CD274 expression in flag-USP14 and WT GFP-CD274 or GFP-CD274K271R or GFP-CD274K280R-transfected HEK293T cells. (M) ubiquitination assay of CD274 in USP14 WT and Usp14 knockdown HEK293T cells transfected with WT GFP-CD274 or the GFP-CD274K280R were subjected to his pull-down and SDS-PAGE analyses.
CD274 is a transmembrane protein, and the cytoplasmic domain of CD274 (CD274-ICD; 260–290 residues) is involved in multiple regulation pathways controlling CD274 protein ubiquitination and degradation [22]. Therefore, we speculated that USP14 can remove ubiquitin chains from the ICD region of CD274. Two evolutionarily conserved USP14 ubiquitination-specific motifs were identified across multiple species, centering at the K271 and K280 residues, were further confirmed by a ubiquitinationomic analysis (Figure 6J,K). We constructed GFP-CD274K271R and GFP-CD274K280R mutants to examine whether USP14 could affect GFP-CD274K271,280R expression and ubiquitination. In cd274 KO KPC cells, the K280R mutant displayed significantly decreased levels of CD274 expression, compared with WT GFP-CD274 and GFP-CD274K271R (Figure 6L). Furthermore, in Usp14 KD KPC cells, the ubiquitination of WT GFP-CD274 was significantly increased, whereas the K280R mutant displayed virtually no ubiquitination (Figure 6M). Thus, USP14 destabilized CD274 through specifically removing K63-linked poly-ubiquitination of CD274 at the K280 residue, but not K271, as confirmed by a bioinformatics analysis (Table S3).
Targeting CAF autophagy renders primary PDAC tumors eradicable by immunotherapy via engineering stem cell-derived biomimetic vesicles
To explore the efficacy of combination therapy between ICB and the inhibition of autophagy in PDAC, as mentioned above, we found that inhibiting chemical autophagy (CQ) sensitizes PDAC tumors to ICB therapy (Figure S3C-S3G). However, inhibition autophagy by chloroquine via an intraperitoneal administration orthotopic mouse model could not specifically target CAF autophagy. Thus, to achieve targeted delivery of CQ to CAFs, a biomimetic drug delivery system, termed mesenchymal stem cell (MSC)-Lipo, was prepared according to the procedure illustrated in (Figure 7A,) as previously reported [23,24].
Figure 7.
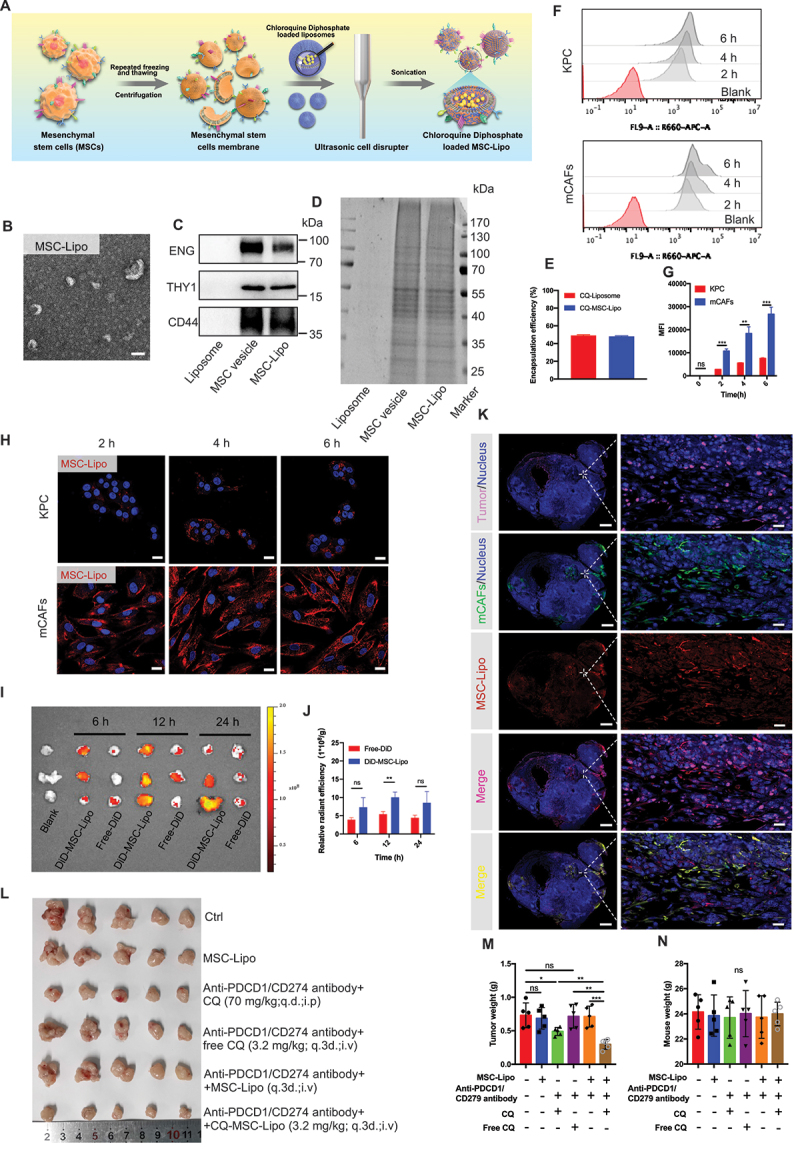
Targeting CAF autophagy renders primary PDAC tumors eradicable by immunotherapy via engineering stem cell-derived biomimetic vesicles. (A) the preparation, characterization, and targeting of the therapeutic application of MSC-Lipo. (B) transmission electron microscopy image of MSC-Lipo. Scale bar: 100 nm. (C) immunoblot analysis of liposomes, MSC vesicles, and MSC-Lipo for specific surface markers (ENG/CD105, THY1/CD90, and CD44). (D) SDS-PAGE analysis of the protein contents of liposomes, MSC vesicles, and MSC-Lipo. (E) Encapsulation efficiency of CQ-loaded liposomes and MSC-Lipo (n = 3). (F) flow cytometry analysis of MSC-Lipo uptake by KPC and mCafs at 2 h, 4 h and 6 h and 12 h. (G) quantification of fluorescence intensity (n = 3). (H) KPC and CAFs uptake MSC-Lipo at 2 h, 4 h and 6 h as captured by a confocal laser scanning microscope (red: DiD and blue: DAPI). Scale bar: 20 μm. (I) the distribution and (J) relative radiant efficiency of free-DiD and DiD-MSC-Lipo in tumors at 6 h, 12 h and 24 h after intravenous injection (n = 3). (K) colocalization of MSC-Lipo with KPC and CAFs in the tumor sections at 12 h after an intravenous injection (red: DiD, green: CD326, pink: ACTA2 and blue: DAPI). Scale bar: 2 mm for the original images and 100 μm for the magnified images. (L) photography of tumors at the ending of treatment (n = 5). Tumor weight (M) and body weight (N) at the end of treatment (n = 5).
The hydrodynamic size of MSC-Lipo was 74.267 nm ±14.614 nm and the zeta potential of MSC-Lipo decreased to −3.980 mV ±0.314 mV with the addition of negative charges of the MSC membrane (Figure S8A). The results of transmission electron microscopy (TEM) showed that MSC-Lipo exhibited a clear and complete bilayer structure with no adhesion (Figure 7B and Figure S8B). The colocalization of liposomes (labeled by DiD, red) and MSC membrane (labeled by DiO, green) illustrated that these two components were well integrated at a weight ratio of 1:0.5 (Figure S8C). The immunoblot analysis indicated that MSC-specific marker proteins (e.g., ENG/CD105, THY1/CD90, and CD44) were preserved after membrane integration using a sonication probe (Figure 7C). The total protein profile of MSC-Lipo was consistent with that of the MSC membrane, whereas liposomes did not exhibit any protein expression according to SDS-PAGE results (Figure 7D). The MSC-Lipo characterization results indicated that MSC-Lipo inherited some properties of specific proteins on the surface of the MSC was successfully prepared. Furthermore, MSC-Lipo also maintained 48.123% ± 0.696% drug encapsulation efficiency of CQ after sonication (Figure 7E). Therefore, stable drug loading capability laid the foundation for MSC-Lipo as a drug delivery carrier.
To investigate the delivery capacity of MSC-Lipo in an orthotopic pancreatic TME, the cellular uptake and tumor targeting ability of MSC-Lipo were evaluated both in vitro and in vivo. The flow cytometry and IF analysis and demonstrated that MSC-Lipo has a better uptake in mCAFs than KPC cells (Figure 7F–H, Figure S8D-S8F). Compared with free-DiD, MSC-Lipo presented a stronger tumor targeted ability in vivo imaging system, especially 12 h after intravenous injection (Figure 7I,J). Moreover, to further study the cellular uptake in tumor tissues, the result demonstrated that a substantial amount of MSC-Lipo was taken up by the mCAFs (orange fluorescence) (Figure 7K). Both the in vitro and in vivo results confirmed that MSC-Lipo could targeting deliver drugs to mCAFs rather than KPC.
Furthermore, the anti-tumor effect of anti-PDCD1/CD279 combined with CQ-loaded MSC-Lipo was explored in mice with orthotopic pancreatic cancer. The outcomes proved that anti-PDCD1/CD279 combined with CQ-MSC-Lipo most effectively suppressed tumor growth, which was especially reflected in the tumor volume and weight. Surprisingly, compared with an intraperitoneal injection of free CQ, an intravenous injection of CQ-MSC-Lipo exerted a better anti-tumor effect with the reduction of the dosage to 4.6% and a dosing frequency of 33.33% at the same time. In addition, MSC-liposome membrane not contain pro-tumorigenic factors (Figure 7L,M). There was no significant difference in body weight between each group at the end of treatment (Figure 7N), whereas all groups were within the normal range for liver and kidney function (Figure S8G). The weight to body ratio of each organ and H&E staining did not reveal a significant difference between each group (Figure S8H and S8I), indicating that CQ-MSC-Lipo had substantial biocompatibility in the treatment of pancreatic cancer.
In conclusion, the findings of our study revealed that a deletion in CAF autophagy reduced the level of IL6 production, disrupting desmoplasia, and decreasing the level of USP14 expression transcription in pancreatic cancer cells. Indeed, we identified USP14 as the post-translational factor upregulating CD274 expression by removing K63 linked-ubiquitination at the K280 residue. Functionally, the autophagy-deficient CAFs improved the efficacy of anti-PDCD1/CD279 anti-CD274 and gemcitabine treatment of pancreatic cancer in an immune-competent mouse model (Figure 8).
Figure 8.
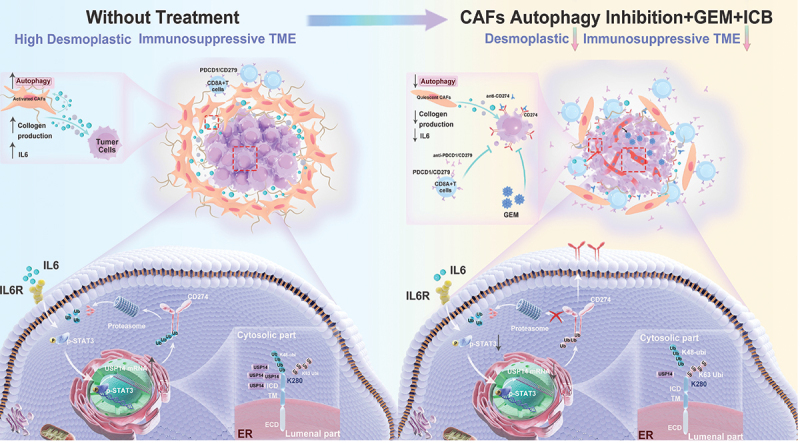
Predicted model of the CAF autophagy-IL6-USP14-CD274 signaling pathway in pancreatic cancer. A schematic model is proposed to illustrate how tumor immune surveillance and desmoplastic TME is regulated by CAF autophagy in pancreatic cancer. Therefore, targeting CAF autophagy improved the efficacy of immunochemotherapy of pancreatic cancer.
Discussion
It has increasingly become the consensus that the TME comprises a heterogeneous population of CAFs with different functions rather than comprising a uniform population of cells within PDAC tumors. Based on the expression pattern of various fibroblast markers in vivo, the existence of distinct myofibroblastic CAFs (myCAFs) (ACTA2high IL6low), inflammatory CAFs (iCAFs) (ACTA2high IL6low) and antigen-presenting CAF (apCAF) (MHC class II+ CD74+) subpopulations were confirmed in a KPC mouse model and PDAC patient samples [25,26]. Both our study and previous reports have revealed that CAF autophagy is positively correlated with the activation of pancreatic cancer, and is associated with poor outcomes (shorter survival time and disease recurrence) for patients with pancreatic cancer [17]. Interestingly, data from our study demonstrated that autophagy activation in CAFs (ACTA2+) was accomplished by IL6 secretion. Thus, in contrast to the above three subtypes, ACTA2high IL6high CAFs may exist independently, suggesting that autophagy may also be an important signature for characterizing different CAF subtypes.
The studies have reported that the inhibition of CAF autophagy markedly inhibited the tumor growth of pancreatic cancer and head and neck squamous cell carcinoma in nude mice [17,27]. In our study, this result was confirmed in nude mice; however, no significant differences were observed in tumor growth and survival following the inhibition of autophagy in CAFs in immunocompetent mice. Our results revealed that the mechanism through which this deletion induces CD274 upregulation, which inactivates cocultured T cells in vitro, compromises anti-tumor immunity in vivo and reduces anti-tumor efficacy in an immune-competent mouse model. Recently, we have explored in-depth how to improve the therapeutic efficacy of anti- PDCD1/CD279/CD274 in both pancreatic and liver cancer [18,19,28]. In these previous studies in our group, we have focused on improving the therapeutic efficacy of anti-CD274 in CD274+ TIL+ (type II) or/and CD274+ TIL− (type IV) tumors by targeting the crucial regulators of CD274 to reduce the level of CD274 protein expression. Although this makes up for the poor therapeutic efficacy caused by incomplete blocking of anti-CD274, TME type I (CD274− TIL−) and type III (CD274− TIL+), classified as “target-missing”, occur in 60%- 85% of solid tumors [7]. Especially in pancreatic cancer, a lack of CD274 protein expression exists in most patient samples from our data. Since anti-PDCD1/CD279 anti-CD274 therapy functions by blocking the interaction between PDCD1/CD279 and CD274, a lack of expression of one or both proteins in the TME would not allow this therapy to function, in theory. Thus, a practical approach is to convert TME type I (CD274− TIL−) or type III (CD274− TIL+) into type II (CD274+ TIL+), making them susceptible to anti-PD therapy. This strategy has also been confirmed by recently published studies [29,30].
Yamamoto et al. have reported that the inhibition of autophagy with chloroquine acts to synergize with immune checkpoint blockade (ICB) therapy by restoring surface levels of MHC-I in pancreatic cancer [20]. But in our study, it was found that different pancreatic cancer cell lines and mice model treatment with chloroquine showed inconsistent changes in MHC-I expression. Thus, the mechanism of chloroquine-enhanced immunotherapy is complicated, due to the intricate immune microenvironment and gene phenotype characteristics of pancreatic cancer.
To explore the clinical utility of our results in the future, we searched for clinical trials investigating chloroquine-treated in pancreatic cancer. The results showed that the combination of gemcitabine hydrochloride and nab-paclitaxel (GA) with hydroxychloroquine sulfate did not improve the primary end point of OS at 12 months [31]. In addition, two other clinical trials have not published any results (NCT02071537 and NCT01777477). According to the preclinical results in this paper, one reason for the negative results of the clinical trials is that the inhibition of autophagy induces the upregulation of CD274 expression to suppress anti-tumor efficacy. Therefore, based of chemotherapy and chloroquine, additional ICB immunotherapy can achieve a better clinical treatment effect and prolong the survival time of PDAC patients.
In summary, we uncover an interesting and innovative story about pancreatic cancer: CAFs activation strengthens the physical barrier by eating self, blocking the infiltration of anti-tumor drugs and immune cells, and makes the tumor highly level of ubiquitination to cause the “target-missing” of CD274 in pancreatic cancer, which further formed the immune desert of pancreatic cancer to avoid being killed by CD8+ T cells. In short, eating self of CAFs for not to be eaten of tumor cells. Thus, disrupting the “self-sacrifice” of CAFs pave the way for further clinical trials to evaluate their clinical impact on patients with PDAC.
Materials and methods
Mouse models
KPC (LSL-KrasG12D/+; LSL-Trp53R172H/+; Pdx1-Cre) genetically engineered mouse model was a kind gift from Prof. Raghu Kalluri (MD Anderson Cancer Center, Houston, TX, USA).
atg5f/f-Acta2creERT2 mice were generated by crossbreeding C57BL/6J-atg5em1(flox)Cya (Cyagen Biosciences, TOS190429JN1), and C57BL/6JSmoc-Acta2em1(CreERT2-Wpre−polyA) Smoc (Shanghai Model Organisms Center, NM-KI-200074). At 6 weeks of age, tamoxifen was administered via an intraperitoneal injection (using an ACUC approved injection procedure) once every 24 h for a total of 5 consecutive days. For the Cre characterization work, there was a 14-day waiting period between the final injection and necropsy/histological analysis or PDAC orthotopic implantation.
PDAC orthotopic model. The orthotopic model of PDAC was established as described previously [18,19]. For combination therapy, in the in vivo experiments using an orthotopic model of PDAC, treatment began when the tumors reached 100–200 mm3. Tumor-bearing mice were divided into six groups and treated with anti- PDCD1/CD279 (200 μg/mouse, q.3d. intraperitoneal injection), chloroquine phosphate (70 mg/kg, q.d. intraperitoneal injection; Sigma-Aldrich, PHR1258), free-chloroquine phosphate (80 μg/each, q.3d. intravenous injection), MSC-Lipo (80 μg/each, q.3d. intravenous injection), and chloroquine phosphate loading MSC-Lipo (80 μg/each, q.3d. intravenous injection), either alone or in combination (n = 5) for 14 days.
For atg5f/f Acta2creERT2 mice combination with ICB or/and gemcitabine, KPC-LUC cells (5 × 10⁵) were injected into the pancreas using a sterile insulin needle after 14-days of administering tamoxifen. Treatment started when the tumors reached 100–200 mm3, as detected by in vivo imaging. Mice bearing tumors were evenly divided into two groups for each genotype according to the tumor volume: WT+vehicle, atg5f/f-Acta2creERT2+vehicle, WT+anti-PDCD1/CD279 anti-CD274 anti-CTLA4 (+gemcitabine), and atg5f/f-Acta2creERT2+anti-PDCD1/CD279 anti-CD274 anti-CTLA4 (+gemcitabine). All antibodies were treated with 200 μg/mouse via intraperitoneal injection three times every week for 14 days. For gemcitabine treatment, mice received intraperitoneal injection of a gemcitabine solution in PBS (Solarbio, P1020) at 50 mg/kg or PBS every other day.
For survival experiments of the orthotopic model, atg5f/f-Acta2creERT2 mice treated with ICB or/and gemcitabine and combination therapy was performed as mentioned above until mice were moribund and met the prespecified early removal criteria as approved by the IACUC. The time of death of each mouse was tracked and recorded, and a survival curve was plotted.
Three days before tumor implantation with KPC tumor cells CD8+ T cells were depleted using mouse anti-CD8A antibodies (200 μg, clone 53–6.7; Bioxcell, BE0004–1) or isotype control (200 μg, clone 2A3; Bioxcell, BE0089) by intraperitoneal injection. NK cells were depleted using 50 μL polyclonal anti-Asialo GM1 (Ultra-LEAF grade; BioLegend 146,002) by intravenous injection three days prior to tumor implantation. Depletion antibodies were administered every three days throughout the study. All experiments were performed in a specific-pathogen-free (SPF) grade facility, in which the mice were housed in prepackaged disposable irradiated cages, and fed an irradiated diet and acidified water.
Human/Mouse CAFs and human/mouse PDAC cells
Human CAFs was established in the Department of Hepatobiliary and Pancreatic Surgery, the First Affiliated Hospital, Zhejiang University School of Medicine from fresh surgically resected tissues of PDAC patients using an enzymatic digestion method. Mouse CAFs was established in the Animal Center, the First Affiliated Hospital, Zhejiang University School of Medicine from fresh PDAC tissues from a KPC genetically engineered mouse model using the outgrowth method. The isolated cells were confirmed as CAFs as previously reported [17]. Cell lines were maintained in Stellate Cell Medium (Sciencell, 5301) supplemented with 10% fetal bovine serum (FBS), 1% Pen-Strep (Cienry, CR-15140) at 37°C in a humidified atmosphere containing 10% CO2.
Mesenchymal stem cells (MSCs) isolated from a human umbilical cord were purchased from SinoCell Technology Ltd. (N/A). The MSCs were cultured in alpha-Minimal Essential Medium (alpha-MEM; VivaCell, C3065–0500) supplemented with 10% non-heat inactivated fetal bovine serum, 10 ng/mL recombinant human EGF (epidermal growth factor; PeproTech, 500-P45), and 10 ng/mL human FGF2 (fibroblast growth factor 2; PeproTech, 100-18B).
All PDAC cells, except KPCs, were purchased from the ATCC (American Type Culture Collection, catalog numbers in Table 1). These cells were grown in high-glucose Dulbecco’s modified Eagle’s medium (DMEM; Gibco 11,965,092) supplemented with 10% FBS and 1% Pen-Strep. The KPC cell line, which was derived from tumor of an KPC genetically engineered mouse model, was cultured in modified McCoy’s 5A Medium (Thermo Fisher Scientific 16,600,108) containing 10% FBS and 1% Pen-Strep. All cell lines were routinely tested or mycoplasma contamination using PCR and found to be negative.
Table 1.
Key resources table.
| REAGENT or RESOURCE | SOURCE | IDENTIFIER |
|---|---|---|
| Antibodies | ||
| CD274/PD-L1(E1L3N) XP rabbit mAb | Cell Signaling Technology | 13684 |
| CD274/PD-L1 (B7-H1) monoclonal antibody (MIH5) | Thermo Scientific | 16-5982-82 |
| CD274/PD-L1 (B7-H1) monoclonal antibody (MIH1) | Thermo Scientific | 14-5983-82 |
| CD274/PD-L1 (B7-H1) antibody | Proteintech | 66248–1-Ig |
| GFP tag polyclonal antibody | Proteintech | 50430–2-AP |
| CD274/PD-L1 (B7-H1) antibody | Abcam | ab213480 |
| Anti-MAP1LC3B/LC3B antibody | Abcam | ab232940 |
| Anti-ATG5/APG5L antibody | Abcam | ab108327 |
| Anti-ACTA2 antibody | Abcam | ab7817 |
| Anti-GAPDH antibody | Abcam | ab8245 |
| Anti-VCL (vinculin) antibody | Abcam | ab129002 |
| Anti-HLA Class I | Abcam | ab23755 |
| Anti-CANX (calnexin) antibody | Abcam | ab22595 |
| Anti-LMNB1 (lamin B1) antibody | Abcam | ab229025 |
| Anti-ENG/CD105 antibody | Abcam | ab169545 |
| Anti-THY1/CD90/Thy1 antibody | Abcam | ab225 |
| Anti-CD44 antibody | Abcam | ab189524 |
| Anti-ELOB/TCEB2(elongin B) antibody | Abcam | ab154854 |
| Anti-PRKAR1B/KAP1 antibody | Abcam | ab109287 |
| Anti-UBE2N/Ubc13 antibody | Abcam | ab109286 |
| Anti-OTUB1 antibody | Abcam | ab270959 |
| Anti-HSPA/HSP70 antibody | Abcam | ab5439 |
| Anti-UBA52 antibody | Abcam | ab109227 |
| Anti-UCHL5/UCH37 antibody | Abcam | ab124931 |
| Anti-USP14/TGT antibody | Abcam | ab71165 |
| Anti-USP14/TGT antibody | Abcam | ab192618 |
| USP14 polyclonal antibody | Invitrogen | PA5–30300 |
| HLA-ABC monoclonal antibody (W6/32) | Invitrogen | MA5–11723 |
| BCAP31/BAP31 monoclonal antibody (CC-1) | Invitrogen | MA3–002 |
| MAP1LC3B/LC3B (D11) XP® rabbit mAb | Cell Signaling Technology | 3868S |
| SQSTM1/p62 (D5L7G) mouse mAb | Cell Signaling Technology | 88588S |
| Phospho-STAT3 (Tyr705) (D3A7) XP® rabbit mAb | Cell Signaling Technology | 9145S |
| GST (26H1) mouse mAb | Cell Signaling Technology | 2624S |
| K48-linkage specific polyubiquitin (D9D5) rabbit mAb | Cell Signaling Technology | 8081 |
| K63-linkage specific polyubiquitin (D7A11) rabbit mAb | Cell Signaling Technology | 5621 |
| His-Tag (D3I1O) XP® rabbit mAb | Cell Signaling Technology | 12698S |
| MKI67/Ki-67 (D3B5) rabbit mAb | Cell Signaling Technology | 2202S |
| PECAM1/CD31(D8V9E) XP® rabbit mAb | Cell Signaling Technology | 77699 |
| CD8A (D4W2Z) XP® rabbit mAb (mouse specific) | Cell Signaling Technology | 98941T |
| GZMB (granzyme B; E5V2L) rabbit mAb (mouse specific) | Cell Signaling Technology | 44153 |
| Cleaved CASP3 (Asp175) (5A1E) rabbit mAb | Cell Signaling Technology | 9664S |
| FOXP3 (D6O8R) rabbit mAb | Cell Signaling Technology | 12653S |
| MHC class I antibody | Santa Cruz Biotechnology | sc -59,199 |
| Ubiquitin antibody | Santa Cruz Biotechnology | sc-8017 |
| CANX (calnexin) antibody | Santa Cruz Biotechnology | sc -23,954 |
| MAP1LC3B/LC3B antibody | Novus Biologicals | NB100–220 |
| USP14 antibody | Novus Biologicals | NBP2–75700 |
| HSP90B1 antibody | Novus Biologicals | NB300–619 |
| Mouse monoclonal anti-FLAG (clone M2) | Sigma-Aldrich | F1804 |
| Rabbit anti-HA | Sigma-Aldrich | H6908 |
| TUBA/α-Tubulin rabbit polyclonal antibody | Beyotime | AF0001 |
| BV786 rat anti-mouse PTPRC/CD45 | BD Biosciences | 564225 |
| PE-CF594-FOXP3 | BD Biosciences | 562466 |
| APC-Cy™7 rat anti-mouse CD4 | BD Biosciences | 552051 |
| Brilliant Violet 785™ anti-mouse PTPRC/CD45 antibody | BioLegend | 103149 |
| FITC anti-mouse CD3E antibody | BioLegend | 100306 |
| Alexa Fluor® 700 anti-mouse CD3E antibody | BioLegend | 100216 |
| Brilliant Violet 510™ anti-mouse CD3E antibody | BioLegend | 100233 |
| PE/Cyanine5 anti-mouse CD3E antibody | BioLegend | 100274 |
| Brilliant Violet 605™ anti-mouse CD8A antibody | BioLegend | 100743 |
| PE/Cyanine7 anti-mouse CD8A antibody | BioLegend | 100722 |
| Brilliant Violet 421™ anti-human/mouse GZMB (granzyme B) recombinant antibody | BioLegend | 396414 |
| PerCP/Cyanine5.5 anti-human/mouse GZMB (granzyme B) recombinant antibody | BioLegend | 396412 |
| PE anti-mouse CD274/B7-H1/PD-L1 antibody | BioLegend | 124308 |
| APC anti-mouse CD274/B7-H1/PD-L1 antibody | BioLegend | 124312 |
| PE anti-human CD274/B7-H1/PD-L1 antibody | BioLegend | 329706 |
| APC anti-human CD274/B7-H1/PD-L1 antibody | BioLegend | 329707 |
| PerCP/Cyanine5.5 anti-mouse H-2Kb/H-2 Db antibody | BioLegend | 114620 |
| PE anti-mouse H-2Kd/H-2Dd antibody | BioLegend | 114708 |
| FITC anti-mouse H-2Kd antibody | BioLegend | 116606 |
| PE anti-mouse PRF1 (perforin 1) antibody | BioLegend | 154306 |
| Trustain fcX anti-mouse FCGR3/CD16-FCGR2/CD32 | BioLegend | 101320 |
| Human TruStain FcX | BioLegend | 422302 |
| CD28 monoclonal antibody | Thermo Scientific | 16-0281-82 |
| CD3E monoclonal antibody | Thermo Scientific | 16-0032-82 |
| Anti-mouse IgG (H+L), F(ab’)2 fragment (Alexa Fluor® 555 Conjugate) | Cell Signaling Technology | 4409 |
| Anti-mouse IgG (H+L), F(ab’)2 fragment (Alexa Fluor® 488 Conjugate) | Cell Signaling Technology | 4408 |
| Anti-rabbit IgG (H+L), F(ab’)2 fragment (Alexa Fluor® 555 Conjugate) | Cell Signaling Technology | 4413 |
| Anti-rabbit IgG (H+L), F(ab’)2 fragment (Alexa Fluor® 488 Conjugate) | Cell Signaling Technology | 4412 |
| HRP goat anti-rabbit IgG | Beyotime | A0208 |
| HRP Goat anti-mouse IgG | Beyotime | A0216 |
| EasyBlot anti rabbit IgG (HRP) | GeneTex | GTX221666–01 |
| EasyBlot anti mouse IgG (HRP) | GeneTex | GTX221667–01 |
| InVivoMAb anti-mouse CD279/PD-1 | BioXcell | BE0273 |
| InVivoMAb anti-mouse CD274/PD-L1 | BioXcell | BE0101 |
| InVivoMAb anti-mouse CD152/CTLA-4 | BioXcell | BE0131 |
| InVivoPlus anti-mouse CD8A | BioXcell | BP0061 |
| InVivoMAb anti-mouse KLRB1C/NK1.1 | BioXcell | BE0036 |
| InVivoMAb anti-mouse IL6R | BioXcell | BE0047 |
| Bacterial and virus strains | ||
| Usp14 shRNA lentiviral particles | Shanghai OBiO Technology | N/A |
| Atg5 shRNA lentiviral particles(h) | Santa Cruz Biotechnology | sc -41,445-V |
| Atg5 shRNA lentiviral particles(m) | Santa Cruz Biotechnology | sc -41,446-V |
| Control shRNA lentiviral particles | Santa Cruz Biotechnology | sc -108,080 |
| Biological samples | ||
| Paraffin sections from patients with PDAC | The First Affiliated Hospital, School of Medicine, Zhejiang University | Ethics board approval |
| Human PDAC tissue microarrays | The First Affiliated Hospital, School of Medicine, Zhejiang UniversityN/A | N/A |
| Paraffin sections from patients with KPC (KRASG12D; TRP53R172H; PDX1-Cre) |
N/A | |
| Chemicals, peptides, and recombinant proteins | ||
| Leukocyte activation cocktail | BD biosciences | 550583 |
| Lying buffer | BD biosciences | 555899 |
| Percoll solution | GE healthcare | 17-0891-01 |
| Collagenase IV | Thermo Fisher Scientific | 17104019 |
| Dispase | Gibco | 17105041 |
| DNase | Sigma-Aldrich | D5025 |
| Cycloheximide | Sigma-Aldrich | 239763-M |
| Calcium chloride solution | Sigma-Aldrich | 21115 |
| MG132 | Sigma-Aldrich | M8699 |
| Chloroquine phosphate | Sigma-Aldrich | PHR1258 |
| Tamoxifen | Sigma-Aldrich | T5648-1 G |
| Blasticidin | Sigma-Aldrich | SBR00022 |
| ATRA | Sigma-Aldrich | PHR1187 |
| Ultracruz transfection reagent | Santa Cruz Biotechnology | sc -395,739 |
| Polybrene | Santa Cruz Biotechnology | sc -134,220 |
| Plasmid transfection medium | Santa Cruz Biotechnology | sc -108,062 |
| Protein A/G PLUS-agarose | Santa Cruz Biotechnology | sc-2003 |
| Lipofectamine 3000 | Life Technologies | L3000–075 |
| jetPRIME® transfection reagent | Polyplus | 101000046 |
| Puromycin | Invivogen | ant-pr-1 |
| Protease inhibitor cocktail | Bimake | B14001 |
| Phosphatase inhibitor cocktail | Bimake | B15001 |
| IP/western lysing | Beyotime | P0013 |
| IU1 | Selleck | S7134 |
| Eeyarestatin I | APExBio | B7535 |
| D-luciferin | Goldbio | 115144-35-9 |
| Recombinant human IL6 | PeproTech | 200–06 |
| Recombinant murine IL6 | PeproTech | 216–16 |
| Recombinant murine IL2 | PeproTech | 212–12 |
| Recombinant human EGF | PeproTech | 100–15 |
| Recombinant human FGF | PeproTech | 100–18 |
| Recombinant human GST | Abcam | ab70456 |
| CD274/PDL1 fusion protein | Proteintech | ag12432 |
| USP14 fusion protein | Proteintech | ag6312 |
| Corn oil | abmole | M9109 |
| Tocilizumab | MCE | HY-P9917 |
| Lecithin | aladdin | L105732 |
| DiD | Boster Biotech | 40758ES25 |
| DiO | Boster Biotech | 40725ES10 |
| Gemcitabine (LY-188011) HCl | Selleck | S1149 |
| Matrigel | Corning | 356231 |
| Critical commercial assays | ||
| Fixation/Permeabilization solution kit | BD biosciences | 555028 |
| Fixable viability stain 780 | BD biosciences | 565388 |
| 7-AAD | BD biosciences | 559925 |
| DAB chromogen kit | Biocare | BDB2004 |
| Picrosirius red staining kit | Polysciences | 24901 |
| LIVE/DEAD™ fixable violet dead cell stain kit, for 405 nm excitation | Thermo Fisher Scientific | L34955 |
| Pierce GST protein interaction pull-down kit | Thermo Fisher Scientific | 21516 |
| MidiMACS™ separator and starting kits | Miltenyibiotec | 130-042-301 |
| CD8A+ T cell isolation kit, mouse | Miltenyibiotec | 130-096-495 |
| Dual luciferase reporter gene assay kit | Beyotime | RG027 |
| ChIP assay kit | Beyotime | P2078 |
| MolPure® cell/tissue total RNA kit | Yeasen Biotechnology | 19221ES50 |
| Duolink in situ red assay | Sigma-Aldrich | DUO92101 |
| Cell fractionation kit | Cell Signaling Technology | 9038 |
| ER enrichment kit | Novus Biologicals | NBP2–29482 |
| Deposited data | ||
| Raw data | This paper | |
| mRNA-seq | This paper | |
| LC-MS | This paper | |
| Experimental models: Cell lines | ||
| PANC-1 | ATCC | CRL-1469 |
| SW1990 | ATCC | CRL-2172 |
| BxPC-3 | ATCC | CRL-1687 |
| Panc02 | ATCC | CRL-2553 |
| KPC | KrasG12D; Trp53R172H; Pdx1-Cre (KPC) mice | N/A |
| MSCs | SinoCell Technology Ltd | N/A |
| CAFs | This paper | N/A |
| Experimental models: Organisms/strains | ||
| C57BL/6 | Model animal research center of Nanjing University | N/A |
| Nude mice | Model animal research center of Nanjing University | N/A |
| KRASG12D; TRP53R172H; PDX1-Cre (KPC) mice | N/A | |
| Oligonucleotides | ||
| Human CD274 primers Forward: TGGCATTTGCTGAACGCATTT |
Sunya Biotech | N/A |
| Human CD274 primers Reverse: TGCAGCCAGGTCTAATTGTTTT |
Sunya Biotech | N/A |
| Mouse Cd274 primers Forward: GCTCCAAAGGACTTGTACGTG |
Sunya Biotech | N/A |
| Mouse Cd274 primers Reverse: TGATCTGAAGGGCAGCATTTC |
Sunya Biotech | N/A |
| Human USP14 primers Forward: AGAAGCAGACCACTCTGTGC |
Sunya Biotech | N/A |
| Human USP14 primers Reverse: AGGGCAGCACAATCCAAAGA |
Sunya Biotech | N/A |
| Mouse Usp14 primers Forward: GCCGGTTTGAATGAGGCTTG |
Sunya Biotech | N/A |
| Mouse Usp14 primers Reverse: TCAACGCACCTGCATACCTT |
Sunya Biotech | N/A |
| Recombinant DNA | ||
| pGL4.10-USP14 promotor (WT) | Shanghai OBiO Technology | N/A |
| pGL4.10-USP14 promotor (MUT) | Shanghai OBiO Technology | N/A |
| GL135-USP14 | Shanghai OBiO Technology | N/A |
| WT GFP-CD274 | Shanghai OBiO Technology | N/A |
| GFP-CD274K271R | This paper | N/A |
| GFP-CD274K280R | This paper | N/A |
| STAT3 cDNA ORF Clone | sinobiological | HG10034-CF |
| Software and algorithms | ||
| ImageJ | NIH | https://imagej.nih.gov/ij/ |
| GraphPad Prism 7.0 | GraphPad Software | https://www.graphpad.com/scientific-software/prism/ |
| FlowJo 10.0 | TreeStar | N/A |
Lentiviral transduction and production of stable cell lines
CAFs at 50% − 70% confluence were transiently transfected with human/mouse ATG5/Atg5 shRNA lentiviral particles with polybrene (Santa Cruz Biotechnology, sc -134,220) at a final concentration of 5 μg/mL. After transfection for 24 h, the culture medium was removed and replaced with 1 mL complete medium (without Polybrene). Cells were split 48 h after transfection and stable clones were selected that expressed shRNA by puromycin (1 mg/mL) selection for five days.
For the human/mouse PDAC, Usp14 knockdown, and overexpressing stable cell lines, a lentivirus was produced by the co-transfection of HEK293FT cells with a lentiviral human/mouse USP14/Usp14 shRNA/overexpression plasmid and the packaging plasmids psPAX2 (Addgene, plasmid 12,260; deposited by Didier Trono) and pMD2.G (Addgene, plasmid 12,259; deposited by Didier Trono) at a 0.5:0.25:0.25 ratio. Transfection was performed using a jetPRIME® transfection reagent (Polyplus 101,000,046) according to the manufacturer’s instructions.
The efficiency of transfection was confirmed by an immunoblotting analysis and RT-PCR for the level of protein and mRNA expression.
ChIP assay
A ChIP assay was performed with lysates prepared from SW1990 and PANC-1, using a ChIP Assay Kit (Beyotime, P2078) according to the manufacturer’s instructions.
Flow cytometric analysis
For surface and intracellular CD274 and MHC-I staining of human and mouse cell lines, the cells were stained with PE/APC-anti-Human/Mouse CD274 antibodies after blocking using a TruStain FcX™ (BioLegend 422,302) antibody or Human TruStain FcX (BioLegend 164,002) at a 1:200 dilution for 30 min at 4°C in the dark and washed with FACS buffer (PBS plus 2% FBS and 2 mM EDTA). For cell-surface MHC-1 staining of human and mouse cells, single-cell suspensions and staining were prepared as described above. Dead cells were depleted by 7-AAD (BD biosciences 559,925) staining. The tumor immunophenotyping of tumor sample tissues as described previously [18,29]. To confirm immune cell depletion, the mouse spleens were mechanically ground with a grinding rod and filtered through a 40-μm cell strainers. The resuspended live single cells were stained separately using a LIVE/DEAD Fixable Violet Dead Cell Staining Kit and blocked using TruStain FcX™ after the red blood cells were removed using 1× lysis buffer (BD biosciences 555,899). Finally, cells were stained for CD8+ T cell markers (PTPRC/CD45, CD3E and CD8A), and NK cells markers (ITGA2/CD49b and KLRB1C/NK1.1). All samples were analyzed by BD LSRFortessa (BD biosciences) and the data were further analyzed by FlowJo software (Becton Dickinson).
CyTOF analysis of tumor tissues
PLTTech Inc. (Hangzhou, China) performed CyTOF analyses following a previously published protocol [32].
Quantitative real-time PCR analysis
The purification of high-quality RNA from cells was performed using a MolPure® Cell/Tissue Total RNA Kit (Yeasen Biotechnology, 19221ES50) in accordance with the manufacturer’s protocol. Samples were analyzed in triplicate. A quantitative real-time PCR (qPCR) analysis was conducted in a 20 μL reaction using a real-time PCR machine (Applied Biosystems 7500 Fast Real-Time PCR System) (Applied Biosystems) with TB Green Premix Ex Taq™ II (Takara, RR820A).
Immunoblotting analysis (IB)
Cell extracts were prepared as previously described [18]. SDS-PAGE and immunoblotting were conducted using standard methods with different antibodies as described in Table 1. Signals from the immunoreactive proteins were detected using ECL Detection Reagent (Merck Millipore, WBKLS0050) and the corresponding bands were visualized using ChemiScopeTouch (Clinx Science Instruments).
Immunoprecipitation analysis (IP)
Cultured cells were lysed in IP/WB lysis buffer (Beyotime, P0013) containing a Protease Inhibitor Cocktail and Phosphatase Inhibitor Cocktail for 30–40 min at 4°C and centrifuged at 12,000 × g for 15 min to remove any debris. Lysates were subjected to immunoprecipitation with antibodies, incubated with a primary antibody for 4 6 h, followed by the addition of Protein A/G PLUS-Agarose (Santa Cruz Biotechnology, sc-2003) and incubation for 2–4 h at 30 rpm at 4°C. After washing three times in washing buffer (10% IP/western lysing in PBS), the protein samples were heated at 100°C in NuPAGE LDS Sample Buffer (4×) (Thermo Fisher Scientific, NP0007) for 5–10 min, and immunoblot analysis as described above.
GST affinity-isolation assay
Commercial recombinant human GST (Abcam, ab70456), CD274-GST (Proteintech, ag12432), and USP14-His (Proteintech, ag6312) were subjected to a GST affinity-isolation assay. The conjugation of GST and CD274-GST with glutathione beads and affinity-isolation assay were performed using a Pierce GST Protein Interaction Pull-Down Kit (Thermo Fisher Scientific 21,516) according to the manufacturer’s instructions.
In vitro deubiquitination assays
HEK293T cells were co-transfected with K48- or K63-specific linkage His-ubiquitin plasmids and Flag-tagged CD274 plasmids. After a 48-h transfection, immunoprecipitation was performed to obtain ubiquitinated CD274, which was enriched using anti-Flag antibodies with agarose beads after treatment with MG132 (50 μM). The beads were washed three times using deubiquitinating buffer (4% glycerol, 5 mM MgCl2, 60 mM HEPES, pH 7.6) and incubated with recombinant His-USP14 proteins at 37°C for 3–6 h. The mixtures were heated at 100°C for 5 min in 1 × SDS loading buffer and analyzed by an immunoblot analysis.
Duolink proximity ligation assay (PLA)
A Duolink proximity ligation assay between USP14 and CD274 performed by Duolink In Situ PLA kit (Sigma-Aldrich, DUO92101) according to the manufacturer’s instructions.
Dual luciferase Reporter assay
Tumor cells were seeded into 96-well plates with at 50%-70% confluency and then transfected into five copies using Lipofectamine 3000 (Life Technologies, L3000–075) according to the manufacturer’s manual. In detail, 150 ng of each experimental plasmid (pGL4.10 empty vector, pENTER empty vector, pGL4.10-USP14, pENTER STAT3 or pGL4.10-USP14-STAT3 mutation vector [Shanghai OBiO Technology]) and 7.5 ng of the Renilla pRL-SV40P plasmid (Addgene, plasmid 27,163; deposited by Ron Prywes) used for normalization per well. Tocilizumab (50 ng/mL) was added after an overnight transfection. After a 24 h culture, the relative luciferase units (RLUs) were measured in both the un-treated and tocilizumab-treated cells (50 ng/mL; MCE, HY-P9917) using the Dual Luciferase Reporter Gene Assay Kit (Beyotime, RG027) according to the manufacturer’s instructions.
Endoplasmic reticulum enrichment and cell fractionation
Endoplasmic reticulum enrichment of pancreatic cancer cells was performed using an ER enrichment kit (Novus Biologicals, NBP2–29482) according to the manufacturer’s instructions. The cytoplasmic fraction and nuclear fraction of pancreatic cancer cells was performed using the Cell Fractionation Kit (Cell Signaling Technology, 9038) in accordance with the manufacturer’s instructions. All cell fractions were boiled with 1× SDS loading buffer and analyzed by immunoblotting.
Proteomic and ubiqutinproteomic analysis of pancreatic cancer cells
Mass spectrometry analysis was performed by PTM-Biolabs Co., Ltd. (Hangzhou, China). The experimental protocol was conducted as previously described [18].
Histology and immunohistochemistry analysis (IHC)
H&E staining was performed using a hematoxylin-eosin/HE Staining Kit (Solarbio Life Science, G1120) according to the manufacturer’s instructions.
For immunohistochemical staining, the antigen was retrieved using a Sodium Citrate Antigen Retrieval Solution (Solarbio Life Science, C1031) and boiled for 10 min, followed by standing at 65°C for 30 min. Endogenous peroxidase activity was blocked by an incubation with 3% hydrogen for 20 min. After blocking with 3% BSA for 30 min at room temperature (RT), the sections were incubated with antibodies, as indicated, in primary antibody Dilution buffer (Beyotime, P0023) overnight at 4°C. The sections were incubated with HRP-conjugated secondary antibodies (Mouse IgG, Beyotime, A0216 or Rabbit IgG, Beyotime, A0208) for 60 min at RT. Visualization of the target protein was performed using a diaminobenzidine (DAB) Chromogen Kit (Biocare, BDB2004), in which the presence of the brown color indicates detection of the targeted molecule. Counterstaining was performed with hematoxylin. Bright light images were obtained using ImageScope software (Leica Biosystems).
Sirius red staining was performed using a Picrosirius Red Staining Kit (Polysciences 24,901) according to the manufacturer’s instructions.
Multiplex immunohistochemistry (mIHC)
To revealed MAP1LC3B, ATG5 and SQSTM1 staining intensity in CAFs (ACTA2+ and FAP+) in pancreatic cancer, multiplex IHC was performed. We adopted Opal PolarisTM 7-color Manual IHC Kit (Akoya, NEL861001KT) according to manufacturer’s instructions. After DAPI staining, the visualization of opal slides was performed by Vectra Polaris Quantitative Pathology Imaging Systems (Akoya).
Immunofluorescence analysis (IF)
Cultured cells were seeded onto a cover glass (NEST 801,007) at ap proximately 50% − 60% confluency. After treatment, the cells were fixed by 4% PFA for 20–30 min, and washed three times with PBS, each time for 3 min. The cells were then permeabilized with 0.1% Triton X-100 (Beyotime, P0096) for 15 min and blocked in Blocking Buffer (Beyotime, P0260) for 30 min at RT. After deparaffinization and antigen retrieval, the sections were blocked with Blocking Buffer for 30 min at RT. An immunofluorescence analysis of human PDAC tumor tissue sections, the primary antibodies, as indicated, were diluted in primary antibody dilution bufferand incubated on slides for overnight at 4°C. Secondary antibodies were diluted in PBS (1:400) and incubated for 40 min at RT in dark. Staining with 20 mg/mL DAPI was used to label the nucleus of the cells. Fluorescent images were obtained with Leica TCS SP8 and analyzed using LAS X software.
T Cell-Mediated tumor Cell Killing Assay
CD8+ T cells were isolated from the mouse spleen using a CD8+ T Cell Isolation Kit (Miltenyibiotec, 130-096-495), a LS Column, and MidiMACS™ Separator (Miltenyibiotec, 130-042-301) according to the manufacturer’s instructions. Isolated CD8+ T cells were fluorescently stained with PTPRC/CD45-APC, CD3E-FITC, and CD8A-PE and analyzed and confirmed using flow cytometry. CD8A+ T cells were activated by a CD3/CD28 monoclonal antibody (100 ng/mL, Thermo Scientific, 11456D) and recombinant murine IL2 (10 ng/mL, PeproTech, 212–12) in RPMI-1640 supplemented with 10% FBS and 1% antibiotic mixture for three days. Cancer cells were permitted to adhere to the plates overnight and then incubated for 48 h with activated T cells after coculturing with WT or Atg5 KD CAFs treated with or without tocilizumab. The ratio between tumor cells and activated CD8+ T cells was 1:8–1:10. T cells and cell debris were removed and washed three times using PBS. The remaining living cancer cells were fixed with 4% paraformaldehyde, stained with 0.5% crystal violet, and quantified using a spectrometer at OD 570 nm.
Preparation of MSC-Lipo and chloroquine diphosphate-loaded MSC-Lipo
The MSC membrane was isolated from MSCs by freeze-thawing for 3 cycles and centrifuging [23,24]. Liposomes were prepared by the thin film dispersion method. The mixture with a weight ratio of phospholipid to MSC membrane protein at 1:0.5 was fused by ultrasonic cell disrupter (SCIENTZ-IID, Ningbo Scientz Biotechnology Co., Ltd.) with a power parameter of 30 w for 3 min and 2 times to obtain MSC-Lipo [23].
The pH gradient method was applied for encapsulating CQ [32]. Liposome and MSC-Lipo with an internal phase pH of 3.6 (adjusted by HCl) were prepared. CQ was added to the external phase with a pH of 7.0 and incubated for 4 h, with an input weight ratio of phosphatidylcholine to CQ at 10:1.
For DiD-MSC-Lipo and DiD-DiO-MSC-Lipo, DiD (Boster Biotech., 40758ES25) was dissolved in phosphatidylcholine solution before film-forming, and DiO (Boster Biotech., 40725ES10) dyed MSC membrane at 37°C for 30 min.
Characterization of MSC-Lipo and chloroquine diphosphate-loaded MSC-Lipo
TEM (Thermo Scientific, Talos L120C) was utilized to characterize the morphology of formulations. The MSC marker, ENG/CD105, THY1/CD90, and CD44 were analyzed by western blot. The whole protein content of formulations was analyzed by SDS-PAGE. The size and zeta potential of formulations were measured by dynamic light scattering (Mastersizer 2000) analysis.
For the colocalization of liposome and MSC membrane, KPC were treated with 0.2 mg/mL DiD-DiO-MSC-Lipo for 6 h. Then, KPC were fixed and observed under CLSM (Olympus, IX83-FV3000).
Centrifugal filter devices (Amicon® Ultracel-10, Millipore, 10-kDa molecular weight cutoff) was used to separate free CQ (Wfree) after centrifuging at 1,500 g for 30 min [33]. Wtotal was calculated by demulsifying CQ loaded MSC-Lipo with methanol. CQ was determined at 343 nm by double-beam UV/Vis Spectrophotometer (Beijing Purkinje General Instrument Co., Ltd., TU-1900). Encapsulation efficiency (%)=(Wtotal-Wfree)/Wtotal ×100%.
Statistical analysis
Molecular biology and biochemical experiments in vitro were routinely repeated at least three times. To compare the differences between the two groups, we used Mann-Whitney U or two-sided Student’s t-tests as appropriate. We used a Spearman’s rank correlation to analyze the correlation between variables. The overall difference in the data at the endpoint was assessed using Student’s t-tests to evaluate the tumor growth. The Kaplan-Meier method and Gehan-Breslow-Wilcoxon test were used to detect difference in survival curves between groups. The GraphPad Prism software program (GraphPad Inc., La Jolla, CA, USA; version 7.0) was used to perform the statistical analyses. Results are presented as mean ± SD. Differences of *p < 0.05; **p < 0.01; ***p = 0.001; and ****p < 0.001were considered statistically significant.
Supplementary Material
Funding Statement
This work was supported by grants from the National Key Research and Development Program [2019YFC1316000 to TBL]; the National Natural Science Foundation of China [U20A20378, 82188102 and 81830089 to TBL, 81871925 and 82071867 to XLB]; the Key Research and Development Program of Zhejiang Province [2019C03019 to TBL, 2020C03117 to XLB]; the Fundamental Research Funds for the Zhejiang Provincial Universities [2021XZZX031 to XLB]; and the Natural Science Foundation of Zhejiang Province (LD22H300002 to JQG)
Disclosure statement
No potential conflict of interest was reported by the author(s).
Ethics approval and consent to participate
All animal work was approved by IACUC of the First Affiliated Hospital, School of Medicine, Zhejiang University. The human PDAC tumor samples used in this paper were collected from the Department of Hepatobiliary and Pancreatic Surgery, the First Affiliated Hospital, School of Medicine, Zhejiang University. The study protocol was approved by the Institutional Review Board of First Affiliated Hospital, School of Medicine, Zhejiang University. All tissue samples were collected in compliance with the informed consent policy.
Data availability statement
The data generated in this study are available within the article.
Supplementary material
Supplemental data for this article can be accessed online at https://doi.org/10.1080/15548627.2023.2300913
References
- [1].Kleeff J, Korc M, Apte M, et al. Pancreatic cancer. Nat Rev Dis Primers. 2016;2(1). doi: 10.1038/nrdp.2016.22 [DOI] [PubMed] [Google Scholar]
- [2].Ho WJ, Jaffee EM, Zheng L.. The tumour microenvironment in pancreatic cancer — clinical challenges and opportunities. Nat Rev Clin Oncol. 2020. Sep 01;17(9):527–540. [DOI] [PMC free article] [PubMed] [Google Scholar]
- [3].Binnewies M, Roberts EW, Kersten K, et al. Understanding the tumor immune microenvironment (TIME) for effective therapy. Nature Med. 2018. May 01;24(5):541–550. doi: 10.1038/s41591-018-0014-x [DOI] [PMC free article] [PubMed] [Google Scholar]
- [4].Emens LA, Cruz C, Eder JP, et al. Long-term clinical outcomes and biomarker analyses of atezolizumab therapy for patients with metastatic triple-negative breast cancer: a phase 1 study. JAMA Oncol. 2019 Jan 1;5(1):74–82. doi: 10.1001/jamaoncol.2018.4224 [DOI] [PMC free article] [PubMed] [Google Scholar]
- [5].Garon EB, Rizvi NA, Hui R, et al. Pembrolizumab for the treatment of non-small-cell lung cancer. N Engl J Med. 2015 May 21;372(21):2018–2028. doi: 10.1056/NEJMoa1501824 [DOI] [PubMed] [Google Scholar]
- [6].Zhu AX, Finn RS, Edeline J, et al. Pembrolizumab in patients with advanced hepatocellular carcinoma previously treated with sorafenib (KEYNOTE-224): a non-randomised, open-label phase 2 trial. Lancet Oncol. 2018. Jul;19(7):940–952. [DOI] [PubMed] [Google Scholar]
- [7].Kim TK, Vandsemb EN, Herbst RS, et al. Adaptive immune resistance at the tumor site: mechanisms and therapeutic opportunities. Nat Rev Drug Discov. 2022. Jul;21(7):529–540. [DOI] [PubMed] [Google Scholar]
- [8].Zhang Y, Chen L. Classification of sed on Tumor Immunity in the MicroEnvironment (TIME) for cancer immunotherapy. JAMA Oncol. 2016 Nov 1;2(11):1403–1404. doi: 10.1001/jamaoncol.2016.2450 [DOI] [PMC free article] [PubMed] [Google Scholar]
- [9].O’Reilly EM, Oh DY, Dhani N, et al. Durvalumab with or without tremelimumab for patients with metastatic pancreatic ductal adenocarcinoma: a phase 2 randomized clinical trial. JAMA Oncol. 2019 Oct 1;5(10):1431–1438. doi: 10.1001/jamaoncol.2019.1588 [DOI] [PMC free article] [PubMed] [Google Scholar]
- [10].Brahmer JR, Tykodi SS, Chow LQ, et al. Safety and activity of anti-PDL1 antibody in patients with advanced cancer. N Engl J Med. 2012 Jun 28;366(26):2455–2465. doi: 10.1056/NEJMoa1200694 [DOI] [PMC free article] [PubMed] [Google Scholar]
- [11].Sahai E, Astsaturov I, Cukierman E, et al. A framework for advancing our understanding of cancer-associated fibroblasts. Nat Rev Cancer. 2020. Mar 01;20(3):174–186. doi: 10.1038/s41568-019-0238-1 [DOI] [PMC free article] [PubMed] [Google Scholar]
- [12].Whittle MC, Hingorani SR. Fibroblasts in Pancreatic Ductal Adenocarcinoma: Biological Mechanisms and Therapeutic Targets. Gastroenterology. 2019. May 01;156(7):2085–2096. [DOI] [PMC free article] [PubMed] [Google Scholar]
- [13].Ge W, Yue M, Lin R, et al. PLA2G2A+ cancer-associated fibroblasts mediate pancreatic cancer immune escape via impeding antitumor immune response of CD8+ cytotoxic T cells. Cancer Lett. 2023. Apr 01;558:216095. Epub 2023 Feb 10.1016/j.canlet.2023.216095. [DOI] [PubMed] [Google Scholar]
- [14].Amaravadi RK, Kimmelman AC, Debnath J. Targeting autophagy in cancer: recent advances and future directions. Cancer Discovery. 2019. SEP;9(9):1167–1181. doi: 10.1158/2159-8290.CD-19-0292 [DOI] [PMC free article] [PubMed] [Google Scholar]
- [15].Kimmelman AC, White E. Autophagy and Tumor Metabolism. Cell Metab. 2017. MAY 2;25(5):1037–1043. [DOI] [PMC free article] [PubMed] [Google Scholar]
- [16].Rudnick JA, Monkkonen T, Mar FA, et al. Autophagy in stromal fibroblasts promotes tumor desmoplasia and mammary tumorigenesis. Genes Dev. 2021 Jul 1;35(13–14):963–975. doi: 10.1101/gad.345629.120 [DOI] [PMC free article] [PubMed] [Google Scholar]
- [17].Endo S, Nakata K, Ohuchida K, et al. Autophagy is required for activation of pancreatic stellate cells, associated with pancreatic cancer progression and promotes growth of pancreatic tumors in mice. Gastroenterology. 2017. May;152(6):1492±. [DOI] [PubMed] [Google Scholar]
- [18].Zhang X, Huang X, Xu J, et al. NEK2 inhibition triggers anti-pancreatic cancer immunity by targeting PDL1. Nat Commun. 2021 Jul 27;12(1):4536. doi: 10.1038/s41467-021-24769-3 [DOI] [PMC free article] [PubMed] [Google Scholar]
- [19].Zhang X, Lao M, Xu J, et al. Combination cancer immunotherapy targeting TNFR2 and PD1/PDL1 signaling reduces immunosuppressive effects in the microenvironment of pancreatic tumors. J Immunother Cancer. 2022. Mar;10(3):e003982. [DOI] [PMC free article] [PubMed] [Google Scholar]
- [20].Yamamoto K, Venida A, Yano J, et al. Autophagy promotes immune evasion of pancreatic cancer by degrading MHC-I. Nature. 2020. May;581(7806):100–105. [DOI] [PMC free article] [PubMed] [Google Scholar]
- [21].Chan LC, Li CW, Xia W, et al. IL6/JAK1 pathway drives PDL1 Y112 phosphorylation to promote cancer immune evasion. J Clin Invest. 2019 Jul 15;130:3324–3338. doi: 10.1172/JCI126022 [DOI] [PMC free article] [PubMed] [Google Scholar]
- [22].Wen M, Cao Y, Wu B, et al. PDL1 degradation is regulated by electrostatic membrane association of its cytoplasmic domain. Nat Commun. 2021 Aug 24;12(1):5106. doi: 10.1038/s41467-021-25416-7 [DOI] [PMC free article] [PubMed] [Google Scholar]
- [23].Wu H, Jiang X, Li Y, et al. Engineering stem cell derived biomimetic vesicles for versatility and effective targeted delivery. Adv Funct Mater. 2020;30(49):2006169. doi: 10.1002/adfm.202006169 [DOI] [Google Scholar]
- [24].Li YS, Wu HH, Jiang XC, et al. Active stealth and self-positioning biomimetic vehicles achieved effective antitumor therapy. J Control Release. 2021 Jul 10;335:515–526. doi: 10.1016/j.jconrel.2021.05.031 [DOI] [PubMed] [Google Scholar]
- [25].Elyada E, Bolisetty M, Laise P, et al. Cross-species single-cell analysis of pancreatic ductal adenocarcinoma reveals antigen-presenting cancer-associated fibroblasts. Cancer Discov. 2019. Aug;9(8):1102–1123. [DOI] [PMC free article] [PubMed] [Google Scholar]
- [26].Öhlund D, Handly-Santana A, Biffi G, et al. Distinct populations of inflammatory fibroblasts and myofibroblasts in pancreatic cancer. J Exp Med. 2017 Mar 6;214(3):579–596. doi: 10.1084/jem.20162024 [DOI] [PMC free article] [PubMed] [Google Scholar]
- [27].New J, Arnold L, Ananth M, et al. Secretory autophagy in cancer-associated fibroblasts promotes head and neck cancer progression and offers a novel therapeutic target. Cancer Res. 2017. Dec;77(23):6679–6691. [DOI] [PMC free article] [PubMed] [Google Scholar]
- [28].Huang X, Zhang Q, Lou Y, et al. USP22 deubiquitinates CD274 to suppress anti-cancer immunity. Cancer Immunol Res. 2019 Aug 9;7(10):1580–1590. doi: 10.1158/2326-6066.CIR-18-0910 [DOI] [PubMed] [Google Scholar]
- [29].Koikawa K, Kibe S, Suizu F, et al. Targeting Pin1 renders pancreatic cancer eradicable by synergizing with immunochemotherapy. Cell. 2021 Sep 2;184(18):4753–4771.e27. doi: 10.1016/j.cell.2021.07.020 [DOI] [PMC free article] [PubMed] [Google Scholar]
- [30].Liu H, Kuang X, Zhang Y, et al. ADORA1 inhibition promotes tumor immune evasion by regulating the ATF3-PDL1 Axis. Cancer Cell. 2020 Mar 16;37(3):324–339.e8. doi: 10.1016/j.ccell.2020.02.006 [DOI] [PubMed] [Google Scholar]
- [31].Karasic TB, O’Hara MH, Loaiza-Bonilla A, et al. Effect of Gemcitabine and nab-paclitaxel with or without hydroxychloroquine on patients with advanced pancreatic cancer: a phase 2 randomized clinical trial. JAMA Oncol. 2019 Jul 1;5(7):993–998. doi: 10.1001/jamaoncol.2019.0684 [DOI] [PMC free article] [PubMed] [Google Scholar]
- [32].Han G, Spitzer MH, Bendall SC, et al. Metal-isotope-tagged monoclonal antibodies for high-dimensional mass cytometry. Nat Protoc. 2018. Oct;13(10):2121–2148. [DOI] [PMC free article] [PubMed] [Google Scholar]
- [33].Nazhad Dolatabadi J E, Hamishehkar H, Eskandani M, et al. Formulation, characterization and cytotoxicity studies of alendronate sodium-loaded solid lipid nanoparticles. Colloids Surf B Biointerfaces. 2014 May 1;117:21–28. doi: 10.1016/j.colsurfb.2014.01.055 [DOI] [PubMed] [Google Scholar]
Associated Data
This section collects any data citations, data availability statements, or supplementary materials included in this article.
Supplementary Materials
Data Availability Statement
The data generated in this study are available within the article.