

ABSTRACT
Macroautophagy/autophagy-mediated anoikis resistance is crucial for tumor metastasis. As a key autophagy-related protein, ATG4B has been demonstrated to be a prospective anti-tumor target. However, the existing ATG4B inhibitors are still far from clinical application, especially for tumor metastasis. In this study, we identified a novel circRNA, circSPECC1, that interacted with ATG4B. CircSPECC1 facilitated liquid-liquid phase separation of ATG4B, which boosted the ubiquitination and degradation of ATG4B in gastric cancer (GC) cells. Thus, pharmacological addition of circSPECC1 may serve as an innovative approach to suppress autophagy by targeting ATG4B. Specifically, the circSPECC1 underwent significant m6A modification in GC cells and was subsequently recognized and suppressed by the m6A reader protein ELAVL1/HuR. The activation of the ELAVL1-circSPECC1-ATG4B pathway was demonstrated to mediate anoikis resistance in GC cells. Moreover, we also verified that the above pathway was closely related to metastasis in tissues from GC patients. Furthermore, we determined that the FDA-approved compound lopinavir efficiently enhanced anoikis and prevented metastasis by eliminating repression of ELAVL1 on circSPECC1. In summary, this study provides novel insights into ATG4B-mediated autophagy and introduces a viable clinical inhibitor of autophagy, which may be beneficial for the treatment of GC with metastasis.
KEYWORDS: ATG4B, circSPECC1, ELAVL1, gastric cancer, m6A, metastasis
Introduction
Metastasis is a major cause of deaths in gastric cancer (GC) patients [1–3]. The initial step in cancer metastasis is the intravasation of tumor cells into the systemic circulation [4]. Considering the absence of ECM in circulatory system and the occurrence of programmed cell death when cells detached from ECM (i.e., anoikis) [5], the survival of tumor cells in the vascular system is essential for metastasis. Therefore, anoikis resistance of tumor cells is a prerequisite for their dissemination and distant colonization [6,7]. Previous studies have shown that MYH9-CTNNB1, CEBPB-PDGFB and TCF7L2-PLAUR signal pathways can regulate the anoikis of GC cells [8–10]. However, there are still no efficient treatments to prevent GC metastasis so far. To this end, further study on the molecular mechanism of GC cells anoikis resistance is urgent, which may provide more effective biomarkers and targets for better diagnosis and treatment for GC metastasis.
Autophagy is a highly conserved lysosome-mediated catabolic process in Eukarya, which is crucial for the maintenance of cellular or tissue homeostasis. Previous studies have indicated that, detachment strongly induces autophagy in epithelial cells and inhibiting detachment-induced autophagy leads to increased apoptosis [5,11,12]. Similar phenomena have also been observed in some solid tumors. For example, in glioma, prostate cancer and hepatocellular carcinoma, autophagy promotes metastasis by inhibiting anoikis [13–17]. However, the mechanism of increased autophagic flux in anoikis resistant GC cells is still unknown.
Autophagy is mediated by a series of ATG (autophagy related) gene products, and ATG4B is crucial for both lipidation and delipidation of MAP1LC3/LC3 [18–20], which is important for phagophore expansion and autophagosome maturation [21–23]. Our previous studies have shown that ATG4B expression can be enhanced by HSF1 [24], suppressed by MIR34C-5p [25], phosphorylated by AKT at Ser34 [26], acetylated by EP300/p300 and deacetylated by SIRT2 at K39 [27], mediating autophagy changes and being involved in tumor progression. Furthermore, multiple studies have shown that ATG4B is overexpressed in a variety of tumors and is identified as a promising therapeutic target for cancer [28–30]. Recent research declares that although the atg4b knockout mice are viable and fertile, these mice are susceptible to diabetes, muscle atrophy and myocardial damage [31]. Hence, further research on the mechanism of regulating ATG4B is required, which may provide a new insight to reduce the side-effect of directly targeting ATG4B.
In addition to binding with proteins, RBP2GO analysis displayed that ATG4B may also interact with RNAs [32], indicating that ATG4B may be a novel RNA-binding protein (RBP). Besides, recent researches have reported that binding with RNA can promote liquid-liquid phase separation (LLPS) of RBPs [33,34]. LLPS refers to the formation of aggregates through intermolecular interactions or disordered regions within proteins, providing a compartmentalized reaction space for various life activities within cells [33,35]. Proteins prone to LLPS seem to be enriched in residues that are targeted by post-translational modifications (PTMs) [36], such as ubiquitination [37]. Therefore, determining whether ATG4B is an RBP and analyzing the function of RNA binding to ATG4B may reveal a novel mechanism for regulating ATG4B, which could provide a new insight for anti-tumor strategies by targeting ATG4B.
In this study, we firstly confirmed that ATG4B was a novel RBP. CircSPECC1 physically interacted with ATG4B, accelerating its LLPS and promoting its ubiquitination subsequently. Therefore, the abnormal reduction of circSPECC1 should be accountable for the enhanced autophagic flux and thus anoikis resistance of GC cells. In addition, the increased expression of m6A reader ELAVL1/HuR was responsible for the reduction of circSPECC1. Taken together, these results for the first time revealed the existence of ELAVL1-circSPECC1-ATG4B signaling pathway in metastatic GC cells. Using molecular docking and virtual screening, we identified the FDA-approved lopinavir impaired autophagy and enhanced anoikis by raising circSPECC1. Our research provides a novel insight for preventing metastasis by targeting ATG4B, which may be beneficial to improve overall survival for patients with GC.
Results
CircSPECC1 physically interacts with ATG4B
Given that ATG4B may be a novel RBP, RIP-seq was performed to identify the potential RNAs that may interact with ATG4B. The result showed for the first time that multiple RNAs were captured by ATG4B protein, including mRNAs, lncRNAs and circRNAs. RBP2GO analysis suggests that ATG4B is more inclined to bind with non-polyA tailed RNA [32]. Considering that circRNAs have more advantages as biomarker for disease diagnosis and treatment than linear RNA [38–41], we focused on the function of ATG4B-interacting circRNA. The 32 most enriched circRNAs were shown in the heatmap (Figure 1A), 11 of which originated from exons and the remaining aligned with introns or intergenic region (Figure 1B). It has been reported that exonic circRNAs are more likely to be localized in the cytoplasm, while the circRNAs containing intron retained in the nucleus [42,43]. Since the current reported localization and function of ATG4B are mainly concentrated in the cytoplasm, we focused on the exonic circRNAs.
Figure 1.
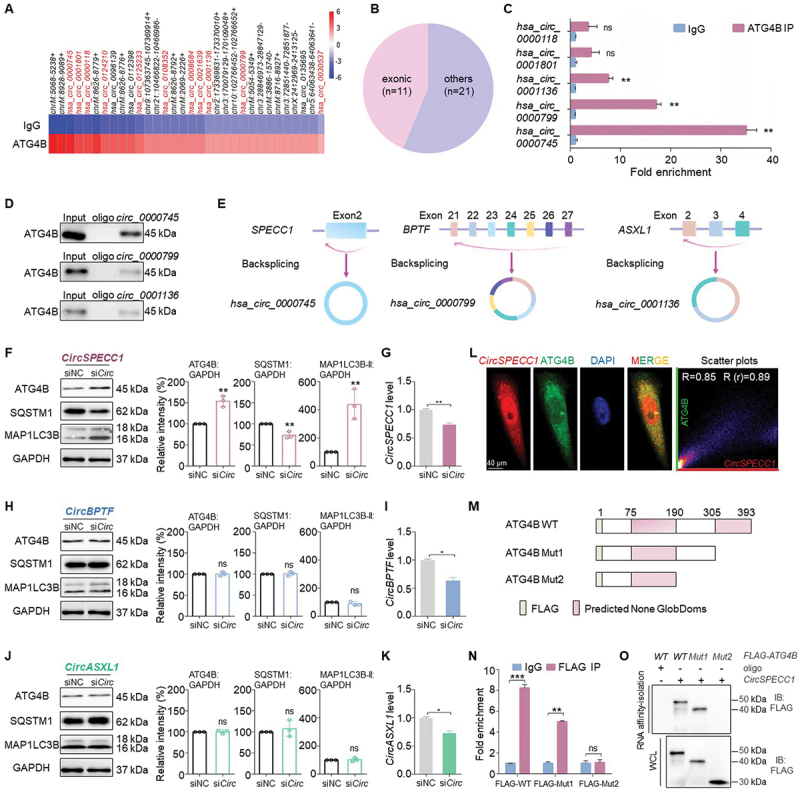
CircSPECC1 physically interacts with ATG4B. (A) Heatmap of the 32 most enriched circRNAs potentially binding to ATG4B protein determined by RIP-seq. Anti-ATG4B antibody was used to enrich ATG4B-interacting RNA. Subsequently, the RNA was purified and the sequencing library were prepared for deep sequencing. An isotype control antibody was included as a negative control. (B) Genomic origin of the circRNAs from (A), and exonic circRNAs are marked with red in (A). Among the top 32 circRNAs enriched by ATG4B, 11 circRNAs were generated from exons (exonic) and the remaining 21 circRNAs were generated from introns or intergenic regions (others). (C) Validation of 5 candidate circRNAs binding to ATG4B protein by RIP-qPCR, which are determined to be differentially expressed among gastric cancer tissues and corresponding adjacent tissues in GEO datababse. AGS cell lysates were prepared and subjected to immunoprecipitation with anti-ATG4B antibody. Then RNA was purified from the precipitation and qRT-PCR was performed with the indicated primers. Ten percent of RNA from the cell lysates was reserved as input and an isotype control antibody was included as a negative control. (D) The interaction of indicated circRNA with ATG4B detected with RNA affinity-isolation assay. The probe targeting the back-splicing site of indicated circRNA was labeled with biotin and conjugated to streptavidin beads. Then AGS cell lysates were incubated with the probe-beads complex and the precipitation was immunoblotted with ATG4B antibody. (E) Schematic diagram of the three validated circRNAs in (D). As shown in the illustration, hsa_circ_0000745, hsa_circ_0000799 and hsa_circ_0001136 were back-spliced from exon2 of SPECC1, exon21 to exon27 of BPTF, exon2 to exon4 of ASXL1, respectively. (F, H, J) Expression of autophagic proteins in circSPECC1 (F), circBPTF (H) and circASXL1 (J) knockdown AGS cells. A total of 25 pmol siRNA (siCirc) targeting circSPECC1 (F), circBPTF (H), and circASXL1 (J) were individually transfected into AGS cells for 24 h. The protein levels of ATG4B, SQSTM1 and MAP1LC3B were then detected and quantified using immunoblot assay. (G, I, K) The knock down efficiency of siRNAs (siCirc) targeting circSPECC1(G), circBPTF (I) and circASXL1 (K) was determined by qRT-PCR. (L) Representative confocal images of circSPECC1 and ATG4B colocalization. AGS cells were stained with ATG4B (green) and circSPECC1 (red), using IF assay coupled with FISH. The nuclei were counterstained with DAPI. Subsequently the confocal analysis was performed. Scatter plots represent colocalization analyses between circSPECC1 and ATG4B using Fiji ImageJ. Pearson coefficient (R) and overlap coefficient (r[r]) are listed. Scale bar: 40 μm. (M) The design of the truncated ATG4B expression plasmids. All the constructs were fused with three FLAG tags at N terminus. (N) RIP-qPCR assay with truncated FLAG-fused ATG4B. Indicated truncated mutants of ATG4B fused with FLAG were transfected into AGS cells for 36 h, then the cell lysates were collected and subjected to immunoprecipitation with anti-FLAG antibody or the corresponding IgG antibody. Then RNA was purified from the precipitation and qRT-PCR was performed with circSPECC1 primers. (O) RNA affinity-isolation assay with truncated FLAG-fused ATG4B. AGS cells were treated as in (N), and the cell lysates were incubated with circSPECC1 probe-conjugated beads. Subsequently, the precipitation was immunoblotted with FLAG antibody. The relative intensity of listed proteins in (F), (H) and (J) was calculated and normalized with control after quantification. Data are means ± SD (n = 3). ns, no significance; *p < 0.05; **p < 0.01; ***p < 0.001.
Firstly, the expression of 11 exonic circRNAs in GC tissues and corresponding adjacent tissues were analyzed among GEO database. As shown in Fig. S1A, hsa_circ_0000745, hsa_circ_0001801, hsa_circ_0000118, hsa_circ_0001136 and hsa_circ_0000799 are downregulated in GC tissues among three or more GSE dataset, while hsa_circ_0125233, hsa_circ_0008684, hsa_circ_0021639 and hsa_circ_0030537 have no significant difference. Moreover, hsa_circ_0124210 and hsa_circ_0108352 were not found in the current available GEO database. Therefore, we detected the binding of ATG4B with 5 differentially expressed circRNAs protein by RIP-qPCR. The results showed that hsa_circ_0000745, hsa_circ_0000799 and hsa_circ_0001136 were appreciably interacted with ATG4B respectively, while hsa_circ_0000118 and hsa_circ_0001801 were not significantly enriched compared with IgG (Figure 1C). Furthermore, the interaction of hsa_circ_0000745, hsa_circ_0000799 and hsa_circ_0001136 with ATG4B was confirmed by RNA affinity-isolation assay using the respective probes (Figure 1D).
As shown in Figure 1E, according to the host gene that circRNA generated from, hsa_circ_0000745, hsa_circ_0000799 and hsa_circ_0001136 were termed as circSPECC1, circBPTF and circASXL1 respectively. To determine the circRNA that can effectively regulate ATG4B expression level, siRNAs targeting the back-splicing sites of the three above circRNAs were transfected into GC cells. Subsequently, autophagic protein was detected with immunoblot assay, and the corresponding knockdown efficiency was also detected with qRT-PCR assay. The results showed that the level of ATG4B protein was elevated (Figure 1F) when circSPECC1 was knockdown in AGS cells (Figure 1G). However, circBPTF or circASXL1 knockdown had no significant effect on ATG4B expression (Figure 1H-K). Similar effects can also be observed in MKN28 and MGC803 cells (Fig. S1B-E). Additionally, the overexpression of circSPECC1 significantly downregulated the levels of ATG4B in MKN74 and HGC27 cells (Fig. S1F-I). Besides, circSPECC1 was remarkably decreased in various human GC cells and 54 paired of GC tissues (Fig. S1J-K), and the separation analysis of the nuclear and cytoplasmic RNA showed that circSPECC1 distributed both in cytoplasm and nucleus (Fig. S1L), which was consistent with the results in GEO database and provided space possibility for the interaction of circSPECC1 and ATG4B. To further determine the interaction of circSPECC1 with ATG4B in GC cells, IF staining followed by FISH were performed and the images were analyzed by colocalization. The results demonstrated that circSPECC1 colocalized with ATG4B in the cytoplasm of AGS cells, with Pearson coefficient = 0.85 (Figure 1L). In further depth, RNA affinity-isolation and RIP-qPCR analysis combined with different truncated ATG4B showed that 190–305 aa region was essential for its interaction with circSPECC1 (Figure 1M-O).
In summary, we firstly demonstrated that ATG4B was a novel RBP that physically interacted with circSPECC1.
CircSPECC1 impairs autophagic flux and enhances anoikis by downregulating ATG4B in GC cells
Considering the interaction between circSPECC1 and ATG4B, we further determined whether the interaction has biological function. Firstly, the regulatory effect of circSPECC1 on ATG4B was further validated with dose-dependent experiment. We observed that in AGS cells, siRNA of circSPECC1 treatment dose-dependent reduced circSPECC1 expression and increased ATG4B protein correspondingly (Figure 2A-B), and the overexpression of circSPECC1 showed opposite effect also in a dose-dependent manner (Figure 2C-D). In Figure 1F and Fig. S1B-I, we noticed that in addition to ATG4B, circSPECC1 also affected the levels of SQSTM1 and MAP1LC3B-II, suggesting that circSPECC1 may influence autophagy. Moreover, circSPECC1 knockdown-induced MAP1LC3B-II accumulation was enhanced by cotreatment with the autophagy inhibitor bafilomycin A1 (Baf A1; Figure 2E), and the knockdown also promoted autophagosomes, autolysosomes, and the autophagic flux, compared to that of siNC in mCherry-EGFP-LC3-expressing AGS cells (Figure 2F). Oppositely, the accumulation of MAP1LC3B-II by Baf A1 was also weakened when circSPECC1 was overexpressed in MKN74 cells, and circSPECC1 also inhibited the formation of autophagosomes and autolysosomes in mCherry-EGFP-LC3 expressing MKN74 cells (Figure 2G-H). The above results indicated that circSPECC1 could effectively regulate ATG4B expression and autophagic flux.
Figure 2.
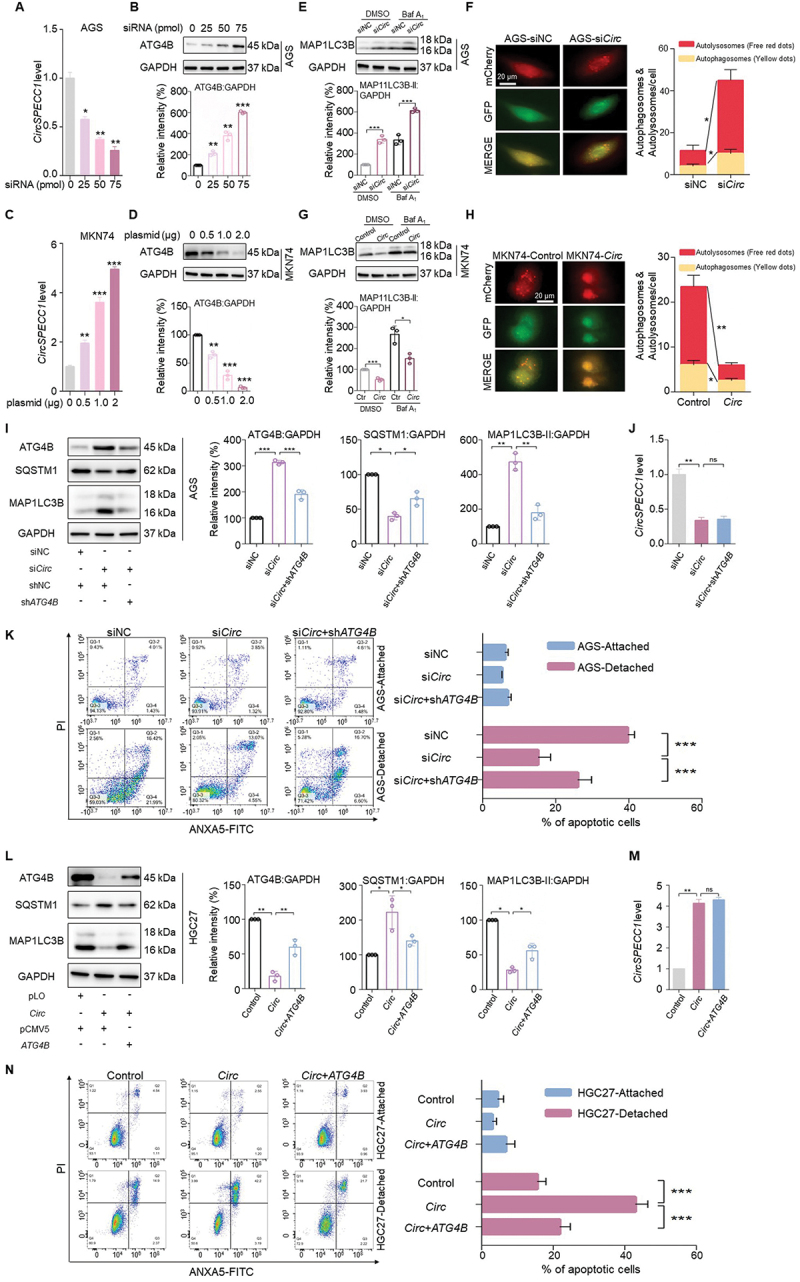
CircSPECC1 impairs autophagic flux and enhances anoikis by downregulating ATG4B in GC cells. (A, B) The siRNA of circSPECC1 reduced the circSPECC1 expression (A) and increased the protein level of ATG4B in a dose-dependent manner (B). A total of 25 pmol, 50 pmol and 75 pmol circSPECC1 siRNA were transfected into AGS cells for 48 h respectively, followed by qRT-PCR assay with circSPECC1 primer (A) and immunoblot assay with ATG4B antibody (B). (C, D) The overexpression of circSPECC1 dose-dependently increased the circSPECC1 level (C) and decreased the ATG4B protein level (D). A total of 0.5 μg, 1 μg and 2 μg circSPECC1 expression plasmid were transfected into MKN74 cells for 48 h respectively, followed by qRT-PCR assay with circSPECC1 primer (C) and immunoblot assay with ATG4B antibody (D). (E, G) CircSPECC1 negatively regulated the expression of MAP1LC3B-II in GC cells. AGS cells were transfected with 25 pmol circSPECC1 siRNA (siCirc) or control siRNA (siNC), and MKN74 cells were transfected with 0.5 μg circSPECC1 expression plasmid (Circ) or empty vector (control). All groups were treated with 0.2 μM baf A1 or equal volume of DMSO overnight at 36 h post transfection. Then cell lysates were collected and detected by immunoblot assay. (F, H) Representative fluorescence images of cells transfected with mCherry-EGFP-LC3 in the presence of circSPECC1 siRNA (F) or circSPECC1 expression vector (H). AGS (F) or MKN74 (H) expressing mCherry-EGFP-LC3 were seeded in 6-well plate. After transfection of circSPECC1 siRNA (F) or circSPECC1 expression vector (H) for 24 h, the numbers of autophagosome (yellow puncta) and autolysosome (red-only puncta) were counted. Scale bar: 20 μm. (I, L) AGS cells (I) or HGC-27 cells (L) were transfected with indicated plasmids or siRNAs. After 48 h, the protein levels of ATG4B, SQSTM1 and MAP1LC3B were detected and quantified using immunoblot assay. (J, M) The knockdown efficiency (J) or overexpression efficiency (M) of circSPECC1 in GC cells. Cells were treated as in (I) or (L) respectively. Then total RNA was isolated and qRT-PCR was performed with circSPECC1 primer. (K, N) The role of ATG4B in the influence of circSPECC1 on anoikis resistance. Cells were transfected as in (I) or (L), followed by cultured in normal or ultra-low attachment plates for 48 h. Subsequently, the cells were collected and flow cytometry was performed to detect the apoptosis of the cells. The apoptosis rates were calculated as the percentage of ANXA5-positive and ANXA5- and PI-double-positive cells. The relative intensity of proteins listed in (B), (D), (E), (G), (I) and (L) was calculated and normalized with control after quantification. Data are means ± SD (n = 3). *p < 0.05; **p < 0.01; ***p < 0.001.
To further investigate the role of ATG4B in circSPECC1-regulated autophagy, we knocked down ATG4B using shRNA in AGS cells. As shown in Figure 2I-J, the reduction of ATG4B significantly attenuated circSPECC1 knockdown-induced autophagy (Figure 2I), with no obvious effect on the expression of circSPECC1 (Figure 2J). Moreover, detachment-induced apoptosis was weakened by circSPECC1 knockdown, which could be enhanced by the decline of ATG4B (Figure 2K). The opposite effect could be observed in HGC27 cells transfected with circSPECC1 or ATG4B overexpression (Figure 2L-N).
Collectively, these results revealed that circSPECC1 negatively regulated ATG4B, impairing autophagic flux and enhancing anoikis in GC cells.
CircSPECC1 promotes LLPS of ATG4B and accelerates ATG4B ubiquitination
Recent studies have reported that certain proteins underwent LLPS, which not only provide a compartmentalized and ordered space in cells, but also improve the efficiency of various biochemical reactions [44]. Furthermore, lncRNA and circular RNA have been reported to promote the condensate formation of protein that interacted with them [34,45]. In our study, we noticed that ATG4B formed obvious puncta (dia. >0.5 μm) and overlapped with circSPECC1 in cytoplasm (Figure 1L). Therefore, we wondered whether such concentrated puncta were induced by LLPS.
According to previous reports, intrinsically disordered regions (IDR) is the prerequisite for phase separation of proteins [46]. IUPred2A analysis showed that within the circSPECC1-interacting region (191–305 aa), there were some residues with a probability of disorder exceeding 0.5, which could be considered disordered (Figure 3A). Next, we expressed full-length (FL) ATG4B-mCherry and ATG4B(Δ191–305)-mCherry ectopically in MGC803 cells respectively. As shown in Figure 3B, exogenously expressed FL ATG4B-mCherry formed puncta in the cytoplasm, whereas the mutant with residues 191–305 deleted (Δ191–305) failed. Hereafter, the 191–305 aa region was considered as an IDR. Moreover, we observed that two ATG4B puncta fused into a larger one (Figure 3C), and the fluorescence intensity of ATG4B puncta could recovery after photobleaching (Figure 3D), which indicated that the puncta possessed the liquid-like property and represented a highly dynamic process. These findings suggested that ATG4B undergoes LLPS in GC cells.
Figure 3.
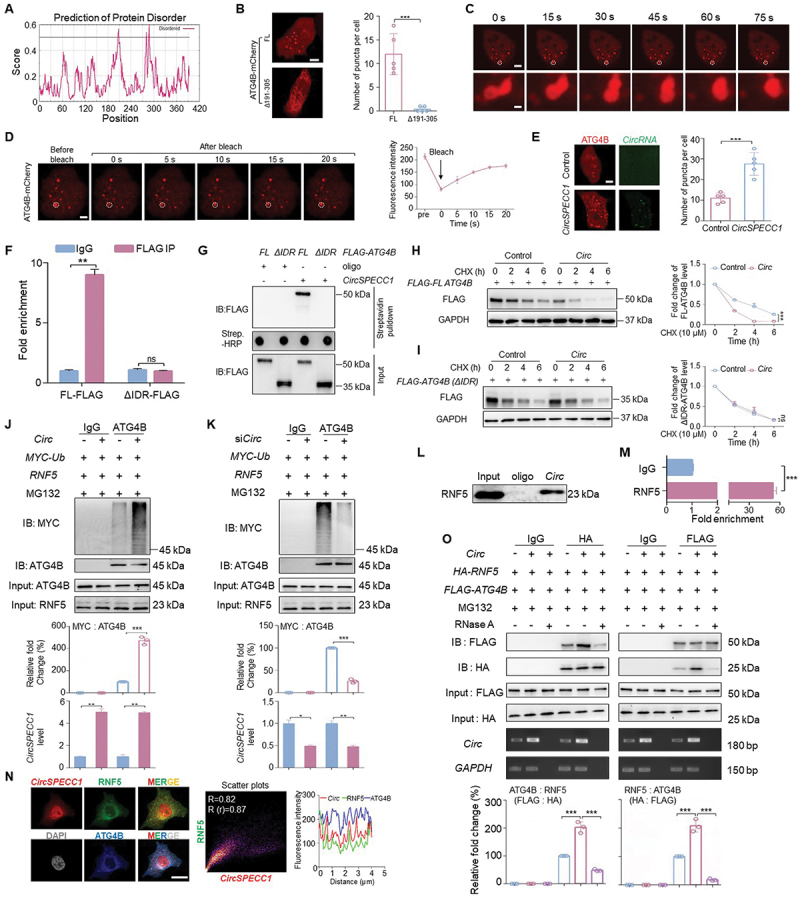
CircSPECC1 promotes LLPS of ATG4B and accelerates ATG4B ubiquitination. (A) Prediction of the intrinsically disorder region (IDR) within ATG4B using IUPred2A (https://iupred2a.Elte.hu). 0.5 serves as the boundary for whether it is a disordered region. (B) ATG4B formed puncta in MGC803 cells via its 191–305 region. MGC803 cells were seeded in 35-mm confocal dishes and transfected with FL ATG4B-mCherry or Δ191–305 ATG4B-mCherry (2 μg/35-mm dish) for 24 h. Then the cells were imaged by confocal microscope. Representative pictures were shown (left panel), and the numbers of mCherry puncta (dia. >0.5 μm) per cell were counted in five random fields (right panel). Scale bar: 5 μm. (C) The puncta of ATG4B underwent fusion. MGC803 cells were treated as in (B), and the cells were analyzed with time-series confocal microscopy. The bottom row shows a magnified view of two fusing puncta. Scale bar: 5 μm (top) and 2 μm (bottom). (D) The puncta of ATG4B underwent a highly dynamic process. MGC803 cells were treated as in (B). Subsequently the images were captured before and after photobleaching. Scale bar: 5 μm. (E) More ATG4B puncta were formed in the presence of circSPECC1. MGC803 cells expressing ATG4B-mCherry were transfected with exogenous circSPECC1 or not, which was synthesized in vitro and labeled with 488-UTP. Then the cells were imaged by confocal microscope. Scale bar: 5 μm. (F, G) RIP-qPCR assay (F) and RNA affinity-isolation assay (G) with FL or IDR deletion (ΔIDR) of FLAG-fused ATG4B. FL or ΔIDR ATG4B fused with FLAG were transfected into MGC803 cells for 36 h, then the cells lysates were collected and subjected to enrichment with anti-FLAG antibody (F) or biotin labeled probes targeting circSPECC1 (G). Then the precipitations were purified for RNA or denatured, respectively, and followed by qRT-PCR with circSPECC1 primer (F) or immunoblot with anti-FLAG antibody (G) correspondingly. (H, I) The effect of circSPECC1 on the stability of FL (H) or ΔIDR (I) of ATG4B. HEK293 cells expressing FLAG-FL ATG4B (H) or FLAG- ATG4B (ΔIDR) (I) were transfected with circSPECC1 expression plasmid or empty vector for 36 h, followed by treatment with 10 μM CHX at the indicated time. Then the protein levels of FLAG were detected and quantified using immunoblot assay. (J, K) The effect of circSPECC1 on the ubiquitination level of ATG4B. The cells expressing RNF5 and MYC-ubiquitin (MYC-Ub) were transfected with circSPECC1 expression plasmid (circ, J) or circSPECC1 siRNA (siCirc, K) for 36 h. After treatment with MG132 (10 μM) overnight, the level of circSPECC1 was detected by qRT-PCR, and the level of ubiquitin was analyzed by immunoblotting using anti-MYC antibody after immunoprecipitation with anti-ATG4B antibody. (L, M) The interaction of circSPECC1 with RNF5. RNA affinity-isolation assay with circSPECC1 probe (L) or RIP-qPCR assay with RNF5 antibody (M) was performed. (N) Representative confocal images of RNF5 colocalization with circSPECC1 and ATG4B. MGC803 cells were stained with RNF5 (green), ATG4B (blue) and circSPECC1 (red), using IF assay coupled with FISH. The nuclei were counterstained with DAPI (grey). Subsequently the confocal analysis was performed. Scatter plots represent colocalization analyses between circSPECC1 and RNF5 using Fiji ImageJ. Pearson coefficient (R) and overlap coefficient (r[r]) are listed. Fluorescence intensity profile along the white line are also shown. Scale bar: 10 μm. (O) The effect of circSPECC1 on the interaction of ATG4B with RNF5. HEK293 cells expressing FLAG-ATG4B and HA-RNF5 were transfected with or without circSPECC1 expression plasmid for 36 h. After treatment with MG132 overnight, the cells lysates were collected and treated with or without RNase A. Subsequently, the RNA levels of circSPECC1 and GAPDH were detected by RT – PCR. The protein levels of ATG4B and RNF5 were analyzed by immunoblotting using indicated antibodies after immunoprecipitation with anti-FLAG or anti-HA beads. The relative intensity of listed proteins in (H), (I), (J), (K) and (O) was calculated and normalized with control after quantification. Data are means ± SD (n = 3). ns, no significance; *p < 0.05; **p < 0.01; ***p < 0.001.
To further determine whether circSPECC1 is related to ATG4B LLPS, in vitro synthesized circSPECC1 labeled with 488-UTP (Fig. S2A) were transfected into MGC803 cells expressing ATG4B-mCherry. The results showed that the number of ATG4B condensates were significantly increased in circSPECC1-transfected cells (Figure 3E), and the colocalization analysis further demonstrated that circSPECC1 localized to ATG4B condensates (Fig. S2B).
As we have confirmed that circSPECC1 negatively regulated ATG4B protein level in Figures 1 and 2, we wondered whether this effect was related to circSPECC1 accelerated-ATG4B LLPS. To address this issue, we detected the effect of circSPECC1 on the ATG4B mutant with IDR deletion (ATG4B[ΔIDR]), which had been demonstrated to be a loss of phase transition capacity. As shown in Figure 3F-G, circSPECC1 failed to interact with ATG4B(ΔIDR). Immunoblot assay with exogenously expressed FL-ATG4B and ATG4B(ΔIDR) showed that, circSPECC1 inhibited the expression of FL-ATG4B (Figure 3H), but had no significant effect on ATG4B(ΔIDR) (Figure 3I). The above results indicated that the reduction of ATG4B induced by circSPECC1 was closely related to its promotion of ATG4B LLPS.
Given that LLPS is closely related to PTMs, we speculated that circSPECC1-mediated ATG4B suppression was likely via enhanced ubiquitin-proteasome degradation. As shown in Figure 3H, circSPECC1 evidently promoted FL-ATG4B degradation, thus shortened its half-life. While the degradation of ATG4B(ΔIDR) was not affected by circSPECC1 (Figure 3I). The similar result was also observed in HGC27 cells with the detection of endogenous ATG4B (Fig. S2C). Oppositely, knockdown of circSPECC1 dramatically prevented ATG4B degradation and prolonged its half-life in AGS cells (Fig. S2D).
To explore the mechanism of circSPECC1-mediated ATG4B degradation, several approaches were taken to address this critical issue. Currently, RNF5 is the only known E3 ligase responsible for ATG4B ubiquitination and subsequent lysosomal degradation [47]. We determined that the RNF5-mediated downregulation of ATG4B was attenuated by circSPECC1 knockdown (Fig. S2E), while overexpression of circSPECC1 eliminated the increase of ATG4B caused by RNF5 reducing (Fig. S2F). In consequence, we examined if circSPECC1 can affect RNF5-mediated ATG4B ubiquitination. As shown in Figure 3J, the ubiquitination of ATG4B was significantly triggered by ectopically expressed circSPECC1 in HGC27 cells. Parallel ubiquitination levels were also detected in HEK293 cells with exogenous ATG4B overexpression (Fig. S2G). The presence of RNase A had no significant effect on ATG4B ubiquitination level observed in cell lysates (Fig. S2G). While the ubiquitination of ATG4B was significantly reduced upon knockdown of circSPECC1 in AGS cells (Figure 3K). Moreover, RNF5 was demonstrated to specifically interact with circSPECC1 (Figure 3L-M), and the colocalization of circSPECC1, ATG4B and RNF5 was confirmed by confocal microscopy (Figure 3N), indicating that circSPECC1 interacted with both ATG4B and RNF5 to form a trimer complex in the cytoplasm. The results of immunoprecipitation showed that the interaction between RNF5 and ATG4B was significantly enhanced when circSPECC1 was ectopically expressed, which could be dramatically weakened by RNase A (Figure 3O). Parallel interactions were detected in HGC27 cells with circSPECC1 overexpression (Fig. S2H) or AGS cells with circSPECC1 knockdown (Fig. S2I).
Collectively, these results revealed that circSPECC1 promoted LLPS of ATG4B and accelerated its ubiquitination via the formation of a trimer complex with ATG4B and RNF5.
The expression of circSPECC1 is negatively correlated with that of ATG4B in GC tissues
To further determine whether the circSPECC1-ATG4B pathway was clinically relevant, we next investigated the clinical associations between circSPECC1 and ATG4B. CircSPECC1 expression was significantly decreased in GC tissues (Figure 4A-B). The ROC curves indicated that circSPECC1 could be applied for the prediction of patient prognosis (Figure 4C), and the low expression of circSPECC1 was strongly associated with poor survival of GC patients (Figure 4D). Oppositely, ATG4B expression was dramatically enhanced in GC tissues, and the high expression of ATG4B was significantly associated with poor survival (Figure 4E-H).
Figure 4.
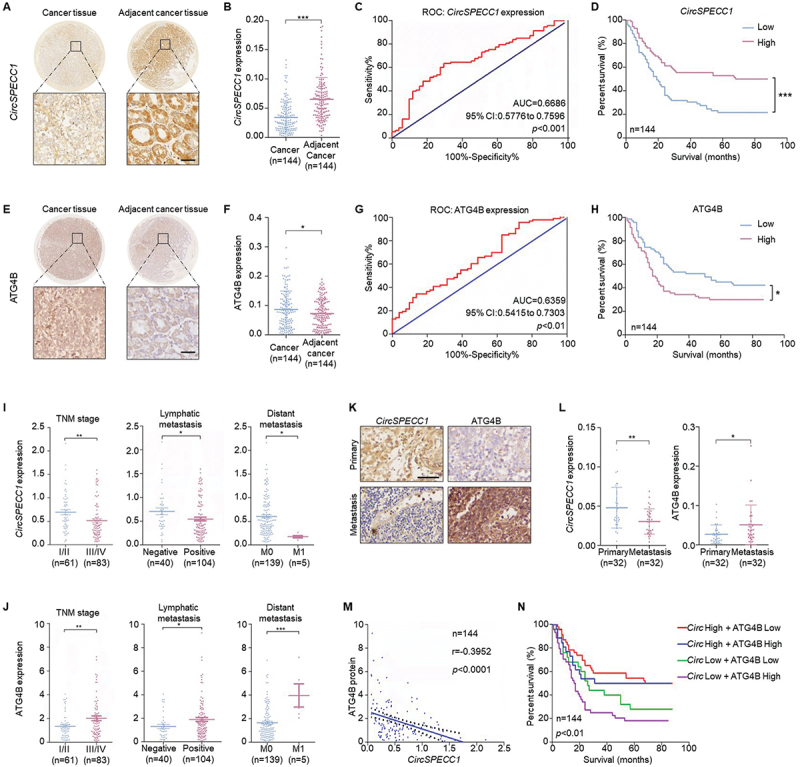
The expression of circSPECC1 is negatively correlated with that of ATG4B in GC tissues. (A, E) Representative image of circSPECC1 (A) and ATG4B (E) in gastric cancer tissues and corresponding adjacent tissues. The tissue microarrays were dewaxed and rehydrated. After antigen retrieval, ISH with probes targeting circSPECC1 (A) and IHC staining with ATG4B antibody (E) was performed respectively. Then images were captured by microscopy system. Scale bar: 50 μm. (B, F) The levels of circSPECC1 (B) and ATG4B (F) in 144 pairs of gastric cancer and adjacent tissues. (B) The circSPECC1 quantification of the data from (A). (F) The ATG4B quantification of the data from (E). (C, G) The area under the ROC curve (AUC) was applied to predict the relationship between patient survival state and the relative expression of circSPECC1 (C) or ATG4B (G). The score with the maximal sum of sensitivity and specificity was used to distinguish the high or low expression groups. (D, H) The survival time of patients based on the relative levels of circSPECC1 (D) or ATG4B (H) was analyzed by Kaplan-Meier. (I, J) The correlation between the levels of circSPECC1 (I) or ATG4B (J) and TNM stage, lymphatic metastasis, and distant metastasis in patients diagnosed with gastric cancer. (K) Representative staining of circSPECC1 and ATG4B in the primary and metastasis cancer tissues. Scale bar: 50 μm. (L) The levels of circSPECC1 and ATG4B in 32 pairs of primary and metastasis cancer tissues. Quantification of the data from (K). (M) the correlation between the levels of circSPECC1 and ATG4B protein. (N) The overall survival time of patients based on the combination of circSPECC1 and ATG4B. *p < 0.05, **p < 0.01 and ***p < 0.001.
In addition, the level of circSPECC1 was negatively correlated with TNM stage, lymphatic metastasis and distant metastasis (Figure 4I), and the opposite effect was also observed for ATG4B (Figure 4J). Both gene expression levels were independent of age or gender (Table S1). Besides, compared with primary lesions, circSPECC1 was significantly reduced in metastatic lesions, while ATG4B levels were dramatically elevated (Figure 4K-L). Furthermore, circSPECC1 expression was negatively correlated with that of ATG4B (Figure 4M). Interestingly, the shortest survival time was observed in the group with low expression of circSPECC1 and high expression of ATG4B (Figure 4N).
Together, the above results indicated that decreased circSPECC1 contributed to the upregulation of ATG4B in GC tissues, and the conjoint analysis of the two genes could predict the prognosis of GC patients. Based on the results that circSPECC1 enhanced anoikis by repressing ATG4B and autophagy (Figure 2I-N), we determined that the decreased circSPECC1 should be responsible for the upregulation of ATG4B and the easily metastasize of GC. Thus, pharmacological supplementation of circSPECC1 may be a novel strategy for targeting ATG4B to suppress metastasis.
ELAVL1 recognizes and inhibits circSPECC1, enhancing anoikis resistance by increasing ATG4B subsequently
It has been reported that m6A modification is important in regulating the steady-state levels of circRNAs [48–52], and MeRIP-qPCR assay with primers spanning the back-splicing site showed that circSPECC1 was dramatically enriched by m6A antibody (Figure 5A). Moreover, studies have demonstrated that the overall levels of m6A modification in GC are significantly higher than adjacent normal samples [53], indicating that the abnormal reduction of circSPECC1 may be strongly related to m6A modification in GC.
Figure 5.
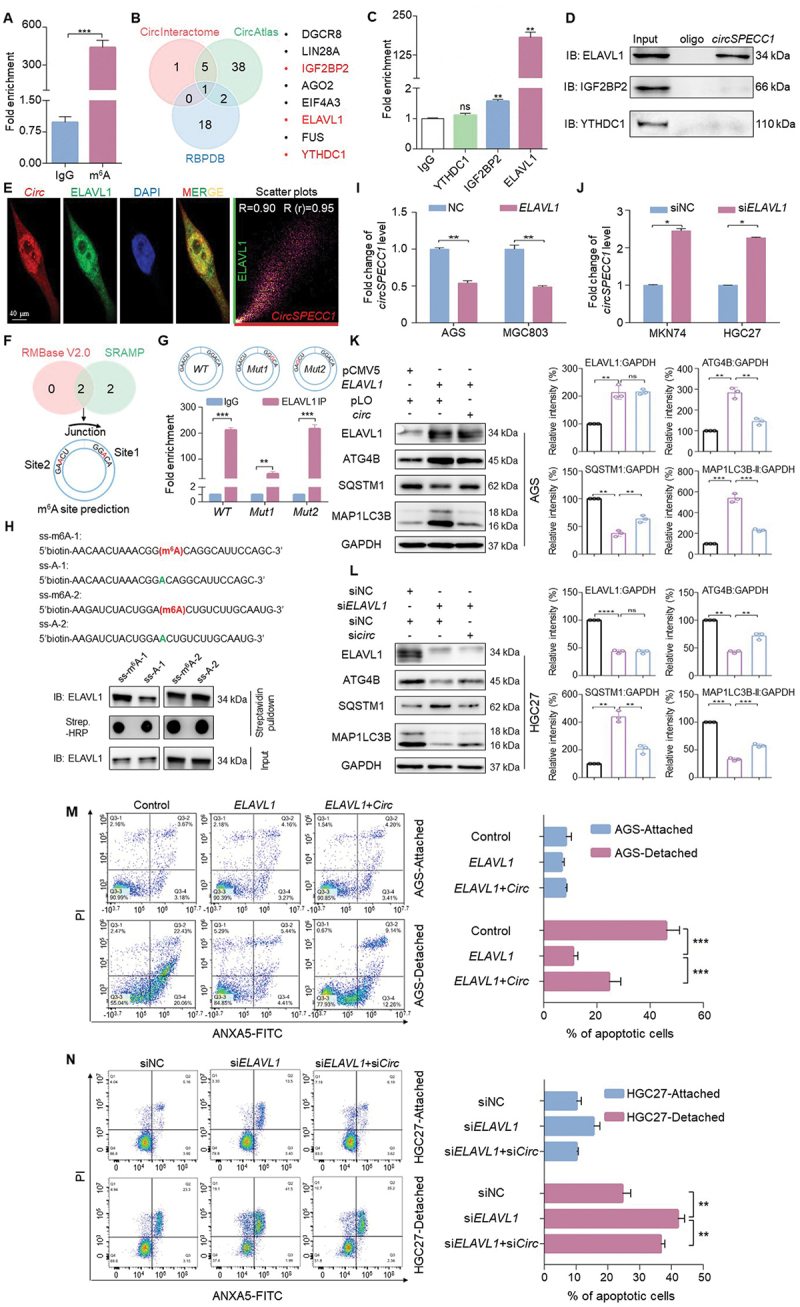
ELAVL1 recognizes and inhibits circSPECC1, enhancing anoikis resistance by increasing ATG4B subsequently. (A) CircSPECC1 underwent m6A modification in AGS cells. Fragmented RNA from AGS cells were incubated with m6A specific antibody or corresponding isotype control, followed by qRT-PCR with circSPECC1 primer. (B) CircInteractome, CircAtlas and RBPDB were used to predict potential proteins that interact with circSPECC1. The m6A related proteins were marked in red. (C, D) The interaction of circSPECC1 with indicated m6A reader from (B). AGS cell lysates were prepared, followed by incubation with the indicated antibodies (C) or circSPECC1 probe (D). Then the level of circSPECC1 was detected by qRT-PCR (C) and the protein levels were analyzed by immunoblotting using indicated antibodies (D). (E) Representative confocal images of circSPECC1 and ELAVL1 colocalization. AGS cells were stained with ELAVL1 (green) and circSPECC1 (red), using IF assay coupled with FISH. The nuclei were counterstained with DAPI (blue). Subsequently the confocal analysis was performed. Scatter plots represent colocalization analyses between circSPECC1 and ELAVL1 using Fiji ImageJ. Pearson coefficient (R) and overlap coefficient (r[r]) are listed. Scale bar: 40 μm. (F) Predicted m6A modification site near the back-splicing site of circSPECC1. The prediction was performed using sequence-based N6-methyladenosine (m6A) modification site predictor (SRAMP) and RMBase v2.0. (G) ELAVL1 recognizes circSPECC1 in m6A-dependent manner. The two predicted m6A modified sites in (F) were mutated to G respectively. Then WT or mutant of circSPECC1 was transfected into HEK293 cells for 24 h. Subsequently, the level of circSPECC1 was detected by qRT-PCR after immunoprecipitation with ELAVL1 antibody. (H) The interaction of ELAVL1 with circSPECC1 depends on the m6A modification. The single strand RNA of circSPECC1 with or without m6A modification were synthesized and labeled with biotin at 5’ ends. The level of ELAVL1 was analyzed by immunoblotting after affinity isolation using the above ssRNA in HEK293 cell lysates. (I, J) ELAVL1 negatively regulates circSPECC1 in GC cells. AGS and MGC803 cells were transfected with ELAVL1 expression plasmid or empty vector (I). MKN74 and HGC27 cells were transfected with ELAVL1 siRNA or scramble (J). Then the level of circSPECC1 was detected by qRT-PCR. (K, L) The role of circSPECC1 in ATG4B regulation by ELAVL1. CircSPECC1 expression plasmid was transfected into ELAVL1 overexpressed AGS cells (K), and circSPECC1 siRNA was transfected into ELAVL1 knockdown HGC27 cells (L). Then the protein levels were analyzed and quantified by immunoblotting. (M, N) The role of circSPECC1 in the influence of ELAVL1 on anoikis resistance. AGS cells (M) and HGC27 cells (N) were transfected as in (K) or (L) respectively, followed by cultured in normal or ultra-low attachment plates for 48 h. Subsequently, the cells were collected and apoptosis was analyzed by flow cytometry. The apoptosis rates were calculated as the percentage of ANXA5-positive and ANXA5- and PI-double-positive cells. The relative intensity of listed proteins in (K) and (L) was calculated and normalized with control after quantification. Data are means ± SD (n = 3). ns., no significance; *p < 0.05, **p < 0.01 and ***p < 0.001.
M6A levels are primarily balanced by methyltransferases and demethylases. More importantly, m6A modified RNAs should be recognized by the m6A reader proteins to transmit to the downstream pathway. To identify the potential m6A reader that may regulate circSPECC1, we used 3 common online bioinformatic tools to predict the protein binding with circSPECC1 (Figure 5B). Among the predicted proteins, 8 candidates were discovered by two or more online tools, with ELAVL1, IGF2BP2 and YTHDC1 being reported as m6A readers. As shown in Figure 5C-D, ELAVL1 was identified to bind with circSPECC1 most obviously. Colocalization analysis found that circSPECC1 colocalized with ELAVL1 significantly with Pearson coefficient = 0.9 (Figure 5E). To identify whether the interaction was m6A dependent, the potential m6A modification site near the back-splicing site was predicted (Figure 5F) and the probable site was mutated to G accordingly. Subsequently, the mutant and WT circSPECC1 was transfected into AGS cells respectively, followed by collecting the lysates and RIP-qPCR assay with ELAVL1 antibody. As shown in Figure 5G, the enrichment of circSPECC1 with site1 mutation was significantly decreased. Besides, the results of synthesized single-stranded circSPECC1 RNA with or without m6A modification coupled by RNA affinity-isolation assay were consistent with the RIP-qPCR results (Figure 5H). Collectively, the above results indicated that m6A modification was required for ELAVL1 interaction with circSPECC1.
Then we assessed whether the recognition of circSPECC1 by ELAVL1 had any biological significance. The qRT-PCR assay showed that ELAVL1 negatively regulated the level of circSPECC1 (Figure 5I-J), and positively regulated ATG4B (Figure 5K-L). Moreover, the m6A-dependent recognition of circSPECC1 was also crucial for the turnover of ATG4B. We observed that in HEK293 cells with ELAVL1 knockdown, the inhibitory effect of WT or m6A site mutant circSPECC1 on ATG4B had no significant difference. While in cells with ELAVL1 expressed normally, the mutant of circSPECC1 showed a more significant inhibitory effect on ATG4B compared to WT (Fig. S3A). Furthermore, ELAVL1 positively regulated ATG4B and autophagy by suppressing circSPECC1 (Figure 5K-L), and anoikis resistance caused by ELAVL1 could be weakened by circSPECC1 overexpression (Figure 5M-N). Similarly, knockdown of ATG4B impaired ELAVL1-induced autophagy, and weakened ELAVL1-caused anoikis resistance in AGS cells (Fig. S3B and S3D). The opposite effect could be observed in HGC27 cells transfected with ELAVL1 siRNA and ATG4B overexpression (Fig. S3C-E).
In conclusion, the above results showed that ELAVL1 increased ATG4B and promoted autophagy by downregulating circSPECC1, and this pathway repressed anoikis in GC cells.
ELAVL1 correlates inversely with circSPECC1 and positively with ATG4B in GC tissues
We next investigated the clinical associations among ELAVL1, circSPECC1 and ATG4B in GC tissues. ELAVL1 was significantly upregulated in GC tissues (Figure 6A-B). The ROC curves suggested that ELAVL1 expression could be applied for the prediction of patient prognosis (Figure 6C), and the high expression of ELAVL1 was strongly associated with poor survival of GC patients (Figure 6D). The expression level of ELAVL1 was positively associated with advanced TNM stage, lymphatic metastasis and distant metastasis (Figure 6E), and was not associated with age or gender (Table S1). Besides, ELAVL1 was obviously upregulated in metastasis foci compared with corresponding primary lesions (Figure 6F-G). In addition, ELAVL1 expression was negatively correlated with that of circSPECC1 (Figure 6H), and the shortest survival time was observed in the group with high expression of ELAVL1 and low expression of circSPECC1 (Figure 6I). Moreover, ELAVL1 expression was positively correlated with that of ATG4B (Figure 6J), and the shortest survival time was observed in the group with high expression of ELAVL1 and ATG4B (Figure 6K). The above results confirmed the ELAVL1-circSPECC1-ATG4B pathway in vivo.
Figure 6.
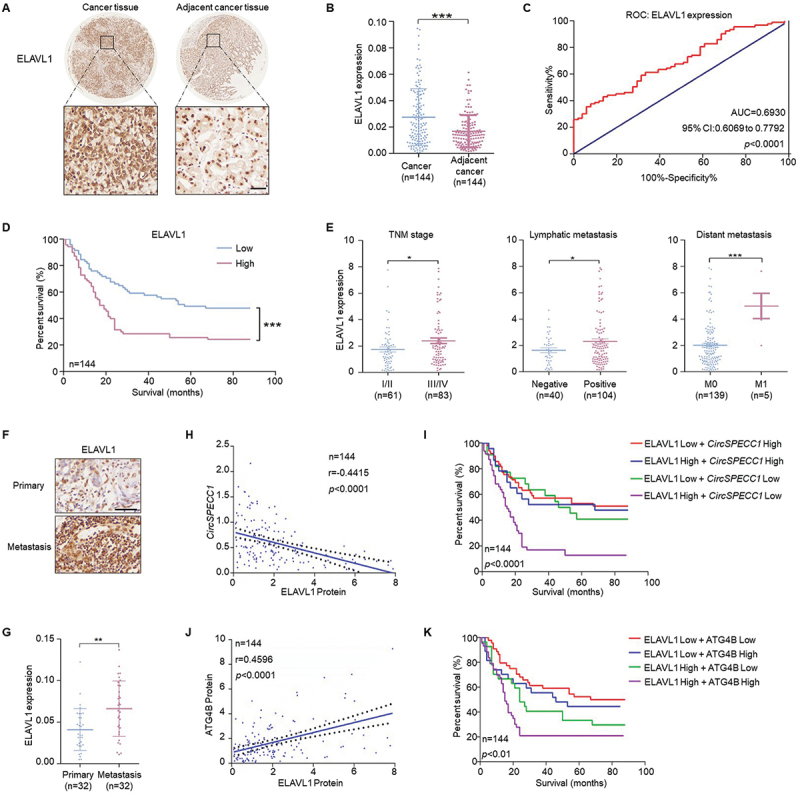
The correlation of ELAVL1 expression with that of circSPECC1 and ATG4B in gastric cancer tissues. (A) Representative IHC staining of ELAVL1 in gastric cancer tissues and corresponding adjacent tissues. The tissue microarrays were dewaxed and rehydrated. After antigen retrieval, IHC staining with ELAVL1 antibody was performed. Then images were captured by microscopy system. Scale bar: 50 μm. (B) The relative level of ELAVL1 in 144 pairs of gastric cancer and adjacent tissues. Quantification of the data from (A). (C) The AUC was applied to predict the relationship between patient survival state and the relative expression of ELAVL1. The score with the maximal sum of sensitivity and specificity was used to distinguish the high or low expression groups. (D) The survival time of patients based on the relative expression level of ELAVL1 was analyzed by Kaplan-Meier. (E) The association between the level of ELAVL1 and TNM stage, lymphatic metastasis, distant metastasis in gastric cancer patients. (F) Representative IHC staining of ELAVL1 in the primary and metastasis cancer tissues. Scale bar: 50 μm. (G) The relative level of ELAVL1 in 32 pairs of primary and metastasis cancer tissues. Quantification of the data from (F). (H, J) The correlations between the levels of ELAVL1 and circSPECC1 (H), or ELAVL1 and ATG4B (J). (I, K) The survival time of patients based on the combination of ELAVL1 with circSPECC1 (I) or ATG4B (K). *p < 0.05, **p < 0.01 and ***p < 0.001.
In summary, these results clearly demonstrated that the highly expressed ELAVL1 was the important reason for the abnormal reduction of circSPECC1. Blocking the interaction of ELAVL1 and circSPECC1 may be the potential method for pharmacological supplementation of circSPECC1 in vivo, which may become a novel strategy for targeting ATG4B.
The FDA-approved lopinavir was selected with molecular docking to interrupt the interaction of ELAVL1 with circSPECC1
To identify the small molecule compound that may block the interaction of ELAVL1 and circSPECC1, the binding model was carried out by docking study. As shown in Figure 7A and Fig. S4A, the residues Arg34, Arg37, Lys50, Arg53, Asp54, Lys55, Glu101, Lys104, Arg157, Gln189, Asn190, Gln262 and Pro266 in ELAVL1 were involved in binding with circSPECC1 through salt bridges and hydrogen bond interactions. According to the result of molecular docking, three potential binding sites were defined that compound may docked into (Fig. S4B). In addition, ELAVL1 has been reported to have three RNA recognition motif, named as RRM1, RRM2 and RRM3 as shown in Figure 7B. RNA affinity-isolation analysis showed that RRM1 (the 20–98 aa region) was essential for circSPECC1 binding, which was consistent with the predicted site1 and site3 in Fig. S4B. Besides, Dihydrotanshinone I, one of the known ELAVL1 inhibitors [54], was docked to the three binding sites, and the results were shown in Fig. S4C, indicating that the affinity of the inhibitor binding to site1 may be stronger. Accordingly, the site1 position was considered as the binding pocket for molecular docking in the subsequent virtual screening process. As shown in Figure 7D, a target library containing about 8600 active compounds were prepared for molecular docking and ranked by flexible docking. The top 4000 molecules with the lowest docking scores were selected and divided into structural clusters through fingerprint-based clustering and the best ranked 60 molecules were finally identified as potential hits. Among the 60 compounds, we firstly focused on the 20 compounds which have been approved by FDA. Excluding veterinary antibiotics and surgical anesthetics, the remaining 15 compounds were selected for further experiment. CCK-8 assay was performed to detect the effect of 15 compounds on suspension cultured AGS cells. As shown in Figure 7E, lopinavir, cobicistat, ritonavir and danoprevir significantly enhanced the detachment-induced apoptosis. However, the remaining 11 drugs had no significant effect. As lopinavir (the structural formula was shown in Figure 7F) exhibited the most evident efficacy, it was selected for further investigation. The binding mode of lopinavir in the ELAVL1-circSPECC1 interaction site was shown in Figure 7G (3D mode) and Figure 7H (2D mode). Furthermore, RIP-qPCR assay showed that the interaction of ELAVL1 and circSPECC1 was significantly impaired in lopinavir-treated AGS cells (Figure 7I). In summary, the above results demonstrated that lopinavir could effectively reduce the interaction of ELAVL1 with circSPECC1.
Figure 7.
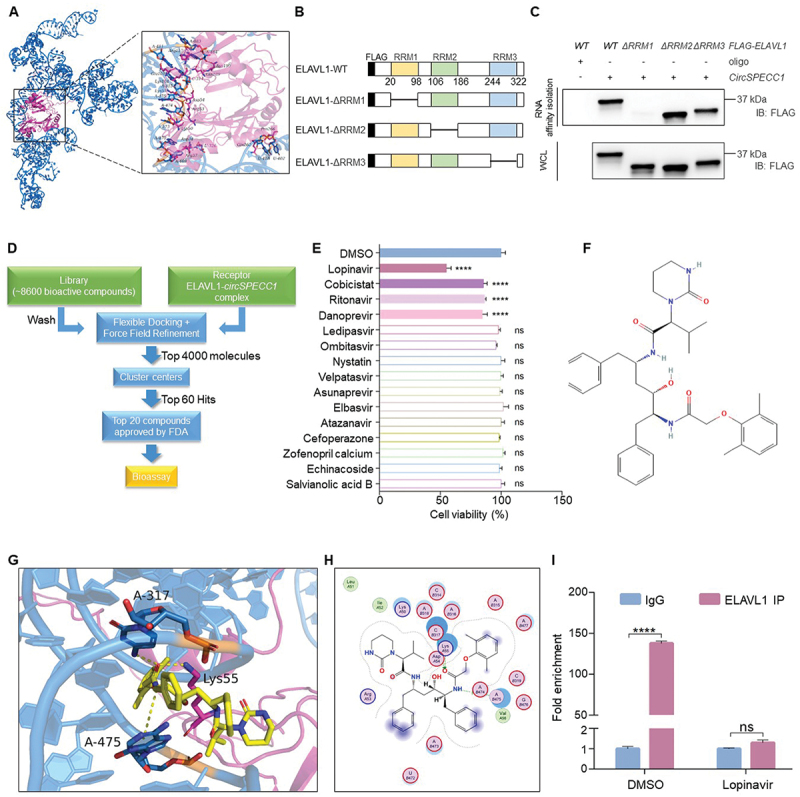
The FDA-approved lopinavir was selected with molecular docking to interrupt the interaction of ELAVL1 with circSPECC1. (A) The 3D binding model of the circSPECC1 and ELAVL1 complex. The backbone of circSPECC1 is depicted as cyan cartoon and the backbone of ELAVL1 is depicted as hot pink cartoon. The residues in ELAVL1 are shown as magenta stick and the bases in circSPECC1 are shown as cyan stick. (B) A schema showing four constructs containing full-length or different domains of ELAVL1. All the constructs were fused with 3 × FLAG tag at N terminus. (C) RNA affinity-isolation analysis of the interaction between circSPECC1 and ELAVL1. Indicated mutants of ELAVL1 fused with FLAG were transfected into AGS cells for 36 h, and the cell lysates were incubated with circSPECC1 probe-conjugated beads. Subsequently, the protein levels of ELAVL1 were analyzed by immunoblotting using FLAG antibody. (D) Flowchart of the virtual screening workflow. A target library containing about 8600 active compounds were prepared for molecular docking and ranked by flexible docking. The top 4000 molecules were selected and divided into structural clusters through fingerprint-based clustering and the top 60 ranked molecules were finally identified as potential hits. Among the 60 compounds, 20 compounds which have been approved by FDA were initially selected for bioassay. (E) Bioactive screen of the selected compounds on anoikis. AGS cells were seeded in 96-well plates with ultra-low attachment and treated with 30 μM FDA approved compounds selected in (D) for 48 h. Then the cell viability was measured by CCK-8 assay. (F) Chemical structure of lopinavir. 2D structure of lopinavir from Pubchem database. (https://pubchem.ncbi.nlm.nih.gov/compound/92727). (G, H) A 3D diagram (G) or 2D diagram (H) of the interaction between lopinavir and ELAVL1-circSPECC1 complex. (I) The effect of lopinavir on the interaction between circSPECC1 and ELAVL1. AGS cells were treated with lopinavir or DMSO for 24 h. Then the level of circSPECC1 was detected by qRT-PCR after immunoprecipitation with ELAVL1 antibody. Data are means ± SD (n = 3). ns., no significance; ****p < 0.0001.
Lopinavir inhibits autophagy and promotes anoikis in a circSPECC1-dependent manner
To further assess whether lopinavir could elevate circSPECC1 in suspension cultured GC cells, we treated suspension cultured cells with lopinavir in vitro and observed the upregulation of circSPECC1 (Figure 8A-B). Correspondingly, ATG4B and autophagy were suppressed after lopinavir treatment (Figure 8C-D). Besides, lopinavir had no obvious effect on ATG4B activity in vitro (Fig. S5A-B), indicating that lopinavir-inhibited autophagy mainly depended on changes in ATG4B protein level. To further determine whether the reduced ATG4B level by lopinavir was related with circSPECC1, the stable circSPECC1 lentiviral knockdown cells were treated with lopinavir to detect the changes of ATG4B and autophagy. The knockdown efficiency of circSPECC1 was about 50% (Fig. S5C). As shown in Figure 8E-H, the inhibitory effect of lopinavir on ATG4B and autophagy were significantly reduced in circSPECC1 knockdown cells, compared with siNC cells treated in same condition. Moreover, flow cytometry assay showed that lopinavir increased detachment-induced apoptosis in AGS and BGC823 cells, which was attenuated in cells infected with circSPECC1 siRNA lentivirus (Figure 8I).
Figure 8.
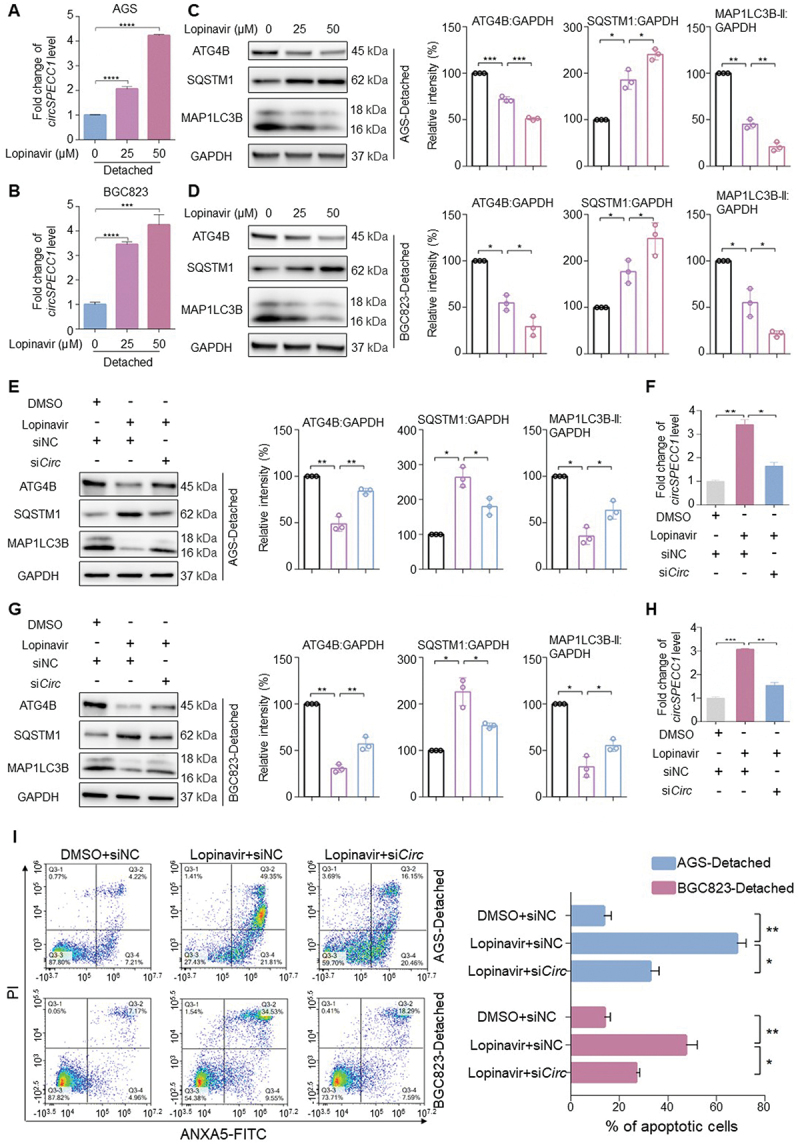
Lopinavir inhibits autophagy and promotes anoikis in a circSPECC1-dependent manner. (A, B) The effect of lopinavir on the circSPECC1 level in suspension-cultured cells. AGS cells (A) or BGC823 cells (B) were cultured in ultra-low attachment plates for 24 h, and then treated with indicated doses of lopinavir for another 24 h. Then the level of circSPECC1 was detected by qRT-PCR. (C, D) The effect of lopinavir on the autophagic protein level in suspension-cultured cells. AGS cells (C) or BGC823 cells (D) were treated as in (A) or (B). Then the protein levels of ATG4B, SQSTM1 and MAP1LC3B were analyzed and quantified by immunoblotting. (E, G) The effect of circSPECC1 knockdown on the reduction of ATG4B by lopinavir. The stable circSPECC1 knockdown AGS cells (E) or BGC823 cells (G) were cultured in ultra-low attachment plates for 24 h, and then treated with indicated doses of lopinavir for another 24 h. Then the protein levels of ATG4B, SQSTM1 and MAP1LC3B were analyzed and quantified by immunoblotting. (F, H) The circSPECC1 level in (E) and (G). Cells were treated as in (E) or (G), and the level of circSPECC1 was detected by qRT-PCR. (I) The effect of circSPECC1 knockdown on the promotion of anoikis by lopinavir. AGS cells and BGC823 cells were treated as in (E) and (G), respectively. Then apoptosis was analyzed by flow cytometry, and the apoptosis rates were calculated as the percentage of ANXA5-positive and ANXA5- and PI-double-positive cells. The relative intensity of listed proteins in (C), (D), (E) and (G) was calculated and normalized with control after quantification. Data are means ± SD (n = 3). *p < 0.05, **p < 0.01, ***p < 0.001 and ****p < 0.0001.
Lopinavir inhibits metastasis of gastric cancer in vivo
To evaluate the therapeutic potential of lopinavir, we next investigated whether lopinavir could inhibit GC cells metastasis in tail vein pulmonary metastasis nude mice model. When the AGS cells were injected into nude mice through the tail vein, the mice were randomly divided into two groups, receiving lopinavir intraperitoneal injection (20 mg/kg per day) or isovolumetric corn oil every 2 days for 6 weeks. Live imaging system for small animals and H&E staining showed that lopinavir decreased the metastatic foci in the lungs of nude mice (Figure 9A-D). ISH further illustrated that circSPECC1 was increased in lopinavir-treated groups, and IF displayed that ATG4B were decreased correspondingly (Figure 9E-F).
Figure 9.
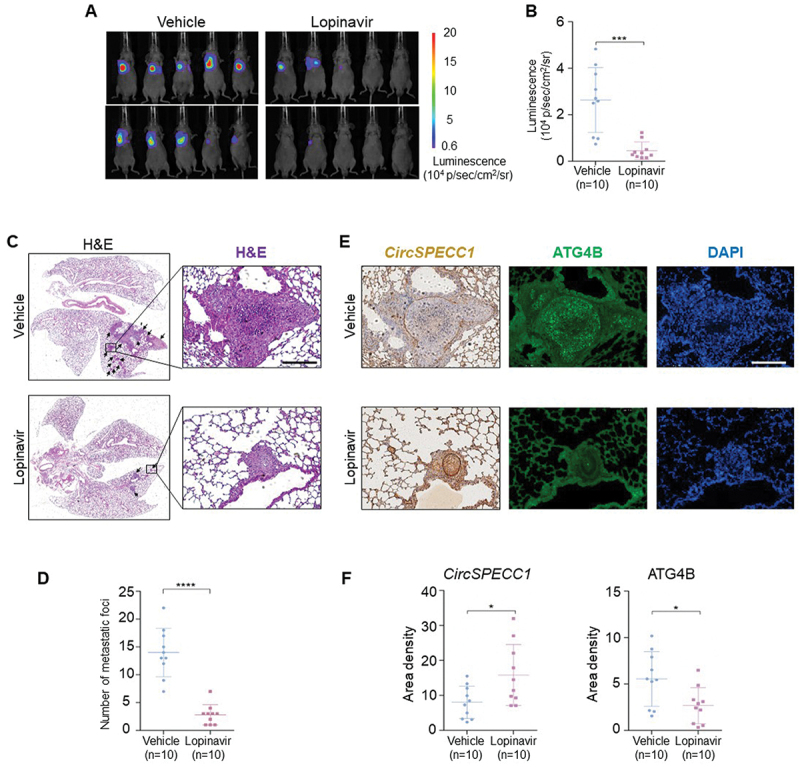
Lopinavir inhibits metastasis of gastric cancer in vivo. (A) The image of in vivo bioluminescence imaging. AGS cells were injected into nude mice (n = 10 in each group) via the tail vein, followed by lopinavir intraperitoneal injection (20 mg/kg per day) or isovolumetric corn oil every 2 days for 6 weeks. The luminescence intensity of the mice was measured using in vivo small animal imaging technology. (B) Statistical analysis of the luminescence intensity in (A). (C, D) Representative HE-staining images (C) of nude mice tail-vein lung metastasis model and the corresponding foci quantification (D). The mice in (A) were sacrificed and lungs were removed for hematoxylin – eosin (H&E) staining according to standard procedures. Then the slides were scanned with BioTek Cytation5 imaging system. Scale bar: 200 μm. (E, F) Representative staining of circSPECC1 and ATG4B (E), and the corresponding area densities (F) in the lung metastatic tissues. The slides were dewaxed and rehydrated. After antigen retrieval, ISH with probes targeting circSPECC1 (left lane) and IF staining with ATG4B antibody (right lane) was performed respectively. Images were captured by microscopy system and quantitatively scored using image pro plus. Scale bar: 200 μm. *p < 0.05, ***p < 0.001 and ****p < 0.0001.
These functional studies demonstrated that the pharmacological supplementation of circSPECC1 by lopinavir suppressed ATG4B and enhanced anoikis, thereby reducing metastasis of GC in vivo.
Discussion
To the best of our knowledge, this study presents the first evidence that ATG4B was a novel RBP to bind with circSPECC1. This binding promoted the LLPS of ATG4B, which provided cellular compartment for the ubiquitination and degradation of ATG4B. In detail, circSPECC1 serves as a necessary scaffold to enhance the interaction between ATG4B and E3 ligase RNF5, mediating the ubiquitination and degradation of ATG4B. However, ELAVL1 enhances ATG4B stability and anoikis resistance in GC cells by repressing circSPECC1 (Figure 10). Moreover, by incorporating molecular docking and virtual screening, we identified that the FDA approved lopinavir effectively promoted the anoikis of GC cells and inhibited metastasis by increasing circSPECC1.
Figure 10.
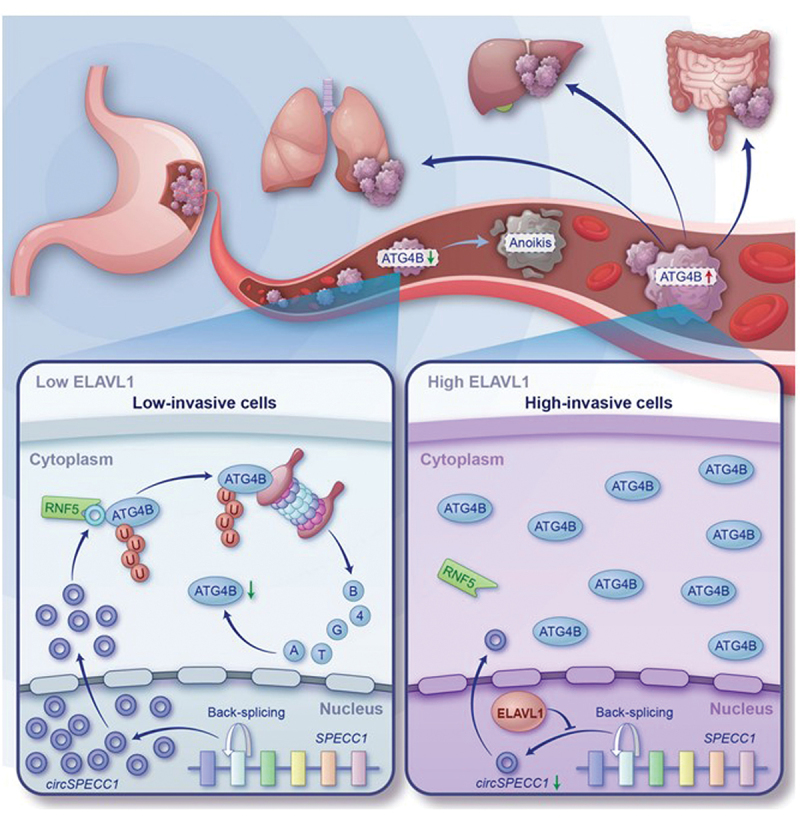
Graphical illustration. The circSPECC1 promotes the proteasome-dependent degradation of ATG4B via facilitating the assembly of ATG4B-RNF5 complex, weakening the autophagic flux and promoting anoikis consequently. However, the abnormally increased ELAVL1 in GC cells inhibits the expression of circSPECC1, impairing the inhibitory role of circSPECC1 in gastric cancer metastasis.
ATG4B is a member of C54 peptidase, which regulate autophagy by cleaving pre-LC3B for its further lipidation and delipidating LC3B-II from autophagosome. Multiple researches have shown that ATG4B is a potential target for cancer therapy, however, the strategies for ATG4B degradation are still far from clinical application. Except for binding with protein, ATG4B protein has been reported to interact with non-PolyA RNAs [32], while the biological significance of the interaction was unclear. It has been reported that binding with RNA could promote the LLPS of protein, which provides cellular compartment for biochemical reactions and signal transduction, including ubiquitination degradation. Here we demonstrated for the first time that circSPECC1 physically interacted with ATG4B, accelerating its LLPS and ubiquitination. Supplementation of circSPECC1 may be a novel strategy for ATG4B suppression.
The rates of biogenesis, nuclear export and turnover together determine the steady-state levels of circRNAs [48–52]. CircSPECC1 is derived from exon2 of the SPECC1 gene. Several studies have shown that, m6A can regulate circRNA levels by affecting splicing, nuclear export or turnover [48–50]. In subretinal pigment epithelium cells, YTHDC1 promotes the nuclear export of m6A modified circSPECC1, resisting oxidative stress-induced injuries [55]. However, no detectable binding of YTHDC1 with circSPECC1 was observed in GC cells. We observed that circSPECC1 was dramatically enriched and negatively regulated by ELAVL1, and this effect operated in an m6A dependent manner.
The RNA binding protein ELAVL1 has been demonstrated to be upregulated in a variety of tumors, contributing to tumor progression through promotion of proliferative, chemoresistance, angiogenesis, invasion, and metastasis [56]. ELAVL1 has been identified as a promising therapeutic target for cancer. Here, we found that ELAVL1 was colocalized with circSPECC1 and suppressed its expression. By incorporating molecular docking and virtual screening, we identified that the antagonist lopinavir potently blocked ELAVL1 binding to circSPECC1, promoting the anoikis of GC cells and relieving metastasis dramatically. Besides, recent studies also indicate that lopinavir exhibits a significant anti-tumor effect. For instance, lopinavir is anti-proliferative in lung cancer and melanoma cells by inducing S-phase arrest [57,58]. In colorectal cancer, lopinavir reduces cell proliferation and migration by targeting CYP (cytochrome P450) and CDH1/E-cadherin, respectively [59]. Apart from the directly cytotoxic against tumor cells, lopinavir is also reported to enhance natural killer cell-mediated target cell killing by promoting the expression of B7H6 in melanoma cells [60]. The above studies not only support our findings that lopinavir has anti-tumor activity, but also indicate that there are several potential targets for lopinavir in cancer cells. Furthermore, lopinavir has been used in the clinical treatment of anti-HIV [61], and as an antiretroviral treatment, lopinavir has also been demonstrated to be beneficial for non-severe patients with COVID-19 [62], so the safety has been confirmed and lopinavir may be more appliable for clinical trials to prevent metastasis.
A limitation of our study is that the detailed mechanism of circSPECC1 inhibition by ELAVL1 is still unclear. The mechanism may be partially explained by the strong interaction between ELAVL1 and circSPECC1, as once the interaction was blocked by lopinavir, the level of circSPECC1 increased. Since we had demonstrated that the recognition of circSPECC1 by ELAVL1 depended on the m6A modification of circSPECC1, we deduced that the repression was related with m6A. It has been reported that m6A-dependent degradation of circRNA is closely correlated with YTHDF2. YTHDF2 associates m6A-containing circRNAs with RNase P/MRP pathway, mediating the rapid degradation of circRNAs [49,52,63]. Z-Dock analysis showed a high probability of interaction between ELAVL1 and YTHDF2 (data not shown). Moreover, PPI analysis with STRING database demonstrated that YTHDF2 May be co-expressed with ELAVL1 (data not shown). Collectively, we speculated that ELAVL1 may repress circSPECC1 by assembling with YTHDF2. In addition, the anoikis resistance mediated metastasis is mostly simulated by tail vein metastases model in nude mice, and there is still a lack of more effective animal model. Besides, lopinavir could be boosted by ritonavir and the combination of the two compounds has been incorporated into anti-HIV therapy in clinic [64,65]. Although we found that ritonavir also promoted anoikis to some extent and speculated that lopinavir-ritonavir may have a better therapeutic effect on inhibiting metastasis, the therapeutic approaches combined with lopinavir to prevent metastasis still need further clinical evaluation.
In conclusion, our study demonstrates for the first time that the novel ELAVL1-circSPECC1-ATG4B-autophagy signaling pathway is critical for the survival of suspension cultured GC cells. This pathway, at least partially, accounts for the metastasis in GC patients. Lopinavir, the agent commonly used in clinic for anti-HIV, has been proved to enhance anoikis and inhibit metastasis by targeting the above pathway, suggesting that it may become a potential strategy to protect patients from metastasis. The present study provides a new insight to prevent metastasis by targeting ATG4B, which may be beneficial for improving the survival of patients with GC in the future.
Materials and methods
Cell culture
AGS cell line was obtained from American Type Culture Collection (CRL-1793), MKN45, MKN74 and MKN28 were from JCRB Cell Bank (JCRB0254, JCRB0255, JCRB0253), GES-1, BGC823 and MGC803 cell lines were purchased from iCell Bioscience Inc (iCell-h062, iCell-h026, iCell-h141), HGC27 cells were from the Cell Bank of the Shanghai Institute for Biological Sciences (TCHu 22). All cell lines were genotyped for identity by Shanghai Biowing Applied Biotechnology Co., Ltd. and tested routinely for Mycoplasma contamination. The cells were cultured in RPMI-1640 (Gibco, C11875500BT) or Dulbecco’s modified Eagle’s medium (Gibco, C11995500BT) supplemented with 10% fetal bovine serum (VivaCell, C04001-050X10) and 1% penicillin-streptomycin (100 U/mL) at 37°C in an atmosphere of 5% CO2.
Antibodies and reagents
Rabbit anti-ATG4B (A5059, for IF staining and immunoblotting), mouse anti-GAPDH (AC033), rabbit anti-ACTB/β-actin (AC206), rabbit anti-LMNB1/lamin B1 (A16909) and rabbit anti-ELAVL1/HuR (A19622) were purchased from ABclonal. Rabbit anti-ATG4B (15131–1-AP, for immunoprecipitation), rabbit anti-YTHDC1 (29441–1-AP) and rabbit anti-IGF2BP2 (11601–1-AP) were purchased from Proteintech. Rabbit anti-ATG4B (PTM-6296, for IHC staining) were purchased from PTM BIO. Mouse anti-RNF5 (sc -81,716) and mouse anti-MYC were purchased from Santa Cruz Biotechnology and Cell Signaling Technology respectively. Rabbit anti-MAP1LC3B (L7543) and mouse anti-FLAG (F1804) were purchased from Sigma-Aldrich. The secondary antibodies goat anti-mouse IgG (H+L), Alexa Fluor™ Plus 488 (A32723) and goat anti-rabbit IgG (H+L), Alexa Fluor™ Plus 647 (A32733) were purchased from ThermoFisher Scientific. The secondary antibodies goat anti-rabbit IgG (H+L), HRP (ZB-2301) and goat anti-mouse IgG (H+L), HRP (ZB-2305) were purchased from ZSGB-BIO. The chemicals of lopinavir (HY-14588), cobicistat (HY-10493), ritonavir (HY-90001), danoprevir (HY-10238), ledipasvir (HY-15602), ombitasvir (HY-13997), nystatin (HY-17409), velpatasvir (HY-12530), asunaprevir (HY-14434), elbasvir (HY-15789), atazanavir (HY-17367), cefoperazone (HY-B0210), zofenopril calcium (HY-B0655), echinacoside (HY-N0020), salvianolic acid B (HY-N1362) and MG132 (HY-13259) were purchased from MedChemExpress. Cycloheximide (CHX, C4859) were purchased from Sigma-Aldrich. The shRNA plasmid targeting ATG4B (sc -72,584-SH) and siRNA targeting RNF5 (sc -95,209) were purchased from Santa Cruz Biotechnology.
Human subjects
The tissue microarrays (TMAs) containing 144 pairs of gastric cancer tissues and corresponding adjacent tissues were purchased from Shanghai Outdo Biotech Company (HStmA180Su11 and HStmA180Su18) with additional ethics approval (Ethics Committee of Shanghai Outdo Biotech Company, SHYJS-CP-1807022). After dewaxing hydration and antigen retrieval, TMAs were incubated with antibodies against ATG4B (1:50), ELAVL1/HuR (1:100) or probes targeting the back-splicing sites of circSPECC1 (BOSTER, MK10855; 200 mM). Images were captured by microscopy system and quantitatively scored using ImagePro Plus.
Tissue cDNA chips including cDNA from 53 pairs of gastric cancer tissues and corresponding adjacent tissues were also purchased from the same company(cDNA-HStmA060CS01). The level of circSPECC1 was detected with qRT-PCR assay, which was calibrated by ACTB/β-actin and analyzed using the 2−ΔΔCT method. The primers used in qRT-PCR analysis are listed in Table S2.
DNA constructs
The complementary DNA encoding full-length ATG4B was amplified by PCR and cloned into pCMV5 (YouBia Biotechnology, VT2114) using standard procedure. RNF5 and ELAVL1 were cloned into pCDNA3.1 (YouBia Biotechnology, VT1001) with the same method. In addition, ATG4B and ELAVL1 were also cloned into the p3×FLAG-CMV-7.1 vector with an N-terminal three FLAG tags (Miaoling Biology, P0438; FLAG-ATG4B and FLAG-ELAVL1), and RNF5 was cloned into pCDNA 3.1 vector with an HA tag at the N terminus (HA-RNF5). Truncation mutants of ATG4B or ELAVL1 were generated with p3×FLAG-CMV-7.1 vector, using Seamless Cloning (Beyotime, D7010S) according to the manufacturer’s instruction. For evaluation of LLPS in cells, ATG4B and related mutants were cloned into pmCherry-C1 vector (Miaoling Biology, P0151). The mcherry-EGFP-LC3 and pLO-CircSPECC1 were purchased from Beyotime (D2816) and GENESEED (GS210220-CZQ030) respectively. The plasmid used for T7 in vitro transcription was synthesized by Sangon Biotech (Shanghai, China).
Immunoblot assays
The whole-cell lysates were isolated with RIPA lysis buffer (Beyotime, P0013B) and the concentrations were quantified by BCA assay kit (Beyotime, P0010). Subsequently, the samples were separated by SDS-PAGE and then transferred to PVDF membranes (Bio-Rad, 162–0177). The membranes were blocked in 5% nonfat milk and incubated with the indicated primary antibodies overnight at 4°C. After incubation with the appropriate HRP-conjugated secondary antibodies for 1 h, the membranes were visualized using ChemicDoc Touch Imaging System (Bio-Rad). Signals were analyzed using the accompanying software (Image Lab, Bio-Rad).
RNA extraction and qRT-PCR
Cells were lysed in RNAiso Plus reagent (Takara, 9109), and the total RNA was isolated by standard phenol-chloroform extraction. Subsequently, RNA was reverse transcribed to cDNA using the PrimeScript RT Reagent Kit (Takara, RR047A). Then qRT-PCR assay was performed using SYBR Premix Ex Taq II (Takara, RR820A) with the LightCycler 96 system (Roche) according to the manufacture’s instruction. Each reaction was performed in triplicate and the relative expression level was analyzed using the 2−ΔΔCT method. The primers are listed in Table S2.
Apoptosis detection
The transfected cells were counted and 5 × 10⁴ cells were cultured in normal or ultra-low-attachment 6-well plates for 48 h. Then the cells were collected and incubated with ANXA5/annexin V-FITC and PI according to the manufacturer’s instructions (BD Biosciences 55,654). Finally, the apoptosis rate was determined by flow cytometer.
mCherry-EGFP-LC3 transient transfection
AGS or MKN74 cells were transfected with the plasmid encoding mCherry-EGFP-LC3 (Beyotime, D2816) together with the indicated plasmids or siRNAs according to the manufacturer’s instruction. At 48 h post transfection, images of mCherry-positive (red), GFP-positive (green) and both-positive (yellow) puncta in each cell were captured using a cell imaging system (Agilent, BioTek Cytation5). Numbers of autophagosomes (yellow dots) and autolysosomes (red-only dots) were manually counted.
Fluorescence imaging and colocalization analysis
Cells were seeded on cover slide, then IF staining were performed followed by RNA fluorescence in situ hybridization (FISH) to analyze the colocalization of protein with circRNA. Briefly, the sections were fixed in 4% paraformaldehyde, permeabilized and blocked using PBS (ZSGB-BIO, ZLI-9062) containing 5% BSA (Beyotime, ST023) and 0.5% TritonX-100 (Sigma-Aldrich, X100-100 ml). Subsequently, the slides were incubated with the indicated antibodies (rabbit anti-ATG4B 1:100, mouse anti-RNF5 1:50 or rabbit anti-ELAVL1/HuR 1:100) overnight at 4°C. At the following day, the sections were stained with appropriate Alexa Fluor (488 or 647)-conjugated antibodies. Then the slides were prehybridized, and subsequently transferred into hybridization buffer containing the probes targeting the back-splicing sites of circSPECC1, which were labeled with Cy3. Finally, DAPI (ThermoFisher Scientific 62,248) was used to counterstain the nuclei, and the images were collected using ZEISS (LSM 800) confocal microscope. Colocalization was measured using Colocalization Finder plugin in ImageJ. Moreover, the Pearson correlation coefficient and Manders overlap coefficient were also calculated.
Fluorescein labeled circular RNA synthesis
Linear transcription templates of circSPECC1 containing T7 promoter were constructed and amplified by PCR. The PCR product was purified by standard phenol-chloroform extraction and used as templates for in vitro transcription (IVT). IVT was performed using T7 High Yield RNA Synthesis Kit (NEB, E2040S). To produce fluorescein labeled RNA, and reduce the effect of fluorescein on the secondary structure of circRNA, we mixed unlabeled UTP (provided by the Kit) with 488-labeled UTP (Roche 11,427,857,910) in a ratio of 1:5 (labeled: unlabeled). In vitro circularization of synthetic circSPECC1 was performed with previous reports [66]. Briefly, 20 μg of linear RNA was treated with Quick CIP kit (NEB, M0525S) followed by T4 polynucleotide kinase (ThermoFisher Scientific, EK0031) in the presence of ATP. Subsequently, the linear RNA was circularized using T4 RNA ligase 1 (NEB, M0204S).
RNA immunoprecipitation sequencing (RIPseq) and RIPqRTPCR
RIP assay was performed with Magna RIP Kit (Millipore,17–700). Briefly, the cells were collected and lysed in complete RIP lysis buffer. At the same time, the magnetic beads were incubated with the indicated antibody (ATG4B, RNF5, ELAVL1/HuR or the corresponding isotype controls) for 30 min at room temperature. Thereafter, cell lysates were incubated with beads-antibody complex at 4°C overnight. The beads were washed with ice-cold RIP wash buffer (Millipore, CS203177) and digested with proteinase K (Millipore, CS203218). Finally, the RNA was purified by phenol-chloroform extraction and ethanol precipitation, and subjected to qRT-PCR analysis or high throughput sequencing according to the manufacturer’s instructions at Cloudseq, Shanghai in China. The primers used in qRT-PCR analysis are listed in Table S2.
RNA affinity-isolation assay
This assay was carried out using the Pierce magnetic RNA-Protein pull-down kit (ThermoFisher Scientific 20,164). The biotin-labeled circSPECC1 probe, biotin-labeled single-stranded RNA probe with methylated or unmethylated adenosine were purchased from Sangon Biotech (Shanghai, China), and incubated with streptavidin magnetic beads respectively. Then the cell lysates were incubated with probes-beads complex at 4°C overnight. Subsequently, the complexes were washed and eluted. Finally immunoblot assay were performed to analyze the protein expression, and the presence of probes with streptavidin-HRP were detected by dot-blot assay.
Phase separation assay in cells
MGC803 cells expressing ATG4B-mcherry were seeded in 35-mm confocal dishes. Once adherent, cells were transfected with fluorescein labeled circSPECC1 or not. After 24 h, cells were analyzed by Leica SP8 confocal microscope, and the visible puncta with diameter more than 0.5 μm were defined as ATG4B puncta. Time-series images were acquired every 15 s for 1 min to observe the fusion of puncta in living cells.
FRAP assay
The fluorescent puncta in transfected cells were bleached using the 561-nm laser from the confocal fluorescence microscope (Leica SP8). Time-series images were acquired every 5 s after bleaching, and the recovery of fluorescence was also recorded.
Immunoprecipitation (IP) assay
For endogenous IP, we used the Pierce Cross-link Magnetic IP/Co-IP Kit (ThermoFisher Scientific 88,805) according to the manufacturer’s instructions. Firstly, the antibody for target protein and the corresponding isotype controls was coupled to the Protein A/G magnetic beads and cross-linked with disuccinimidyl suberate respectively. At the same time, cells were harvested and lysed in cell lysis buffer. Secondly, the lysates were incubated with antibody-beads overnight at 4°C. Then the pellets were washed with IP Lysis/wash buffer for three times, and ultrapure water for once. Finally, the complex was eluted and neutralized, and immunoblot assay was performed to detect the proteins of interest.
For exogenous proteins, the target protein was expressed as FLAG or HA fusion protein, and FLAG-conjugated beads (Beyotime, P2115) or HA-conjugated beads (Beyotime, P2121) were used for the IP. Briefly, cells expressing the tag fusion protein were lysed as described above. After mock treatment or treatment with 50 μg/ml RNase A (ThermoFisher Scientific, EN0531) at 37°C for 10 min, the lysates were incubated with the beads conjugated to the indicated antibody. The protein-beads complex was eluted with appropriate peptides, and the elution product was detected with immunoblot assays.
For evaluating ubiquitination of ATG4B, cells were co-transfected with MYC-tagged ubiquitin constructs and treated with MG132 (10 μM) overnight and lysed for immunoprecipitation and immunoblot analysis with anti-MYC antibody.
Methylated RNA immunoprecipitation (me-RIP)
This assay was performed with m6A Transcriptome Profiling Kit (Ribo Bio, C11051–1). Firstly, total RNA was isolated as described above, and DNase I (NEB, M0303L) was applied to remove genomic DNA. Secondly, the RNA was repurified and fragmented using RNA Fragmentation Buffer supplied by the kit. One-tenth of the fragmented RNA was served as input control. At the same time, the anti-m6A antibody and the corresponding isotype controls were coupled to the magnetic beads respectively. Subsequently, the antibody-beads were incubated with the fragmented RNA overnight at 4°C. At the following day, the beads were washed with 1×IP buffer for three times and eluted with 20 mM N6-methyladenosine. The eluted RNA was precipitated using sodium acetate and ethanol overnight at −80°C. Last, the m6A bound circSPECC1 was calculated by qRT-PCR and the corresponding m6A enrichment was calculated by normalizing to the input.
Molecular docking and virtual screening
The 3D structure of ELAVL1 was downloaded from AlphaFold Protein Structure Database (https://alphafold.ebi.ac.uk/), and the secondary structure of circSPECC1 fragments containing back-splicing sites was obtained by RNAfold web server. HDOCK was used for docking ELAVL1 with circSPECC1. The potential small-molecule compound binding sites in ELAVL1-circSPECC1 complex were predicted by Site finder module. Using Molecular Operating Environment (MOE), dihydrotanshinone I, the known inhibitor of ELAVL1, was docked into the potential sites. Finally, site1 was defined as the small molecule binding pocket site. Then the virtual screening was conducted.
The docking module in MOE was used for structure-based VS (SBVS). About 8600 molecules which has been confirmed to be bioactive were selected as the VS library. All compounds were prepared with the Wash module in MOE and were ranked by the flexible docking with the “induced fit” protocol. Prior to docking, the force field of AMBER10: EHT and the implicit solvation model of Reaction Field (R-field) were selected. The protonation state of the protein and the orientation of the hydrogens were optimized by QuickPrep module at the PH of 7 and temperature of 300 K. For flexible docking, the docked poses were ranked by London dG scoring first, then a force field refinement was carried out on the top 10 poses followed by a rescoring of GBVI/WSA dG and the best ranked pose was retained. After flexible docking, the top4000 molecules with lowest docking scores were selected and divided into structural clusters through fingerprint-based clustering and the best ranked 60 molecules were finally identified as potential hits.
Protein expression and purification
The ATG4B protein purification was performed as described before [67]. Briefly, 3×FLAG-tagged ATG4B were expressed in HEK293T cells. Four 15-cm dishes of cells were transfected with the plasmid for 48 h, and lysed in 4 ml lysis buffer (50 mM Tris-HCl pH 7.5, 300 mM KCl, 0.5% NP-40 [ThermoFisher Scientific 85,124], 5% glycerol, 1× protease inhibitor cocktail [Roche 4,693,116,001], 1 mM DTT) at 4°C for 1 h and sonicated (5 s on, 25 s off, 24 cycles). The lysate was then cleared by centrifugation at 13,800 × g for 20 min at 4°C. The proteins were affinity purified using 50 μl anti-FLAG M2 resin (Millipore, A2220) at 4°C for overnight. After extensive washing with wash buffer (50 mM Tris-HCl pH 7.5, 300 mM KCl, 5% glycerol, 1 mM DTT), proteins were eluted in 500 μl 3×FLAG peptide elution buffer (1 mg/ml 3×FLAG peptide [MedChemExpress, HY- P0319] in wash buffer) at 4°C for 4 h. Then the eluates were concentrated by ultrafiltration (Millipore, UFC801096) to 0.1 mg/ml and the buffer changed to 50 mM Tris-HCl, pH 8.0 and 150 mM NaCl. Protein purity was verified with SDS-PAGE followed by Coomassie Brilliant Blue staining.
ATG4B activity assay
Following our previous studies [27,68], the FITC-labeled peptides named as AU4S was used as substrate to determine the activity of ATG4B. Briefly, purified ATG4B (0.1 mg/ml) was preincubated with lopinavir at indicated concentrations at 37°C for 30 min. Then substrate AU4S was added at the final concentration of 0.2 μM in a total volume of 200 μl reaction buffer. After incubation at 37°C for 40 min in darkness, fluorescence intensity was measured with a fluorescence microplate reader at excitation/emission wavelength of 488 nm/521 nm. The fluorescence values of substrate alone were considered as corresponding background and negative control.
Animal experiment
Four- to five-week-old male BALB/c nude mice were purchased from Gem Pharmatech Biotechnology Co., Ltd. The mice were intravenously injected with 5 × 10⁶ of AGS-luc cells suspended in 100 μl, which were stably transfected with luciferase. Immediately, the mice were divided into two groups randomly (n = 10 per group), receiving lopinavir intraperitoneal injection (20 mg/kg per day) or isovolumetric corn oil (Beyotime, ST2308) every 2 days for 6 weeks. After 6 weeks, the mice were injected with D-luciferin, potassium salt (Solaribio, D9390) according to the manufacturer’s instructions, and the metastatic progression were detected by BLT AniView100 animal imaging system. Then the mice were sacrificed and the lungs were removed for hematoxylin – eosin (H&E) staining, in situ hybridization and IF staining. Mouse breeding was conducted at the Army Medical University’s Animal Center’s specific pathogen-free mouse facility. Army Medical University’s Institutional Animal Care and Use Committee authorized all mice trials.
Statistical analysis
Statistical analysis of the data was performed using GraphPad Prism 6.0 software, and the results were expressed as mean ± SD. The two groups were compared via a two-tailed Student’s t-test. One-way analysis of variance was performed to evaluate the group differences, while p < 0.05 was considered statistically significant.
Supplementary Material
Funding Statement
The work was supported by the National Natural Science Foundation of China [82273114 and 82073300]; Natural Science Foundation of Chongqing Municipality [CSTB2022NSCQ-LZX0018 and cstc2021jcyj-msxmX0318].
Disclosure statement
No potential conflict of interest was reported by the author(s).
Data availability statement
All data supporting this paper are presented within the paper and/or the Supplementary Materials. The datasets generated and/or analyzed during the current study are available from the corresponding author upon reasonable request.
Abbreviations
- ATG4B
autophagy related 4B cysteine peptidase
- Baf A1
bafilomycin A1
- ECM
extracellular matrix
- FDA
Food and Drug Administration
- FISH
fluorescence in situ hybridization
- FL
full length
- GAPDH
glyceraldehyde-3-phosphate dehydrogenase
- GC
gastric cancer
- HRP
horseradish peroxidase
- IF
immunofluorescence
- IHC
immunohistochemistry
- LLPS
liquid-liquid phase separation
- m6A
N6-methyladenosine
- MAP1LC3B/LC3B
microtubule associated protein 1 light chain 3 beta
- PTMs
post-translational modifications
- RBP
RNA-binding protein
- RIP
RNA-binding protein immunoprecipitation
- shRNA
short hairpin RNA
- siRNA
short interfering RNA
- SQSTM1
sequestosome 1
Supplementary material
Supplemental data for this article can be accessed online at https://doi.org/10.1080/15548627.2024.2325304
References
- [1].Park HJ, Ahn JY, Jung HY, et al. Clinical characteristics and outcomes of gastric cancer patients aged over 80 years: a retrospective case-control study. PLoS One. 2016;11(12):e0167615. doi: 10.1371/journal.pone.0167615 [DOI] [PMC free article] [PubMed] [Google Scholar]
- [2].Siegel RL, Miller KD, Fuchs HE, et al. Cancer statistics, 2022. CA Cancer J Clin. 2022;72(1):7–33. doi: 10.3322/caac.21708 [DOI] [PubMed] [Google Scholar]
- [3].Wu C, Li M, Meng H, et al. Analysis of status and countermeasures of cancer incidence and mortality in China. Sci China Life Sci. 2019;62(5):640–647. doi: 10.1007/s11427-018-9461-5 [DOI] [PubMed] [Google Scholar]
- [4].Massague J, Obenauf AC.. Metastatic colonization by circulating tumour cells. Nature. 2016;529(7586):298–306. doi: 10.1038/nature17038 [DOI] [PMC free article] [PubMed] [Google Scholar]
- [5].Gilmore AP. Anoikis. Cell Death Differ. 2005;12 Suppl 2(S2):1473–1477. doi: 10.1038/sj.cdd.4401723 [DOI] [PubMed] [Google Scholar]
- [6].Fidler IJ. The pathogenesis of cancer metastasis: the ’seed and soil’ hypothesis revisited. Nat Rev Cancer. 2003;3(6):453–458. doi: 10.1038/nrc1098 [DOI] [PubMed] [Google Scholar]
- [7].Paoli P, Giannoni E, Chiarugi P. Anoikis molecular pathways and its role in cancer progression. Biochim Biophys Acta. 2013;1833(12):3481–3498. doi: 10.1016/j.bbamcr.2013.06.026 [DOI] [PubMed] [Google Scholar]
- [8].Du SC, Yang Z, Lu XF, et al. Anoikis resistant gastric cancer cells promote angiogenesis and peritoneal metastasis through C/EBPβ-mediated PDGFB autocrine and paracrine signaling. Oncogene. 2021;40(38):5764–5779. doi: 10.1038/s41388-021-01988-y [DOI] [PubMed] [Google Scholar]
- [9].Ye G, Yang Q, Lei X, et al. Nuclear MYH9-induced CTNNB1 transcription, targeted by staurosporin, promotes gastric cancer cell anoikis resistance and metastasis. Theranostics. 2020;10(17):7545–7560. doi: 10.7150/thno.46001 [DOI] [PMC free article] [PubMed] [Google Scholar]
- [10].Zhang T, Wang B, Su F, et al. TCF7L2 promotes anoikis resistance and metastasis of gastric cancer by transcriptionally activating PLAUR. Int J Biol Sci. 2022;18(11):4560–4577. doi: 10.7150/ijbs.69933 [DOI] [PMC free article] [PubMed] [Google Scholar]
- [11].Debnath J. Detachment-induced autophagy during anoikis and lumen formation in epithelial acini. Autophagy. 2008;4(3):351–3. doi: 10.4161/auto.5523 [DOI] [PubMed] [Google Scholar]
- [12].Villar VH, Merhi F, Djavaheri-Mergny M, et al. Glutaminolysis and autophagy in cancer. Autophagy. 2015;11(8):1198–208. doi: 10.1080/15548627.2015.1053680 [DOI] [PMC free article] [PubMed] [Google Scholar]
- [13].Fu XT, Shi YH, Zhou J, et al. MicroRNA-30a suppresses autophagy-mediated anoikis resistance and metastasis in hepatocellular carcinoma. Cancer Lett. 2018;412:108–117. doi: 10.1016/j.canlet.2017.10.012 [DOI] [PubMed] [Google Scholar]
- [14].Peng YF, Shi YH, Ding ZB, et al. Autophagy inhibition suppresses pulmonary metastasis of HCC in mice via impairing anoikis resistance and colonization of HCC cells. Autophagy. 2013;9(12):2056–68. doi: 10.4161/auto.26398 [DOI] [PubMed] [Google Scholar]
- [15].Talukdar S, Pradhan AK, Bhoopathi P, et al. MDA-9/Syntenin regulates protective autophagy in anoikis-resistant glioma stem cells. Proc Natl Acad Sci U S A. 2018;115(22):5768–5773. doi: 10.1073/pnas.1721650115 [DOI] [PMC free article] [PubMed] [Google Scholar]
- [16].Yu Y, Liu B, Li XX, et al. ATF4/CEMIP/PKCα promotes anoikis resistance by enhancing protective autophagy in prostate cancer cells. Cell Death Dis. 2022;13(1). doi: 10.1038/s41419-021-04494-x [DOI] [PMC free article] [PubMed] [Google Scholar]
- [17].Yu Y, Song Y, Cheng L, et al. CircCEMIP promotes anoikis-resistance by enhancing protective autophagy in prostate cancer cells. J Exp Clin Cancer Res. 2022;41(1):188. doi: 10.1186/s13046-022-02381-7 [DOI] [PMC free article] [PubMed] [Google Scholar]
- [18].Wirth M, Zhang W, Razi M, et al. Molecular determinants regulating selective binding of autophagy adapters and receptors to ATG8 proteins. Nat Commun. 2019;10(1):2055. doi: 10.1038/s41467-019-10059-6 [DOI] [PMC free article] [PubMed] [Google Scholar]
- [19].Xie Y, Kang R, Sun X, et al. Posttranslational modification of autophagy-related proteins in macroautophagy. Autophagy. 2015;11(1):28–45. doi: 10.4161/15548627.2014.984267 [DOI] [PMC free article] [PubMed] [Google Scholar]
- [20].Yu ZQ, Ni T, Hong B, et al. Dual roles of Atg8−PE deconjugation by Atg4 in autophagy. Autophagy. 2012;8(6):883–892. doi: 10.4161/auto.19652 [DOI] [PMC free article] [PubMed] [Google Scholar]
- [21].Kabeya Y, Mizushima N, Ueno T, et al. LC3, a mammalian homolog of yeast Apg8p, is localized in autophagosome membranes after processing (vol 19, 5720, 2003). EMBO J. 2000;19(21):4577–4577. doi: 10.1093/emboj/19.21.5720 [DOI] [PMC free article] [PubMed] [Google Scholar]
- [22].Nguyen TN, Padman BS, Usher J, et al. Atg8 family LC3/GABARAP proteins are crucial for autophagosome–lysosome fusion but not autophagosome formation during PINK1/Parkin mitophagy and starvation. J Cell Bio. 2016;215(6):857–874. doi: 10.1083/jcb.201607039 [DOI] [PMC free article] [PubMed] [Google Scholar]
- [23].Xie Z, Nair U, Klionsky DJ, et al. Atg8 controls phagophore expansion during autophagosome formation. Mol Biol Cell. 2008;19(8):3290–8. doi: 10.1091/mbc.e07-12-1292 [DOI] [PMC free article] [PubMed] [Google Scholar]
- [24].Zhang N, Wu Y, Lyu X, et al. HSF1 upregulates ATG4B expression and enhances epirubicin-induced protective autophagy in hepatocellular carcinoma cells. Cancer Lett. 2017;409:81–90. doi: 10.1016/j.canlet.2017.08.039 [DOI] [PubMed] [Google Scholar]
- [25].Wu Y, Ni Z, Yan X, et al. Targeting the MIR34C-5p-ATG4B-autophagy axis enhances the sensitivity of cervical cancer cells to pirarubicin. Autophagy. 2016;12(7):1105–17. doi: 10.1080/15548627.2016.1173798 [DOI] [PMC free article] [PubMed] [Google Scholar]
- [26].Ni Z, He J, Wu Y, et al. AKT-mediated phosphorylation of ATG4B impairs mitochondrial activity and enhances the warburg effect in hepatocellular carcinoma cells. Autophagy. 2018;14(4):685–701. doi: 10.1080/15548627.2017.1407887 [DOI] [PMC free article] [PubMed] [Google Scholar]
- [27].Sun L, Xiong H, Chen L, et al. Deacetylation of ATG4B promotes autophagy initiation under starvation. Sci Adv. 2022;8(31):eabo0412. doi: 10.1126/sciadv.abo0412 [DOI] [PMC free article] [PubMed] [Google Scholar]
- [28].Fu Y, Huang Z, Hong L, et al. Targeting ATG4 in cancer therapy. Cancers (Basel). 2019;11(5):11. doi: 10.3390/cancers11050649 [DOI] [PMC free article] [PubMed] [Google Scholar]
- [29].Fu YY, Gu QQ, Luo L, et al. New anti-cancer strategy to suppress colorectal cancer growth through inhibition of ATG4B and lysosome function. Cancers (Basel). 2020;12(6):12. doi: 10.3390/cancers12061523 [DOI] [PMC free article] [PubMed] [Google Scholar]
- [30].Yang G, Li Y, Zhao Y, et al. Targeting Atg4B for cancer therapy: chemical mediators. Eur J Med Chem. 2021;209:112917. doi: 10.1016/j.ejmech.2020.112917 [DOI] [PubMed] [Google Scholar]
- [31].Martinez-Garcia GG, Perez RF, Fernandez ÁF, et al. Autophagy deficiency by Atg4B loss leads to metabolomic alterations in mice. Metabolites. 2021;11(8):11. doi: 10.3390/metabo11080481 [DOI] [PMC free article] [PubMed] [Google Scholar]
- [32].Urdaneta EC, Vieira-Vieira CH, Hick T, et al. Purification of cross-linked RNA-protein complexes by phenol-toluol extraction. Nat Commun. 2019;10(1):990. doi: 10.1038/s41467-019-08942-3 [DOI] [PMC free article] [PubMed] [Google Scholar]
- [33].Boeynaems S, Alberti S, Fawzi NL, et al. Protein phase separation: a new phase in cell biology. Trends Cell Biol. 2018;28(6):420–435. doi: 10.1016/j.tcb.2018.02.004 [DOI] [PMC free article] [PubMed] [Google Scholar]
- [34].Li RH, Tian T, Ge QW, et al. A phosphatidic acid-binding lncRNA SNHG9 facilitates LATS1 liquid–liquid phase separation to promote oncogenic YAP signaling. Cell Res. 2021;31(10):1088–1105. doi: 10.1038/s41422-021-00530-9 [DOI] [PMC free article] [PubMed] [Google Scholar]
- [35].Shin Y, Brangwynne CP. Liquid phase condensation in cell physiology and disease. Science. 2017;357(6357). doi: 10.1126/science.aaf4382 [DOI] [PubMed] [Google Scholar]
- [36].Luo YY, Wu JJ, Li YM. Regulation of liquid–liquid phase separation with focus on post-translational modifications. Chem Commun (Camb). 2021;57(98):13275–13287. doi: 10.1039/D1CC05266G [DOI] [PubMed] [Google Scholar]
- [37].Li J, Zhu K, Gu A, et al. Feedback regulation of ubiquitination and phase separation of HECT E3 ligases. Proc Natl Acad Sci U S A. 2023;120(33):e2302478120. doi: 10.1073/pnas.2302478120 [DOI] [PMC free article] [PubMed] [Google Scholar]
- [38].Su M, Xiao YH, Ma JL, et al. Circular RNAs in cancer: emerging functions in hallmarks, stemness, resistance and roles as potential biomarkers. Mol Cancer. 2019;18(1):18. doi: 10.1186/s12943-019-1002-6 [DOI] [PMC free article] [PubMed] [Google Scholar]
- [39].Wang SM, Zhang K, Tan SY, et al. Circular RNAs in body fluids as cancer biomarkers: the new frontier of liquid biopsies. Mol Cancer. 2021;20(1):20. doi: 10.1186/s12943-020-01298-z [DOI] [PMC free article] [PubMed] [Google Scholar]
- [40].Cui XL, Wang JX, Guo ZJ, et al. Emerging function and potential diagnostic value of circular RNAs in cancer. Mol Cancer. 2018;17(1):17. doi: 10.1186/s12943-018-0877-y [DOI] [PMC free article] [PubMed] [Google Scholar]
- [41].Patop IL, Wust S, Kadener S. Past, present, and future of circRnas. EMBO J. 2019;38(16):e100836. doi: 10.15252/embj.2018100836 [DOI] [PMC free article] [PubMed] [Google Scholar]
- [42].Chen LL. The expanding regulatory mechanisms and cellular functions of circular RNAs. Nat Rev Mol Cell Biol. 2020;21(8):475–490. doi: 10.1038/s41580-020-0243-y [DOI] [PubMed] [Google Scholar]
- [43].Liu CX, Chen LL. Circular RNAs: Characterization, cellular roles, and applications. Cell. 2022;185(13):2390. doi: 10.1016/j.cell.2022.06.001 [DOI] [PubMed] [Google Scholar]
- [44].Stroberg W, Schnell S. Do Cellular Condensates Accelerate Biochemical Reactions? Lessons from Microdroplet Chemistry. Biophys J. 2018;115(1):3–8. doi: 10.1016/j.bpj.2018.05.023 [DOI] [PMC free article] [PubMed] [Google Scholar]
- [45].Liu B, Shen H, He J, et al. Cytoskeleton remodeling mediated by circRNA-YBX1 phase separation suppresses the metastasis of liver cancer. Proc Natl Acad Sci U S A. 2023;120(30):e2220296120. doi: 10.1073/pnas.2220296120 [DOI] [PMC free article] [PubMed] [Google Scholar]
- [46].Chong PA, Forman-Kay JD. Liquid–liquid phase separation in cellular signaling systems. Curr Opin Struct Biol. 2016;41:180–186. doi: 10.1016/j.sbi.2016.08.001 [DOI] [PubMed] [Google Scholar]
- [47].Kuang E, Okumura CY, Sheffy-Levin S, et al. Regulation of ATG4B stability by RNF5 limits basal levels of autophagy and influences susceptibility to bacterial infection. PLoS Genet. 2012;8(10):e1003007. doi: 10.1371/journal.pgen.1003007 [DOI] [PMC free article] [PubMed] [Google Scholar]
- [48].Kristensen LS, Jakobsen T, Hager H, et al. The emerging roles of circRnas in cancer and oncology. Nat Rev Clin Oncol. 2022;19(3):188–206. doi: 10.1038/s41571-021-00585-y [DOI] [PubMed] [Google Scholar]
- [49].Zhang L, Hou C, Chen C, et al. The role of N6-methyladenosine (m6A) modification in the regulation of circRnas. Mol Cancer. 2020;19(1):105. doi: 10.1186/s12943-020-01224-3 [DOI] [PMC free article] [PubMed] [Google Scholar]
- [50].Di Timoteo G, Dattilo D, Centron-Broco A, et al. Modulation of circRNA metabolism by m6A modification. Cell Rep. 2020;31(6):107641. doi: 10.1016/j.celrep.2020.107641 [DOI] [PubMed] [Google Scholar]
- [51].Chen RX, Chen X, Xia LP, et al. N6-methyladenosine modification of circNSUN2 facilitates cytoplasmic export and stabilizes HMGA2 to promote colorectal liver metastasis. Nat Commun. 2019;10(1):4695. doi: 10.1038/s41467-019-12651-2 [DOI] [PMC free article] [PubMed] [Google Scholar]
- [52].Xu J, Wan Z, Tang M, et al. N6-methyladenosine-modified CircRNA-SORE sustains sorafenib resistance in hepatocellular carcinoma by regulating β-catenin signaling. Mol Cancer. 2020;19(1):163. doi: 10.1186/s12943-020-01281-8 [DOI] [PMC free article] [PubMed] [Google Scholar]
- [53].Hu Y, Gong C, Li Z, et al. Demethylase ALKBH5 suppresses invasion of gastric cancer via PKMYT1 m6A modification. Mol Cancer. 2022;21(1):34. doi: 10.1186/s12943-022-01522-y [DOI] [PMC free article] [PubMed] [Google Scholar]
- [54].Lal P, Cerofolini L, D’Agostino VG, et al. Regulation of HuR structure and function by dihydrotanshinone-I. Nucleic Acids Res. 2017;45(16):9514–9527. doi: 10.1093/nar/gkx623 [DOI] [PMC free article] [PubMed] [Google Scholar]
- [55].Chen X, Wang Y, Wang JN, et al. m(6)A modification of circSPECC1 suppresses RPE oxidative damage and maintains retinal homeostasis. Cell Rep. 2022;41(7):111671. doi: 10.1016/j.celrep.2022.111671 [DOI] [PubMed] [Google Scholar]
- [56].Schultz CW, Preet R, Dhir T, et al. Understanding and targeting the disease-related RNA binding protein human antigen R (HuR). Wiley Interdiscip Rev RNA. 2020;11(3):e1581. doi: 10.1002/wrna.1581 [DOI] [PMC free article] [PubMed] [Google Scholar]
- [57].Paskas S, Mazzon E, Basile MS, et al. Lopinavir-NO, a nitric oxide-releasing HIV protease inhibitor, suppresses the growth of melanoma cells in vitro and in vivo. Invest New Drugs. 2019;37(5):1014–1028. doi: 10.1007/s10637-019-00733-3 [DOI] [PubMed] [Google Scholar]
- [58].Marima R, Hull R, Dlamini Z, et al. Efavirenz and Lopinavir/Ritonavir Alter Cell Cycle Regulation in Lung Cancer. Front Oncol. 2020;10:1693. doi: 10.3389/fonc.2020.01693 [DOI] [PMC free article] [PubMed] [Google Scholar]
- [59].Alaei M, Nazari SE, Pourali G, et al. Therapeutic potential of targeting the cytochrome P450 enzymes using Lopinavir/Ritonavir in colorectal cancer: a study in monolayers, spheroids and in vivo models. Cancers (Basel). 2023;15(15):15. doi: 10.3390/cancers15153939 [DOI] [PMC free article] [PubMed] [Google Scholar]
- [60].Obiedat A, Charpak-Amikam Y, Tai-Schmiedel J, et al. The integrated stress response promotes B7H6 expression. J Mol Med (Berl). 2020;98(1):135–148. doi: 10.1007/s00109-019-01859-w [DOI] [PMC free article] [PubMed] [Google Scholar]
- [61].Hakim JG, Thompson J, Kityo C, et al. Lopinavir plus nucleoside reverse-transcriptase inhibitors, lopinavir plus raltegravir, or lopinavir monotherapy for second-line treatment of HIV (EARNEST): 144-week follow-up results from a randomised controlled trial. Lancet Infect Dis. 2018;18(1):47–57. doi: 10.1016/S1473-3099(17)30630-8 [DOI] [PMC free article] [PubMed] [Google Scholar]
- [62].Klement-Frutos E, Burrel S, Peytavin G, et al. Early administration of ritonavir-boosted lopinavir could prevent severe COVID-19. J Infection. 2021;82(1):194–197. doi: 10.1016/j.jinf.2020.05.039 [DOI] [PMC free article] [PubMed] [Google Scholar]
- [63].Park OH, Ha H, Lee Y, et al. Endoribonucleolytic cleavage of m(6)A-Containing RNAs by RNase P/MRP complex. Mol Cell. 2019;74(3):494–507.e8. doi: 10.1016/j.molcel.2019.02.034 [DOI] [PubMed] [Google Scholar]
- [64].Croxtall JD, Perry CM. Lopinavir/Ritonavir: a review of its use in the management of HIV-1 infection. Drugs. 2010;70(14):1885–915. doi: 10.2165/11204950-000000000-00000 [DOI] [PubMed] [Google Scholar]
- [65].Sham HL, Kempf DJ, Molla A, et al. ABT-378, a highly potent inhibitor of the human immunodeficiency virus protease. Antimicrob Agents Chemother. 1998;42(12):3218–24. doi: 10.1128/AAC.42.12.3218 [DOI] [PMC free article] [PubMed] [Google Scholar]
- [66].Liu X, Abraham JM, Cheng Y, et al. Synthetic circular RNA functions as a miR-21 sponge to suppress gastric carcinoma cell proliferation. Mol Ther Nucleic Acids. 2018;13:312–321. doi: 10.1016/j.omtn.2018.09.010 [DOI] [PMC free article] [PubMed] [Google Scholar]
- [67].Huang H, Weng H, Sun W, et al. Recognition of RNA N6-methyladenosine by IGF2BP proteins enhances mRNA stability and translation. Nat Cell Biol. 2018;20(3):285–295. doi: 10.1038/s41556-018-0045-z [DOI] [PMC free article] [PubMed] [Google Scholar]
- [68].Ni Z, Gong Y, Dai X, et al. AU4S: a novel synthetic peptide to measure the activity of ATG4 in living cells. Autophagy. 2015;11(2):403–15. doi: 10.1080/15548627.2015.1009773 [DOI] [PMC free article] [PubMed] [Google Scholar]
Associated Data
This section collects any data citations, data availability statements, or supplementary materials included in this article.
Supplementary Materials
Data Availability Statement
All data supporting this paper are presented within the paper and/or the Supplementary Materials. The datasets generated and/or analyzed during the current study are available from the corresponding author upon reasonable request.