

Abstract
The neurophysiological effects of spinal cord stimulation (SCS) for chronic pain are poorly understood, resulting in inefficient failure-prone programming protocols and inadequate pain relief. Nonetheless, novel stimulation patterns are regularly introduced and adopted clinically. Traditionally, paresthetic sensation is considered necessary for pain relief, although novel paradigms provide analgesia without paresthesia. However, like pain relief, the neurophysiological underpinnings of SCS-induced paresthesia are unknown. Here, we paired biophysical modeling with clinical paresthesia thresholds (of both sexes) to investigate how stimulation frequency affects the neural response to SCS relevant to paresthesia and analgesia. Specifically, we modeled the dorsal column (DC) axonal response, dorsal column nucleus (DCN) synaptic transmission, conduction failure within DC fiber collaterals, and dorsal horn network output. Importantly, we found that high-frequency stimulation reduces DC fiber activation thresholds, which in turn accurately predicts clinical paresthesia perception thresholds. Furthermore, we show that high-frequency SCS produces asynchronous DC fiber spiking and ultimately asynchronous DCN output, offering a plausible biophysical basis for why high-frequency SCS is less comfortable and produces qualitatively different sensation than low-frequency stimulation. Finally, we demonstrate that the model dorsal horn network output is sensitive to SCS-inherent variations in spike timing, which could contribute to heterogeneous pain relief across patients. Importantly, we show that model DC fiber collaterals cannot reliably follow high-frequency stimulation, strongly affecting the network output and typically producing antinociceptive effects at high frequencies. Altogether, these findings clarify how SCS affects the nervous system and provide insight into the biophysics of paresthesia generation and pain relief.
Keywords: chronic pain, computer simulation, electric stimulation, paresthesia, somatosensation, spinal cord stimulation
Significance Statement
The effects of spinal cord stimulation (SCS) on the nervous system are poorly understood, resulting in inadequate clinical success rates. Here, we use a biophysical modeling approach to investigate the neural response to SCS. We demonstrate that low- and high-frequency stimulations produce contrasting responses in the dorsal columns, brainstem, and dorsal horn. Importantly, our modeling approach was able to accurately predict clinical paresthesia thresholds as a function of frequency as well as provide plausible biophysical explanations for frequency-dependent effects on paresthesia quality and pain relief. Overall, our results greatly enhance our understanding of the neural response to SCS, thereby offering context for interpreting clinical observations and crucial insight for development of future SCS systems.
Introduction
Spinal cord stimulation (SCS) is a common neurostimulation treatment for refractory chronic pain, which was originally designed to exploit the “gate control theory of pain” (Melzack and Wall, 1965). Briefly, mechanoreceptors directly transmit innocuous touch information to the brainstem dorsal column nuclei (DCN) through the dorsal columns (DC) in the dorsomedial spinal cord. While ascending, these fibers send small-diameter collaterals into the dorsal horn that branch into tortuous, ramified arbors and synapse locally (Brown, 1981; Abraira and Ginty, 2013). SCS seeks to activate these DC fibers and, through their collaterals, postsynaptically activate inhibitory dorsal horn interneurons, thereby inhibiting painful signaling. Importantly, activating these mechanoreceptors also produces tingling (“paresthesia”) that should overlap the painful region for optimal pain relief (North et al., 1991). This framework (“conventional SCS”) was the only option available for several decades, whereas recently developed SCS paradigms do not produce paresthesia, suggesting potential alternative analgesic mechanisms and neurophysiological effects (de Ridder et al., 2010; Tiede et al., 2013; Jones et al., 2021; Metzger et al., 2021).
Despite over 50 years of clinical experience, the neural response to SCS remains poorly understood, and only ∼60% of patients respond successfully (i.e., report a 50% reduction in pain; Titus et al., 2020). It is imperative to understand how SCS affects the nervous system to improve clinical outcomes.
One crucial SCS parameter is pulse frequency (i.e., the number of pulses per second), as clinical and preclinical studies indicate that SCS's neurophysiological effects are frequency-dependent and optimal pain relief depends on proper frequency selection (Sato et al., 2013; Zhang et al., 2014; De Groote et al., 2018). For conventional SCS, the prototypical frequency is 50 Hz (Miller et al., 2016). However, this varies according to patient preference (North et al., 1993), and novel waveforms utilize frequencies ≥1 kHz which are delivered without concomitant paresthesia (Lempka and Patil, 2018). To date, the mechanism of high-frequency paresthesia–free SCS is unknown. One proposal is that high-frequency SCS preferentially activates the dorsal horn without activating DC fibers (K. Y. Lee et al., 2020), although computational modeling studies challenge the plausibility of this hypothesis (Rogers et al., 2022, 2023; Mirzakhalili et al., 2023). A competing hypothesis suggests that high-frequency SCS may not be perceivable due to asynchronous DC firing induced during high-frequency stimulation (Sagalajev et al., 2023).
In this study, we combined biophysical modeling with self-reported paresthesia thresholds from SCS patients to investigate the neurophysiological effects of SCS. Our modeling approach assessed the DC fiber response, synaptic transmission in the DCN, and dorsal horn pain processing (including the effect of collateral filtering).
Our results reveal several essential and translatable insights into the frequency-dependent neural response to SCS, relevant to pain processing and paresthesia. Importantly, we found that the model DC fiber response is qualitatively different at low and high frequencies, as high-rate SCS requires lower activation thresholds, produces asynchronous population firing, and induces bursting firing patterns (in an amplitude-dependent fashion). Crucially, we demonstrate that these frequency-dependent activation thresholds closely mirror clinical paresthesia thresholds, suggesting that paresthesia's frequency-dependent perception thresholds (PTs) could arise from differences in fiber activation thresholds, rather than precise spike timing or synchrony. Furthermore, we find that high-frequency SCS produces an asynchronous DCN output, offering a plausible biophysical basis for differences in paresthesia quality (and tolerability) at low and high frequencies. Finally, we show that dorsal horn pain processing is sensitive to frequency-dependent spike timing variability in DC fibers, a plausible biophysical explanation for heterogeneous clinical outcomes, and the output is more variable at the highest frequencies. Interestingly, an experimentally validated dorsal horn network model (Zhang et al., 2014) often predicted increased pain during high-frequency SCS, which is not consistent with clinical observations. Using biophysical models of DC fiber collaterals, we demonstrate that branch point conduction failure reduces the network output at high frequencies, thereby resolving this discrepancy. Overall, these computational modeling analyses provide testable hypotheses for future preclinical and clinical experiments and offer plausible biophysical bases for clinical observations.
Materials and Methods
In this study, we investigated the effects of stimulation frequency on the neural response to SCS. We collected paresthesia thresholds from SCS patients at various frequencies between 2 and 1,000 Hz. We also modeled the DC fiber activation properties at the same frequencies, as well as the synapse between these fibers and projection neurons in the DCN, and we compared model predictions with the clinical data. We additionally considered the effects of realistic axonal firing rates on the output from dorsal horn pain projecting neurons. Finally, we produced models of DC fiber collaterals and analyzed their ability to faithfully propagate spike trains of various frequencies throughout their arbors. A simplified overview of the computational modeling study is provided in Figure 1.
Figure 1.

Overview of the computational modeling study. We evaluated the effects of stimulation frequency on four relevant phenomena: (1) The DC fiber firing response (red box). (2) Synaptic transmission at the DC-to-DCN synapse (green box). (3) Action potential conduction failure at the axon terminals of DC fiber collaterals (blue box). (4) Output of the dorsal horn pain processing network (brown box).
Human paresthesia thresholds
We asked 16 SCS patients (eight males, eight females) to report relevant thresholds related to SCS-induced paresthesia while undergoing stimulation at frequencies between 2 and 1,000 Hz. We collected data as part of two separate studies conducted at the University of Michigan after obtaining approval from the medical Institutional Review Board. One study was a clinical trial registered at ClinicalTrials.gov (https://clinicaltrials.gov/show/NCT04732325). All participants provided written informed consent prior to participation in either study. These participants all had permanently implanted SCS systems for treatment of chronic pain per their standard clinical care. We instructed the participants to lie supine. Then, using a fixed-pulse width of 200 µs, we applied SCS at frequencies of 2, 10, 50, 100, 500, and either 900 or 1,000 Hz (depending on hardware capabilities). We tested 10 participants with 1,000 Hz and 6 participants with 900 Hz.
We randomized the order of the frequencies and allowed a rest period of at least 1 min between testing different frequencies. We asked participants to report three different thresholds: (1) PT, when participants first felt a stimulation-induced sensation; (2) comfort threshold (CT), the maximum stimulation amplitude that participants would comfortably run continuously; and (3) discomfort threshold (DT), the amplitude at which the stimulation became acutely uncomfortable. We used an identical programming procedure to that described in Lempka et al. (2020; except we used current-controlled stimulation). For each frequency, we first collected PT using a triangulation method (increase amplitude in 0.1 mA increments until perception, decrease until the sensation was lost, and then increase until sensation returned). The amplitude was then incrementally increased until DT was reported and then immediately decreased to CT.
Given the small sample size, nonnormally distributed data, and outliers, we employed nonparametric statistics to compare thresholds at the various frequencies. Specifically, we used the Wilcoxon signed-rank test to perform pairwise comparisons of thresholds at the different frequencies. We did not correct for multiple comparisons due to the exploratory nature of the analysis.
Direct axonal response to SCS at various frequencies
When stimulated at pulse amplitudes close to their activation threshold, axons will typically not fire an action potential in response to each stimulation pulse. Instead, the axon will often show more complex behavior, such as bursting, firing asynchronously, or spiking at a subharmonic frequency (Gilbert et al., 2022). Here, we utilized an existing SCS modeling infrastructure to evaluate firing behavior in DC axons at stimulation amplitudes close to activation threshold (“juxtathreshold”). In brief, we modeled the SCS axonal response using the McIntyre–Richardson–Grill (MRG) axon model, a standard and validated model for mammalian axons (McIntyre et al., 2002; Mirzakhalili et al., 2020). We placed the axon in a previously developed three-dimensional volume conductor model of the human lower thoracic spinal cord (Anaya et al., 2020; Zander et al., 2020; Rogers et al., 2022), approximately at midline and 100 µm ventral to the surface of the spinal cord white matter. We then used finite element analysis (COMSOL Multiphysics) to evaluate the electric potential generated along the axon by SCS applied via a standard bipolar configuration, and we quantified the axonal response using the software package NEURON (version 7.4) through a Python interface (Hines and Carnevale, 1997; Liang et al., 2022). The model fiber had a diameter of 10 µm. We simulated 1 s of SCS, utilizing a time step of 5 µs. We utilized symmetric biphasic stimulation pulses. Each phase had a pulse width of 200 µs that were separated by an 80 µs interphase interval. To mimic our clinical data, we tested the axonal response to frequencies of 2, 10, 50, 100, 500, and 1,000 Hz. One consideration is that participants used a variety of clinical stimulators, which may utilize passive recharge at the lower frequencies tested up to 100 Hz and active recharge at 500 and 1,000 Hz. This difference should not affect thresholds due to the long interphase interval (van den Honert and Mortimer, 1979; Gorman and Mortimer, 1983), and it is common in modeling studies to even neglect the recharge phase in light of this consideration (D. Lee et al., 2011).
DCN model
Synaptic transmission properties are frequency dependent (Thomson, 2000). Therefore, a comprehensive understanding of the frequency-varying effects of SCS must consider the synaptic transmission properties between DC fibers and their postsynaptic targets. In this study, we specifically considered the synapse between DC fibers and their postsynaptic targets in the DCN (i.e., the gracile and cuneate nuclei). These nuclei contain the first synapse in the pathway linking innocuous mechanical stimuli carried by DC fibers to perception (Abraira and Ginty, 2013). Thus, their frequency filtering properties should affect the quality (and initial PT) of sensation in paresthetic SCS as well as contribute to supraspinal feedback loops regulating descending pain inhibition.
To investigate the synaptic transmission properties at the DCN synapse during SCS-relevant frequencies, we constructed a DCN projection neuron model using published experimental data. We began by adopting a model previously generated for pallidal deep-brain stimulation, as this neuron was morphologically similar to those described in the DCN and displayed similar electrophysiological properties and active conductances (Johnson and McIntyre, 2008). We then adjusted the model parameters to produce a final DCN projection neuron model that demonstrated excellent agreement with published experimental data (input resistance, spontaneous firing frequency, resting membrane potential, action potential duration and amplitude, and membrane time constant; Table 1; Nuñez and Buño, 1999; Bengtsson et al., 2013). We provide the active channel properties in Table 2. Next, we incorporated an experimentally derived model of the synapse between DC afferents and a DCN-to-thalamus projection neuron. In line with similar investigations in deep-brain stimulation, we employed a Tsodyks–Markram phenomenological synapse model (Tsodyks and Markram, 1997; Farokhniaee and McIntyre, 2019). We then tuned this model to recreate experimentally recorded properties of excitatory postsynaptic potentials (EPSPs) in DCN projection neurons. Specifically, we calibrated the EPSPs to closely match EPSP rise time, decay time, and amplitude, accounting for frequency-dependent EPSP amplitude variation (Table 1, Fig. 2; Nuñez and Buño, 1999; Bengtsson et al., 2013). Finally, we evaluated the synaptic transmission properties at a range of frequencies between 10 and 400 Hz and assessed sensitivity of the model to unitary EPSP amplitude. Post hoc comparison of the final model to experimental results demonstrated excellent agreement between model firing rates in response to DC fiber stimulation and available published data (Ferrington et al., 1987; Vickery et al., 1994; Gynther et al., 1995; Rowe, 2002; Turecek et al., 2022).
Table 1.
DCN model validation metrics
| Parameter | Model | Experimental values | References |
|---|---|---|---|
| Soma diameter | 18.0 | 19.0 ± 1.8 µm | Nuñez and Buño (1999) |
| Soma length | 30.0 | 33.2 ± 5.8 µm | Nuñez and Buño (1999) |
| AP amplitude | 76.0 mV | 75.3 ± 0.89 mV | Nuñez and Buño (1999) |
| AP duration | 0.8 ms (FWHM) | 0.7 ± 0.05 ms | Nuñez and Buño (1999) |
| Membrane time constant | 5.7 ms | 5.2 ± 1.8 ms | Bengtsson et al. (2013) |
| Input resistance | 78 MΩ | 96 ± 43 MΩ | Bengtsson et al. (2013) |
| Spontaneous firing rate | 9.7 Hz | ∼10.0 Hz | Bengtsson et al. (2013) |
| Resting potential | −55.5 mV | −52.8 ± 1.0 mV | Bengtsson et al. (2013) |
| EPSP rise time | 1.04 ms | 1.08 ± 0.15 ms | Bengtsson et al. (2013) |
| EPSP decay time | 5.55 ms | 6.40 ± 1.90 ms | Bengtsson et al. (2013) |
| EPSP amplitude (baseline) | 4.0 mV | 3.7 ± 1.5 mV | Bengtsson et al. (2013) |
Comparison of the DCN computational model parameters with experimental data. Experimental data come from Nuñez and Buño (1999) and Bengtsson et al. (2013).
Table 2.
DCN model ionic conductances
| Current | Description | gion (S/cm2) |
|---|---|---|
| NaF | Fast sodium | 0.028 |
| NaP | Persistent sodium | 0.0005 |
| HCN | Hyperpolarization-activated inward cation current | 0.002 |
| KDR | Delayed rectifier potassium | 0.006 |
| iKCa | Calcium-activated potassium channel | 2.5 × 10⁻⁵ |
| CaL | L-type calcium | 0.0001 |
| CaN | N-type calcium | 0.001 |
| CaT | T-type calcium | 0.0001 |
Ionic conductances in the DCN cell model soma. Conductances were equal in the dendrites, where NaF was 1 × 10⁻⁷ S/cm2.
Figure 2.

Comparison of the frequency-dependent EPSP amplitude between experimental data (left) and our computational model (right). Experimental data and figure are recreated from Nuñez and Buño (1999).
Dorsal horn pain processing
The overall goal of conventional SCS is to reduce painful signaling in the dorsal horn. We sought to test two hypotheses regarding dorsal horn pain processing during SCS. First, we hypothesized that the DC fiber population in humans has heterogeneous responses to a single applied stimulus and that dorsal horn pain processing is sensitive to this spike timing variability. Second, previous modeling work has predicted that high-frequency SCS will increase dorsal horn painful transmission (i.e., make pain worse compared with the baseline; Zhang et al., 2014; Gilbert et al., 2022). However, this disagrees with our observation that subjects do not report increased pain during high-frequency stimulation, suggesting a disconnect between the model and clinical outcomes. This is a crucial issue to resolve as recently it has been proposed that kilohertz-frequency SCS relieves pain through DC activation (i.e., through gate control; Sagalajev et al., 2023), which previous models would suggest is infeasible due to overwhelming excitatory drive from local Aβ-fibers (Zhang et al., 2014). Given recent evidence that high-frequency transmission in DC fiber collaterals is prone to failure (i.e., spikes fail to propagate to all of these fibers’ terminals at high frequencies; Hari et al., 2022), we hypothesized that frequency-dependent failure reduces dorsal horn drive during high-frequency stimulation, thereby having an antinociceptive effect and helping explain this paradox. To test these hypotheses, we utilized the experimentally validated dorsal horn network model developed by Zhang et al. (2014; ModelDB accession number 168414). Briefly, the output of this model is the firing rate of the wide-dynamic-range (WDR) transmission (“T”) neuron. The WDR neuron receives an input from local inhibitory and excitatory interneurons, as well as direct inhibition from a surround receptive field inhibitory interneuron. The input to the network comes from 15 local receptive field Aβ-fibers, 15 surround receptive field Aβ-fibers, 15 Aδ-fibers, and 30 unmyelinated C-fibers.
To apply input into the model, we generated a random input in the Aδ- and C-fibers according to homogeneous Poisson processes with mean rates of 2.2 and 1.5 spikes/s, respectively (Zhang et al., 2014). For the local Aβ-fibers, we sampled the firing behavior of a population of DC fibers in our model (at CT), only choosing from fibers that were activated by the SCS (with a mean baseline spontaneous firing rate of 2.2 spikes/s to model neuropathic pain). For the Aβ-fibers from the surround receptive field, we randomly sampled firing rates from the entire population of DC fibers, and they had no ongoing baseline spontaneous activity (as they represent a nonpainful and nontargeted dermatome). For each frequency tested, we repeated this process 50 times to account for variation in fiber firing frequencies.
Axon collateral models
Recent experimental evidence has demonstrated the ubiquity of branch point conduction failure in DC fiber collaterals at frequencies employed in both conventional and novel SCS systems, and we hypothesized that pain processing in the dorsal horn would be sensitive to the changes in the input induced by this phenomenon at high frequencies (Hari et al., 2022). To examine action potential fidelity within DC collateral terminal arbors, we stochastically generated branching axon structures within the dorsal horn of a lower thoracic spinal cord model (described in detail in several previous publications; Anaya et al., 2020; Zander et al., 2020; Rogers et al., 2022). We then introduced trains of action potentials at various frequencies into these collateral models and observed the firing properties at the axon terminal nodes.
Primary afferent collaterals produce morphologically diverse termination patterns within the dorsal horn (Brown et al., 1978; Brown, 1981). Cellular morphology affects bioelectric activity, and thus we generated a set of morphologically heterogeneous collateral termination models to account for variable responses in different terminal arbors. In total, we produced 25 afferent collateral models. Published descriptions of collateral terminal arbor geometries typically provide only gross anatomical descriptions, and specific quantitative measurements are sparse (Brown et al., 1978, 1980, 1981; Brown, 1981). Therefore, we used a simple algorithm to stochastically generate realistic collateral termination patterns. We modeled the collaterals as connected smooth curves (B-splines) located within the dorsal horn gray matter of a lower thoracic volume conductor model of the spinal cord. The volume conductor model has been described in detail in several previous publications (Anaya et al., 2020; Zander et al., 2020; Rogers et al., 2022). A number of branch points, as well as the location of the branch points, were randomly selected from uniform distributions. The maximum number of branches off the first-order collateral was 7. Second-order collaterals produced a maximum of three branches, and third-order collaterals produced a maximum of two branches. The total number of branch points within the collaterals ranged from 3 to 34 (median, 16). We selected parameters based on previously published collateral reconstructions (Brown et al., 1978, 1980, 1981; Brown, 1981; Niu et al., 2013; Hari et al., 2022). Cross sections of the 25 collateral models are shown in Figure 3.
Figure 3.

Two-dimensional transverse cross section of the 25 stochastically generated collateral models. Scale bar, 100 µm.
We derived the axon electrophysiological properties from the MRG model, which includes electrically active nodes of Ranvier with fast and persistent sodium conductances, a slow potassium conductance, and passive leak channels and membrane capacitance (McIntyre et al., 2002). We used a version of the MRG model that included small modifications to node dynamics that was developed in a previous study to produce more realistic axonal behavior (Mirzakhalili et al., 2020). The nodes were connected by electrically passive internodes which consist of a double-layer structure, incorporating both passively conducting axolemma and myelin sheath and a periaxonal current pathway in the submyelin space. We modeled the internodal regions using the same properties of the internodal region in the original MRG model (McIntyre et al., 2002). Finally, we reduced the persistent sodium conductance by 50%, because it is known that in small-diameter MRG axon models, the default persistent sodium can produce hyperexcitability, and previous work has shown that action potential following frequency in branched axon models is strongly robust to variations in this parameter (Grill et al., 2008).
The diameter of the primary collateral as it entered the dorsal horn was 3 µm, and at each branching point, the diameter of the child collaterals was 60% of that of the parent axon. Experimental measurements of afferents have shown first-order collaterals that are approximately one-third of the parent axon diameter (Iles, 1976; Ishizuka et al., 1979). Thus, we chose the 3 µm collateral diameter to correspond to the ∼8–11 µm DC fiber diameter range which has been implicated in therapeutic closed-loop SCS (J. L. Parker et al., 2012; Anaya et al., 2020). We restricted internodal lengths (i.e., distances between nodes of Ranvier) to be between 40 and 120 times the ratio of the internodal diameter (with a typical ratio of 100, in line with measurements from Ia fiber collaterals; Iles, 1976). Nodes were 1 µm long, and their diameters were 70% of their parent axons, in line with small-diameter MRG axon models (McIntyre et al., 2004; Miocinovic et al., 2006). We performed a sensitivity analysis to investigate the robustness of our results to variations in fast sodium conductance, internodal length, fiber diameter, nodal length, and the ratio of diameters between child and parent axons at branch points.
We introduced action potentials at specific frequencies by applying a high-amplitude, short–duration current injection at a proximal node. For this sensitivity analysis, we ran 500 ms of the simulation time, with a time step of 5 µs, and a temperature of 37°C. In this analysis, we also decreased the time step to 2 µs and approximately halved the spatial discretization to ensure that the results were robust to these factors.
Experimental design and statistical analysis
Modeling results are given in full and/or summarized using simple summary statistics, including the median and quartiles. We collected clinical paresthesia thresholds by applying stimulation of different frequencies in a random order and asking participants to self-report perception, comfort, and DTs (see above, Human paresthesia thresholds). We performed simple pairwise Wilcoxon signed-rank test to quantify differences in paresthesia thresholds across frequencies.
Code accessibility
The code to generate the DCN and collateral models will be made available on GitHub upon manuscript acceptance.
Results
PT was decreased at high frequencies
We asked 16 participants undergoing SCS as part of their clinical care, to report at what amplitude they first felt paresthesia (i.e., PT) using a fixed-pulse width of 200 µs at six frequencies between 2 and 1,000 Hz. For participants with implanted systems that could not produce 1,000 Hz stimulation at this pulse width (six subjects), we reduced the maximum stimulation frequency to 900 Hz. To simplify analysis, we combined results collected at 900 and 1,000 Hz based on their similar interpulse intervals (1 vs 1.1 ms) and similar thresholds between the two frequencies shown in a previous study (Abejón et al., 2016). Additionally, we also asked participants to self-report their CT and DT, respectively. For 2, 10, 50, 100, 500, and 1,000 Hz, median and interquartile range (IQR) for PTs were 2.10 (IQR, 1.6–3.25), 1.90 (IQR, 1.45–3.55), 1.90 (IQR, 1.50–3.40), 1.85 (IQR, 1.50–3.15), 1.50 (IQR, 1.30–2.85), and 1.60 (IQR, 1.15–2.70) mA, respectively. For these frequencies, median CTs were 3.65 (IQR, 2.10–5.55), 3.30 (IQR, 1.50–7.50), 2.95 (IQR, 1.75–4.75), 2.55 (IQR, 1.65–4.50), 2.30 (IQR, 1.40–3.80), and 2.25 (1.35–3.70) mA, while median DTs were 5.80 (IQR, 2.70–9.20), 5.60 (IQR, 2.70–9.00), 4.20 (IQR, 2.30–7.30), 3.15 (IQR, 2.10–5.20), 2.95 (IQR, 1.70–5.05), and 2.70 (1.50–4.60) mA, respectively. This decreasing pattern was maintained when analyzing within-participant differences (Table 3). Importantly, for all frequencies, perception was maintained throughout the duration of the stimulation.
Table 3.
Within-subject differences in paresthesia across frequencies
| f1 (Hz) | f2 (Hz) | Median: PT(f2)–PT(f1) (Q1, Q3) | p value | Median: CT(f2)–CT(f1) (Q1, Q3) | p value | Median DT(f2)–DT(f1) (Q1, Q3) | p value |
|---|---|---|---|---|---|---|---|
| 2 | 10 | −0.05 (−0.30, 0.0) | 0.098 | 0.0 (−0.70, 0.30) | 0.774 | 0.35 (−0.10, 1.30) | 0.405 |
| 50 | 0.0 (−0.40, 0.10) | 0.187 | −0.50 (−0.95, −0.10) | 0.002 | −0.90 (−3.30, 0.0) | 0.009 | |
| 100 | −0.2 (−0.45, 0.0) | 0.003 | −0.45 (−1.60, −0.25) | <0.001 | −1.30 (−4.30, −0.60) | <0.001 | |
| 500 | −0.45 (−0.60, −0.25) | <0.001 | −1.50 (−2.10, −0.55) | <0.001 | −2.0 (−4.40, −1.30) | <0.001 | |
| 1,000 | −0.50 (−0.65, −0.30) | <0.001 | −1.60 (−2.35, −0.70) | <0.001 | −2.15 (−4.30, −1.20) | <0.001 | |
| 10 | 50 | 0.0 (−0.15, 0.05) | 0.523 | 0.0 (−1.0, 0.20) | 0.274 | −0.85 (−2.60, −0.10) | 0.008 |
| 100 | −0.10 (−0.30, 0.0) | 0.050 | −0.20 (−1.50, 0.10) | 0.096 | −1.40 (−3.50, −0.50) | <0.001 | |
| 500 | −0.30 (−0.60, −0.20) | <0.001 | −0.40 (−2.10, −0.20) | <0.001 | −2.10 (−4.30, −0.80) | <0.001 | |
| 1,000 | −0.30 (−0.65, −0.15) | <0.001 | −0.50 (−3.10, −0.20) | <0.001 | −2.55 (−4.50, −0.90) | <0.001 | |
| 50 | 100 | −0.10 (−0.20, 0.0) | 0.278 | −0.30 (−0.45, −0.05) | 0.006 | −0.70 (−1.35, −0.20) | 0.003 |
| 500 | −0.35 (−0.50, −0.10) | <0.001 | −0.65 (−1.05, −0.40) | <0.001 | −1.15 (−1.70, −0.60) | <0.001 | |
| 1,000 | −0.20 (−0.55, −0.10) | <0.001 | −0.80 (−1.15, −0.40) | <0.001 | −1.0 (−1.90, −0.60) | <0.001 | |
| 100 | 500 | −0.20 (−0.55, −0.10) | <0.001 | −0.35 (−0.65, −0.15) | <0.001 | −0.40 (−0.90, −0.20) | 0.003 |
| 1,000 | −0.30 (−0.50, −0.10) | <0.001 | −0.45 (−0.70, −0.30) | <0.001 | −0.40 (−0.70, −0.30) | <0.001 | |
| 500 | 1,000 | −0.05 (−0.10, 0.10) | 0.714 | −0.10 (−0.15, 0.0) | 0.041 | −0.10 (−0.30, 0.10) | 0.078 |
Pairwise medians of within-participant differences. In parentheses below, the first (Q1) and third (Q3) quartiles are provided. A negative value indicates a lower value (i.e., decrease in the corresponding threshold) at the higher frequency (f2) relative to the lower frequency (f1). P values were calculated for the Wilcoxon signed-rank test, and p values <0.05 are bolded.
Comfort and DTs decreased at high frequencies
We determined CT and DT by asking participants to report when the stimulation amplitude was at the maximum level that they could run continuously and when it became acutely uncomfortable, respectively. In rare instances, participants maximized their stimulator output before reaching either CT or DT. This happened once for CT (at 10 Hz) and four times for DT (once at 2 Hz, twice at 10 Hz, once at 1,000 Hz). These individual data points were not included in the analysis but should be considered when interpreting our results.
Interestingly, we observed that 2 and 10 Hz had similar thresholds for both CT and DT (Table 3). Mean CT and DT consistently and appreciably decreased as frequency was further increased, and the median paired difference was negative for all frequencies higher than 10 Hz. For instance, compared with 2 Hz, the median within-participant differences in CT were −0.50, −0.45, −1.50, and −1.60 mA for 50, 100, 500, and 900/1,000 Hz stimulation. For DT, these median differences were −0.90, −1.30, −2.00, and −2.15 mA. Additionally, we considered the therapeutic window as CT–PT (J. Parker et al., 2020). The median therapeutic windows were 1.15, 0.90, 0.55, 0.50, 0.45, and 0.20 mA for 2, 10, 50, 100, 500, and 900/1,000 Hz SCS, once again showing a tendency to decrease at higher frequencies.
High-frequency SCS produced lower activation thresholds and asynchronous firing
We sought to understand the relationship between DC fiber activation properties and paresthesia perception and quality in SCS patients. To begin, we simulated the response of a single superficially located DC fiber in response to SCS at frequencies between 2 and 1,000 Hz (Fig. 4; black axon and raster plot). The fiber was 10 µm in diameter and located 100 µm ventral to the white matter boundary. First, we evaluated the activation threshold across frequencies by finding the stimulation amplitude necessary to generate at least one action potential. For this fiber, the activation threshold was equivalent across 2, 10, 50, and 100 Hz SCS (2.47 mA). At 500 and 1,000 Hz, the threshold decreased to 2.32 and 2.25 mA, respectively. This reduction in activation threshold appears to arise from active ionic properties and specifically related to the persistent sodium conductance within the MRG axon model. When considering an axon model with the persistent sodium conductance removed, we found almost identical thresholds at low and high frequencies (data not shown).
Figure 4.

A raster plot showing firing behavior for two identical axons separated by 200 µm. The black spikes represent the firing of the original axon, whereas the red spikes are those for a second axon, located 200 µm ventral to the first axon. The top row corresponds to 2.4 mA stimulation, which is increased in 0.2 mA increments to a maximum of 3.2 mA.
We observed that, despite having an equivalent 2.47 mA activation threshold, the axonal firing behavior varied subtly between 2, 10, 50, and 100 Hz stimulation as the amplitude was incrementally increased to slightly higher juxtathreshold stimulation amplitudes (Fig. 4). At 2 Hz, the subthreshold versus suprathreshold response was a sharp binary, and the axon immediately began firing in response to each SCS pulse as soon as the amplitude was above the axonal threshold. In contrast, all other frequencies produced slight changes in axonal behavior as the amplitude was incrementally increased. At juxtathreshold amplitudes, both 10 and 50 Hz SCS produced tonic axonal firing at a lower rate. During 10 Hz, just above-threshold stimulation (2.5 mA) produced a 5 Hz firing rate in the axon, which sharply converted to a tonic 10 Hz firing response at 2.7 mA. In contrast, 50 Hz SCS produced a graded increase in the axonal firing rate as the stimulation amplitude was increased. As we increased the amplitude from 2.5 to 2.8 mA in 0.1 mA increments, the firing rates were ∼7, 9, 11, and 13 Hz during 50 Hz SCS. We did not observe tonic 50 Hz firing until the stimulation amplitude was increased to 3.3 mA. Finally, 100 Hz SCS produced a distinct axonal response. Specifically, we observed that the axon fired in spike doublets (pairs of spikes separated by 10 ms) at juxtrathreshold stimulation. At 2.5 mA, these doublets occurred at ∼6 Hz. Increasing the amplitude to 2.6 and 2.7 mA slightly increased the frequency of these doublets to ∼8 and 9 Hz, respectively. Further increasing the amplitude converted these doublets into bursts, with higher amplitudes having more spikes in a burst (2.8, 2.9, and 3.0 mA SCS produced bursts with 3, 4, and 5 spikes, respectively), until the axon began firing tonically at 100 Hz at 3.1 mA.
As previously discussed, 500 and 1,000 Hz SCS had reduced thresholds compared with these lower frequencies (2.32 and 2.25 mA, respectively). We observed that these two frequencies produced qualitatively similar axonal firing behavior. At juxtathreshold amplitudes, SCS at both frequencies generated burst firing patterns. As the stimulation amplitude is increased, the number of spikes within a burst increased, while the time between bursts decreased. Eventually, the axon began tonically firing at a subharmonic frequency of the applied stimulus, and further amplitude increase eventually produced a maximum tonic firing frequency in the axon, with the upper firing rate limited by the axonal biophysics. In this model, the maximum axonal firing frequency was 500 Hz for both 500 and 1,000 Hz SCS.
Next, we expanded our model to explore the effects of spatial position on axonal firing behavior and fiber synchrony. We produced an identical 10-µm-diameter fiber located 200 µm ventral to the original fiber model. We found that this slight difference in dorsoventral position corresponded to a notably higher threshold and that the two fibers fired asynchronously at frequencies of at least 50 Hz (Fig. 4). The two fibers often responded to the same stimulus amplitude by firing in qualitatively different patterns. For instance, at high frequencies, it was common for the more superficial fiber to fire tonically, while the deeper axon produced bursts of action potentials. Importantly, these contrasting firing patterns are thought to have different effects and functions in the nervous system (Weyand et al., 2001).
Frequency-dependent activation thresholds closely predict clinical PTs
We hypothesized that reduced DC fiber activation thresholds at high frequencies (Fig. 4) provides the biophysical basis for reduced paresthesia PT at high frequencies. To test this hypothesis, we expanded our analysis to a population of DC fibers. To maximize clinical translatability, we used the positions and densities described by Anaya et al. (2020) in the 7.3–11.5-µm-diameter range, which were derived from the histology of the human DC (Feirabend et al., 2002). Overall, our model population included 346 total fibers. To investigate the effects of frequency on stimulation PT, we determined model PT as the amplitude necessary to activate 10% of DC fibers in our population model to fire at least one action potential, as this has shown to be an accurate estimator of PT in previous patient-specific studies (Howell et al., 2014; Lempka et al., 2020).
To account for interparticipant variation in baseline PT, for each participant, we normalized PT at the various frequencies by finding the ratio between their PT at each separate frequency and their individual PT for conventional 50 Hz SCS. For 2 and 10 Hz, the median ratio was exactly 1.0 (Fig. 5). In contrast, PT was typically lower at 100, 500, and 1,000 Hz, and the median ratios at these frequencies were 0.96, 0.88, and 0.88. Importantly, we found that the activation thresholds of DC fibers corresponded with clinical PT at the various tested frequencies. Specifically, we found that model PT was identical for 2, 10, and 50 Hz (4.65 mA) and then decreased to ∼98, 92, and 88% of this value at 100, 500, and 1,000 Hz, respectively, closely reflecting the pattern observed for clinical paresthesia PT (Fig. 5).
Figure 5.
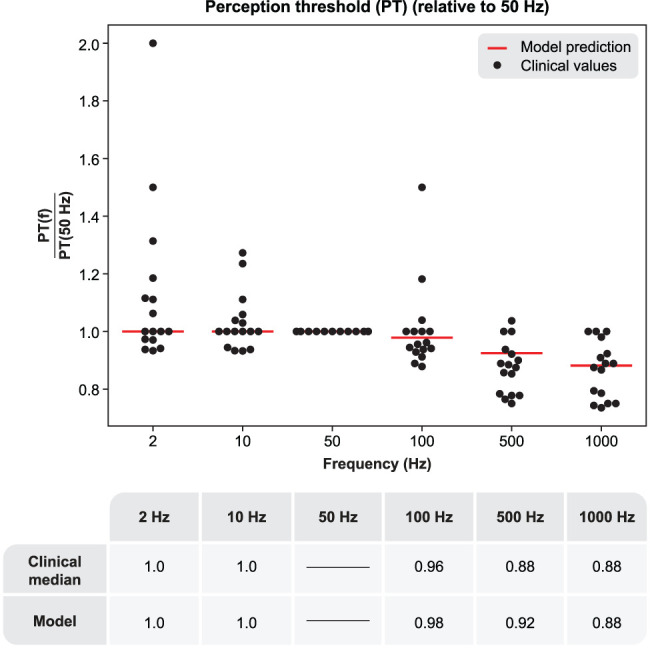
Top, A Scatterplot showing individual PTs for each participant. PTs are given as relative to the PT for conventional 50 Hz SCS for each participant to account for interparticipant variation in baseline thresholds and model activation thresholds. Red lines indicate the model PT when 10% of fibers fire at least one action potential. Bottom, Comparison of model PT predictions with clinical medians.
Finally, using the population of DC fibers, we expanded our previous analysis and found that population firing behavior was asynchronous at high frequencies at suprathreshold amplitudes. Raster plots of the frequency-specific firing behavior of DC fibers activated at model PT are shown in Figure 6.
Figure 6.

A raster plot showing firing behavior of activated DC axons at model PT. Note that the highest frequencies produce highly asynchronous and more rapid firing than lower frequencies. At frequencies from 10 to 100 Hz, the population firing rate is highly synchronized with the SCS pulses, but each individual fiber does not respond one-to-one with each pulse.
DCN neurons cannot respond faithfully to high-frequency SCS
Beyond the onset of paresthesia (i.e., PT), it is known that both the comfort and subjective quality of paresthesia is frequency dependent (Abejón et al., 2016). We thus developed and validated a DCN projection neuron (as well as the DC fiber-to-DCN synaptic connection) to investigate how the synaptic transmission properties affect SCS-induced paresthesia.
First, we examined synaptic fidelity as a function of frequency by applying spike trains to the synaptic model and monitoring the model DCN cell response (Fig. 7). The base synaptic transmission model demonstrated reliable action potential transmission at 2, 10, and 50 Hz, with 100% of presynaptic action potentials producing a postsynaptic spike in the DCN neuron. At 100 Hz, the postsynaptic neuron could no longer be driven in a one-to-one fashion by the incoming presynaptic spike train, and the postsynaptic firing rate was decreased to ∼70 Hz. Further increasing the presynaptic firing frequency marginally increased the postsynaptic firing rate, with 200, 300, 400, and 500 Hz presynaptic spike trains producing postsynaptic firing between ∼70 and 80 Hz (Fig. 7).
Figure 7.

DCN projection neuron firing rates for DC fiber input spike trains of varying frequencies. Note, data are given as the ratio between the number of output spikes to the number of input spikes at a given frequency. Color-coded lines correspond to different strengths of the synaptic connection.
Next, we ran simulations increasing the EPSP amplitude, modeling a stronger synaptic connection and/or coherent activation of additional afferent fibers. When the monosynaptic EPSP amplitude was doubled, the DCN neuron was able to reliably follow a 100 Hz presynaptic spike train. However, at 200, 300, 400, and 500 Hz, the DCN firing frequency plateaued at slightly higher than 100 Hz, which agrees with similar preclinical experimental recordings (Ferrington et al., 1987; Vickery et al., 1994; Gynther et al., 1995; Rowe, 2002; Turecek et al., 2022). Further increasing the synaptic strength showed similar patterns, suggesting that intrinsic electrophysiological properties place an upper limit of ∼100 Hz on the maximum reliable transmission frequency at this synapse.
DCN neurons fire faster and more asynchronously at high SCS frequencies
Beyond the response of a single DCN neuron, we sought to investigate how the population of DCN neurons responds to SCS as a function of frequency. To do this, we evaluated the effects of stimulation frequency in a population of 100 DCN neurons. Experimental evidence suggests that individual DCN neurons receive a broad input from many primary afferent fibers, which is dominated by a small number of strong synaptic connections (Bengtsson et al., 2013). Thus, in our analysis, each DCN neuron received synaptic input from all model DC fibers. We randomly chose 1–2 fibers to provide strong synaptic connections to each DCN neuron (2–6 mV), with the remaining fibers each providing a weak synaptic connection (randomly sampled from an exponential distribution with mean of 10 μV; Bengtsson et al., 2013). We evaluated the response during both 5.0 mA (an amplitude slightly above model PT) and 7.5 mA SCS (an amplitude producing robust activation of the model DC fibers).
Overall, we found that both the DCN population firing rate and temporal firing patterns were strongly dependent on frequency and amplitude. At 5.0 mA, we observed little synchrony in the model DCN population (Fig. 8). On the other hand, at 7.5 mA, low-frequency SCS at 2 and 10 Hz produced highly synchronized activity, with the neurons firing coherently in response to each SCS pulse. As frequency increased, DCN neurons became increasingly independent, and no observable synchrony was observable at 500 or 1,000 Hz (Fig. 8). We calculated the population firing rate by averaging the firing rates of each neuron during 0.5 s of SCS. For 5.0 mA, the population firing rates were 10.1, 10.7, 13.3, 15.5, 20.3, and 21.7 spikes/s for 2, 10, 50, 100, 500, and 1,000 Hz SCS, respectively. For 7.5 mA SCS, the population firing rates were 10.1, 10.4, 27.0, 42.1, 59.6, and 59.4 spikes/s.
Figure 8.

A raster plot of DCN neuron firing patterns (n = 100) during SCS at frequencies between 2 and 1,000 Hz, using a stimulation amplitude of 5.0 mA (left) and 7.5 mA (right). Each row corresponds to the firing pattern of an individual DCN neuron. Green lines indicate the SCS pulses at the various frequencies.
Dorsal horn output is sensitive to realistic variation in DC fiber firing patterns and branch point failure
In the dorsal horn, we hypothesized that pain signal transmission would be meaningfully sensitive to the variability in the firing responses across fibers exposed to the same electric field and stimulation patterns. Additionally, specifically for high-frequency SCS, we further hypothesized that frequency-dependent branch point failure within the terminal arbors of DC fiber collaterals would produce antinociceptive effects (by limiting firing rates and thereby reducing excitatory drive to the dorsal horn). Regarding the collaterals, we first evaluated the tendency for action potentials to fail using 25 collateral arbors with random geometries and observed their responses to stimulus trains up to 250 Hz (Fig. 9). We considered collateral models to demonstrate failure if at least one of their terminals failed to fire in response to at least 90% of input spikes at a given frequency. In these models, >90% of collaterals demonstrated faithful conduction fidelity up to 125 Hz. Branch point failure became increasingly common at higher frequencies, and increasing the input train frequency to 150, 175, 200, and 250 Hz decreased the proportion of models able to follow reliably to 84, 72, 52, and 36%, respectively (Fig. 9). To test the sensitivity of these results to biophysical and morphological factors, we performed sensitivity analysis on the frequency-following properties after reducing maximum nodal sodium channel conductance by 25% (i.e., from 3.0 to 2.25 S/cm2) as well as increasing and decreasing the diameter of the collaterals by 33% (Fig. 9). Branch point failure was greatly increased in the reduced sodium conductance model. For instance, at 100 Hz, only 52% of collaterals could faithfully transmit spikes in a one-to-one fashion, whereas this value was 96% of collaterals in the baseline model. Frequency-following was also sensitive to collateral diameter, albeit to a lesser extent. In this case, differences became most apparent at frequencies above 150 Hz, with smaller collaterals being more prone to branch point failure and larger diameter collaterals slightly less likely to fail (Fig. 9).
Figure 9.

Frequency-following properties within 25 DC fiber collateral models. Output data represent the percentage of collateral models that were able to respond faithfully to a given spike train frequency. A collateral was considered to respond faithfully if each of its terminal nodes of Ranvier generated a spike in response to at least 90% of input spikes. The left figure shows the results for the base model (orange) as well as the model with a 25% decrease in fast sodium conductance at all nodes of Ranvier (decrease from 3.0 to 2.25 S/cm2). The right figure shows the results for the base model (orange) compared with those for a model in which the collateral diameters were either increased by 33% (red) or decreased by 33% (blue).
Failing axons displayed heterogeneous responses to action potential trains. Axons often fired at a subharmonic frequency of the input spike train. However, more complex patterns were also observed, such as bursting patterns produced by failing at fixed patterns within the input train (e.g., the orange trace failing every third spike in Fig. 10). Interestingly, we observed that different branches within the axonal arbor could fire at different frequencies and patterns in response to the same input stimulus (Fig. 10). This was common in axons exhibiting branch point failure.
Figure 10.

Different firing patterns within an individual collateral model. This figure shows the response of one model collateral (using baseline model parameters) to a 250 Hz input spike train. The voltage traces at the bottom correspond to the time-dependent membrane voltage of the matching-color terminal nodes marked in the illustration of the collateral at the top.
Next, we tested our hypotheses regarding the effects of spike patterns on the dorsal horn output using an experimentally validated circuit model to investigate the effects of stimulus frequency on the output of the dorsal horn pain-processing network, which was originally developed and validated by Zhang et al. (2014; Fig. 11A). To do this, we modeled realistic DC fiber firing patterns at model CT, as this would correspond to a stimulation amplitude that patients would utilize clinically and because the dorsal horn network model presupposes robust activation of DC fibers. We calculated CT by scaling the model PT by the average ratio of CT to PT observed in the human participants at each individual frequency. These scaling factors were 1.56, 1.56, 1.41, 1.29, 1.24, and 1.22 for 2, 10, 50, 100, 500, and 1,000 Hz, respectively. We ran 50 simulations, each time randomly selecting 15 local Aβ-fibers from the population of DC fibers that were activated by the stimulation (out of the 346 total fibers in the population) and 15 surround-field Aβ–fibers from the overall population of DC fibers. The network output was the firing rate in the network transmission (“T”) neuron, which is a proxy for pain (Simone et al., 1991; Zhang et al., 2014; Fig. 11A). First, we analyzed the network response without considering the filtering properties of collaterals. Like Zhang et al. (2014), we found that network output varied with frequency, with low frequencies (2 and 10 Hz) producing small decreases in the network output, but 50 and 100 Hz SCS (i.e., the standard clinical range) strongly reducing painful transmission. However, unlike Zhang, we found that high frequencies (>100 Hz) also effectively reduced the network output, likely due to incorporating realistic firing patterns that were observed in our population of DC model fibers (as opposed to applying action potentials assumed to be generated in response to each SCS pulse). Median network output firing rates were 59.8, 26.0, 3.6, 0.2, 105.2, and 17.5 spikes/s for 2, 10, 50, 100, 500, and 1,000 Hz SCS, respectively (Fig. 11B). In comparison, the baseline output with no network input was 68 spikes/s (Zhang et al., 2014). Importantly, we found that applying randomly sampled DC fiber firing patterns led to variability in the network output in which different simulations could produce drastically different network output firing rates (most evident at 50, 500, and 1,000 Hz; Fig. 11B). These fluctuations in the network output due to variability in the DC fiber response at conventional 50 Hz stimulation could contribute to the heterogeneous pain relief in SCS patients observed clinically.
Figure 11.

The dorsal horn network response is highly sensitive to DC fiber spike timing, and high-frequency conduction failure within primary afferent terminal fibers produces antinociceptive effects. A, The network architecture and biophysics were identical to that developed by Zhang et al. (2014). The network model output was the firing rate of the transmission neuron. B, Left, Dorsal horn network model output during SCS at frequencies between 2 and 1,000 Hz using spiking patterns sampled from DC fibers. In this model, all action potentials initiated in the DC fibers were faithfully transmitted into the dorsal horn pain network (i.e., “perfect fidelity”). Right, Dorsal horn network model output when randomly sampling from collateral terminal models (using DC spiking patterns as input), allowing realistic conduction failure. IN, inhibitory interneuron; EX, excitatory interneuron; T, transmission (output) neuron.
Finally, we tested the sensitivity of pain processing in the dorsal horn to conduction failure in DC fiber collaterals. We found that the network response at the highest frequencies (500 and 1,000 Hz) was highly sensitive to imperfect spike train fidelity that resulted in reduced pain transmission (Fig. 11B). At 500 Hz, the inclusion of collateral failure reduced the median network output from 105.2 to 0.91 spikes/s. For 1,000 Hz stimulation, the median spiking rate decreased from 17.5 to 0.45 spikes/s after accounting for branch point failure in the DC fiber collaterals.
Discussion
The neural response to SCS is unclear, begetting inadequate clinical outcomes. In this study, we paired clinical paresthesia thresholds with biophysical modeling to analyze the neurophysiological effects of SCS, particularly the role of stimulation frequency. Our in silico analyses suggest potential underlying mechanisms for clinical SCS observations and motivate future confirmatory experimental studies.
Biophysics of SCS-induced paresthesia
How high-frequency SCS alleviates pain without paresthesia is actively debated. Recently, Sagalajev et al. (2023) proposed that synchronous DC fiber responses are necessary for SCS-induced paresthesia and that high-frequency SCS produces asynchronous spiking that reduces pain while remaining imperceptible. While our modeling confirms that high-frequency SCS produces asynchronous firing (Figs. 4, 6), we found that high-frequency SCS reliably has lower PTs than low-frequency stimulation (Fig. 5; Table 3), counterintuitively suggesting that high-frequency stimulation is easier to detect. Crucially, we utilized a 200 µs pulse width, while Sagalajev primarily used 40 µs pulses (Sagalajev et al., 2023). Since pulse width affects frequency-dependent activation properties, direct comparison using shorter-pulse widths is necessary. In one test, we compared model activation thresholds for a single axon with 50 versus 1,000 Hz stimulation using 50 µs pulses. In this case, threshold at 50 Hz was ∼4% lower than at 1,000 Hz, whereas we observed ∼9% difference for 200 µs pulses. However, given fiber diameter-dependent strength–duration curves (D. Lee et al., 2011), different pulse widths could activate different fiber subpopulations, and synchrony may be important under specific circumstances. Further work investigating how pulse width and frequency interact can resolve these considerations.
We note that while our DCN model included frequency-dependent synaptic depression, it did not include feedforward postsynaptic inhibition or possible branch point failure within the DCN. Sagalajev et al. (2023) proposed that high-frequency stimulation can lead to significant DC fiber activation without being perceived because high-frequency stimulation produces asynchronous activation (in agreement with our study) that is more readily blocked by the corresponding asynchronous and continuous feedforward inhibition. Another potentially important concept is conduction failure in primary afferent terminals within the DCN, which a previous study observed beginning at 400 Hz spiking (Coleman et al., 2003). Importantly, their results did not suggest complete axonal block but rather skipped spikes at the highest frequencies (similar to our results in Fig. 10). Future work including feedforward inhibition and branch point failure will allow a more complete investigation of precise spike timing on DCN processing. In addition to PT, frequency affects qualitative paresthesia characteristics. Gmel et al. (2021) found that high-frequency SCS produced stronger intensity paresthesia (increasing logarithmically). One reasonable explanation is that high-frequency stimulation produces a faster neural spiking rate. However, our DCN synaptic model demonstrated an upper firing limit (∼100 Hz) within the clinical frequency range. Therefore, for an individual neuron, stimulation at higher frequencies will not lead to faster supraspinal signaling beyond a certain point and could even reduce overall spiking as the synapse is functionally silenced. However, given that DC fibers synapse on numerous DCN neurons, we suggest that the DCN population response can better explain this relationship. In our DCN population model, we found that the population firing rate increased with frequency, with diminishing increases before eventually plateauing beyond 500 Hz, providing excellent agreement with the psychophysical data from Gmel et al. (2021).
Additionally, patients report qualitatively different sensations across frequencies. Using peripheral nerve stimulation, Graczyk et al. (2022) found that participants could perceive frequency increases up to ∼50 Hz and used different descriptors to characterize low-frequency (<50 Hz) stimulation (e.g., tapping, pulsing, tingling) and high-frequency stimulation (e.g., tingling, buzzing, electrical, vibrating). Anecdotally, these qualitative descriptors are largely consistent with what participants reported in this study. In our DCN analysis, we found that the DCN population response was highly synchronized with the pulses up to 50 Hz, whereas high frequencies produced incoherent population-level responses (Fig. 8). These differences in firing patterns and synchronicity between the stimulus and the corresponding DCN response offer potential biophysical explanations for the qualitatively different sensations elicited at low and high frequencies.
Biophysics of frequency-dependent pain relief
Conventional SCS frequency is nominally 50 Hz (Caylor et al., 2019), but there is little scientific understanding why some frequencies are more effective than others and why patients experience heterogeneous pain relief. One potential explanation is sensitivity of the dorsal horn pain processing network to variability in the firing patterns of DC fibers. For instance, at conventional 50 Hz, the model dorsal horn output varied between 0.10 and 46.2 spikes/s (Fig. 11B), with the only difference between model iterations being random sampling of which DC fibers drove the network. Thus, interpatient variability in the precise DC fiber activation profile and spiking patterns could contribute to heterogeneous clinical outcomes. While this variability was clearly observed in our model, human participants are likely to exhibit patient-specific differences that exacerbate spike pattern variability, such as fiber diameters and positions relative to the stimulating electrode. Thus, different patients will have distinct DC firing patterns, resulting in varying amounts of pain relief.
High-frequency SCS (500 and 1,000 Hz) clearly exhibited the most variability across network simulations (Fig. 11B), and responses ranged from ∼0 spikes/s to well above 100 spikes/s (suggesting increased pain). At face value, these findings suggest that high-frequency options produce analgesia via methods beyond Aβ-mediated gate control. In their original publication, Zhang et al. (2014) introduced spike trains manually into the dorsal horn network model and found increased output (i.e., more pain) at high frequencies (>100 Hz), which they attributed to rapid Aβ-fiber drive outweighing maximal inhibition at these elevated frequencies. However, although SCS participants consistently found 500 and 1,000 Hz stimulation uncomfortable, they did not report increased pain, demonstrating incongruence between the original model and experimental observation. Importantly, including biophysically realistic conduction failure in our DC models reduced Aβ-fiber maximal firing rates and notably reduced dorsal horn network output during 500 and 1,000 Hz SCS, producing comparable pain relief to 50 and 100 Hz SCS (Fig. 11B). This is crucial given the recent hypothesis that high-frequency SCS acts via DC fiber activation (Sagalajev et al., 2023), as previous modeling implied gate control was implausible at high frequencies (Zhang et al., 2014). We show that incorporating collateral failure produces more effective pain relief at high frequencies, offering a biophysical explanation for this incongruence and supporting the validity of this approach.
Limitations and future directions
Our results help elucidate the neural effects of SCS, yet several study limitations warrant further consideration. Our models utilized a canonical approach based on average measurements. However, a patient-specific approach would better capture differences between participants that could account for variations in PT, CT, and DT. Exciting work is currently being done investigating the utility of patient-specific models in understanding paresthesia thresholds as well as clinical characteristics in SCS patients (Lempka et al., 2020; Solanes et al., 2021).
Additionally, our frequency-dependent dorsal horn analysis used CT-amplitude stimulation, whereas kilohertz-frequency SCS is typically subparesthetic. We chose this approach because the previously validated model by Zhang et al. (2014) presupposes robust input to the central (painful) dermatome. This approach allowed for a direct comparison to previous work and allowed us to directly consider the mechanism explaining why subjects do not consistently report that suprathreshold high-frequency SCS increases their pain. With that said, even at subparesthetic amplitudes, fibers respond to 1 kHz SCS robustly with rapid firing (Fig. 4; Sagalajev et al., 2023). Thus, DC fiber collaterals would still experience branch point failure at these lower amplitudes, reducing drive to the dorsal horn network in line with our hypothesis. While development and validation of a DH network model including amplitude titration are beyond the scope of this study, future work should directly test how sensitive high-frequency SCS is to stimulation amplitude.
Finally, as described above, our study does not consider feedforward inhibition within the DCN that may play an important role with regard to the perception of SCS-induced activation. Future work should further consider supraspinal processing of the neural response to SCS and how it relates to perception and analgesia. This work will also help resolve potential discrepancies between studies regarding whether the PT is increased (Sagalajev et al., 2023) or decreased (Abejón et al., 2016) at higher stimulation frequencies and why paresthesia-free analgesia is not exclusive to high frequencies (Paz-Solís et al., 2022).
Conclusions
Through computational modeling and self-reported paresthesia thresholds, we demonstrated an association between fiber activation thresholds and PT and that high-frequency SCS produces asynchronous DCN firing (while low-frequency stimulation produces synchronization), likely contributing to differences in paresthesia quality at these different frequencies. Finally, in the dorsal horn, we found that pain processing is highly sensitive to inherent variability in the SCS-induced fiber response and that branch point failure within DC fiber collaterals reduce pain transmission during high-frequency stimulation, offering a potential explanation for the poorly understood mechanisms underlying these high-frequency stimulation paradigms. Altogether, these results suggest biophysical bases for pivotal clinical characteristics relating to paresthesia and pain relief at both conventional and higher stimulation frequencies.
References
- Abejón D, Rueda P, Vallejo R (2016) Threshold evolution as an analysis of the different pulse frequencies in rechargeable systems for spinal cord stimulation. Neuromodulation 19:276–282. 10.1111/ner.12401 [DOI] [PubMed] [Google Scholar]
- Abraira VE, Ginty DD (2013) The sensory neurons of touch. Neuron 79:618–639. 10.1016/j.neuron.2013.07.051 [DOI] [PMC free article] [PubMed] [Google Scholar]
- Anaya CJ, Zander HJ, Graham RD, Sankarasubramanian V, Lempka SF (2020) Evoked potentials recorded from the spinal cord during neurostimulation for pain: a computational modeling study. Neuromodulation 23:64–73. 10.1111/ner.12965 [DOI] [PMC free article] [PubMed] [Google Scholar]
- Bengtsson F, Brasselet R, Johansson RS, Arleo A, Jörntell H (2013) Integration of sensory quanta in cuneate nucleus neurons in vivo. PLoS One 8:e56630. 10.1371/journal.pone.0056630 [DOI] [PMC free article] [PubMed] [Google Scholar]
- Brown AG (1981) Organization in the spinal cord: the anatomy and physiology of identified neurones. Berlin: Springer-Verlag. [Google Scholar]
- Brown AG, Fyffe REW, Noble R (1980) Projections from Pacinian corpuscles and rapidly adapting mechanoreceptors of glabrous skin to the cat’s spinal cord. J Physiol 307:385–400. 10.1113/jphysiol.1980.sp013441 [DOI] [PMC free article] [PubMed] [Google Scholar]
- Brown AG, Fyffe REW, Rose PK, Snow PJ (1981) Morphology and organization from axons of type II slowly adapting units in the cat. J Physiol 316:469–480. 10.1113/jphysiol.1981.sp013801 [DOI] [PMC free article] [PubMed] [Google Scholar]
- Brown AG, Rose PK, Snow PJ (1978) Morphology and organization of axon collaterals from afferent fibres of slowly adapting type I units in cat spinal cord. J Physiol 277:15–27. 10.1113/jphysiol.1978.sp012257 [DOI] [PMC free article] [PubMed] [Google Scholar]
- Caylor J, et al. (2019) Spinal cord stimulation in chronic pain: evidence and theory for mechanisms of action. Bioelectron Med 5:12. 10.1186/s42234-019-0023-1 [DOI] [PMC free article] [PubMed] [Google Scholar]
- Coleman GT, Mahns DA, Zhang HQ, Rowe MJ (2003) Impulse propagation over tactile and kinaesthetic sensory axons to central target neurones of the cuneate nucleus in cat. J Physiol 550:553–562. 10.1113/jphysiol.2002.037002 [DOI] [PMC free article] [PubMed] [Google Scholar]
- De Groote S, De Jaeger M, Van Schuerbeek P, Sunaert S, Peeters R, Loeckx D, Goudman L, Forget P, De Smedt A, Moens M (2018) Functional magnetic resonance imaging: cerebral function alterations in subthreshold and suprathreshold spinal cord stimulation. J Pain Res 11:2517–2526. 10.2147/JPR.S160890 [DOI] [PMC free article] [PubMed] [Google Scholar]
- de Ridder D, Vanneste S, Plazier M, van der Loo E, Menovsky T (2010) Burst spinal cord stimulation: toward paresthesia-free pain suppression. Neurosurgery 66:986–990. 10.1227/01.NEU.0000368153.44883.B3 [DOI] [PubMed] [Google Scholar]
- Farokhniaee AA, McIntyre CC (2019) Theoretical principles of deep brain stimulation induced synaptic suppression. Brain Stimul 12:1402–1409. 10.1016/j.brs.2019.07.005 [DOI] [PMC free article] [PubMed] [Google Scholar]
- Feirabend HKP, Choufoer H, Ploeger S, Holsheimer J, Van Gool JD (2002) Morphometry of human superficial dorsal and dorsolateral column fibres: significance to spinal cord stimulation. Brain 125:1137–1149. 10.1093/brain/awf111 [DOI] [PubMed] [Google Scholar]
- Ferrington DG, Rowe MJ, Tarvin RP (1987) Actions of single sensory fibres on cat dorsal column nuclei neurones: vibratory signalling in a one-to-one linkage. J Physiol 386:293–309. 10.1113/jphysiol.1987.sp016535 [DOI] [PMC free article] [PubMed] [Google Scholar]
- Gilbert JE, Titus N, Zhang T, Esteller R, Grill WM (2022) Surround inhibition mediates pain relief by low amplitude spinal cord stimulation: modeling and measurement. eNeuro 9:ENEURO.0058-22.2022. 10.1523/ENEURO.0058-22.2022 [DOI] [PMC free article] [PubMed] [Google Scholar]
- Gmel GE, Santos Escapa R, Parker JL, Mugan D, Al-Kaisy A, Palmisani S (2021) The effect of spinal cord stimulation frequency on the neural response and perceived sensation in patients with chronic pain. Front Neurosci 15:625835. 10.3389/fnins.2021.625835 [DOI] [PMC free article] [PubMed] [Google Scholar]
- Gorman PH, Mortimer JT (1983) The effect of stimulus parameters on the recruitment characteristics of direct nerve stimulation. IEEE Trans Biomed Eng 30:407–414. 10.1109/TBME.1983.325041 [DOI] [PubMed] [Google Scholar]
- Graczyk EL, Christie BP, He Q, Tyler DJ, Bensmaia SJ (2022) Frequency shapes the quality of tactile percepts evoked through electrical stimulation of the nerves. J Neurosci 42:2052–2064. 10.1523/JNEUROSCI.1494-21.2021 [DOI] [PMC free article] [PubMed] [Google Scholar]
- Grill WM, Cantrell MB, Robertson MS (2008) Antidromic propagation of action potentials in branched axons: implications for the mechanisms of action of deep brain stimulation. J Comput Neurosci 24:81–93. 10.1007/s10827-007-0043-9 [DOI] [PubMed] [Google Scholar]
- Gynther BD, Vickery RM, Rowe MJ (1995) Transmission characteristics for the 1:1 linkage between slowly adapting type II fibers and their cuneate target neurons in cat. Exp Brain Res 105:67–75. 10.1007/BF00242183 [DOI] [PubMed] [Google Scholar]
- Hari K, et al. (2022) GABA facilitates spike propagation through branch points of sensory axons in the spinal cord. Nat Neurosci 25:1288–1299. 10.1038/s41593-022-01162-x [DOI] [PMC free article] [PubMed] [Google Scholar]
- Hines ML, Carnevale NT (1997) The NEURON simulation environment. Neural Comput 9:1179–1209. 10.1162/neco.1997.9.6.1179 [DOI] [PubMed] [Google Scholar]
- Howell B, Lad SP, Grill WM (2014) Evaluation of intradural stimulation efficiency and selectivity in a computational model of spinal cord stimulation. PLoS One 9:e114938. 10.1371/journal.pone.0144107 [DOI] [PMC free article] [PubMed] [Google Scholar]
- Iles JF (1976) Central terminations of muscle afferents on motoneurones in the cat spinal cord. J Physiol 262:91–117. 10.1113/jphysiol.1976.sp011587 [DOI] [PMC free article] [PubMed] [Google Scholar]
- Ishizuka N, Mannen H, Hongo T, Sasaki S (1979) Trajectory of group Ia afferent fibers stained with horseradish peroxidase in the lumbosacral spinal cord of the cat: three dimensional reconstructions from serial sections. J Comp Neurol 186:189–211. 10.1002/cne.901860206 [DOI] [PubMed] [Google Scholar]
- Johnson MD, McIntyre CC (2008) Quantifying the neural elements activated and inhibited by globus pallidus deep brain stimulation. J Neurophysiol 100:2549–2563. 10.1152/jn.90372.2008 [DOI] [PMC free article] [PubMed] [Google Scholar]
- Jones MG, Rogers ER, Harris JP, Sullivan A, Ackermann DM, Russo M, Lempka SF, McMahon SB (2021) Neuromodulation using ultra low frequency current waveform reversibly blocks axonal conduction and chronic pain. Sci Transl Med 13:eabg9890. 10.1126/scitranslmed.abg9890 [DOI] [PubMed] [Google Scholar]
- Lee KY, Bae C, Lee D, Kagan Z, Bradley K, Chung JM, La JH (2020) Low-intensity, kilohertz frequency spinal cord stimulation differently affects excitatory and inhibitory neurons in the rodent superficial dorsal horn. Neuroscience 428:132–139. 10.1016/j.neuroscience.2019.12.031 [DOI] [PubMed] [Google Scholar]
- Lee D, Hershey B, Bradley K, Yearwood T (2011) Predicted effects of pulse width programming in spinal cord stimulation: a mathematical modeling study. Med Biol Eng Comput 49:765–774. 10.1007/s11517-011-0780-9 [DOI] [PMC free article] [PubMed] [Google Scholar]
- Lempka SF, Patil PG (2018) Innovations in spinal cord stimulation for pain. Curr Opin Biomed Eng 8:51–60. 10.1016/j.cobme.2018.10.005 [DOI] [PMC free article] [PubMed] [Google Scholar]
- Lempka SF, Zander HJ, Anaya CJ, Wyant A, Ozinga JG, Machado AG (2020) Patient-specific analysis of neural activation during spinal cord stimulation for pain. Neuromodulation 23:572–581. 10.1111/ner.13037 [DOI] [PubMed] [Google Scholar]
- Liang L, Damiani A, Del Brocco M, Rogers ER, Jantz MK, Fisher LE, Gaunt RA, Capogrosso M, Lempka SF, Pirondini E (2022) A systematic review of computational models for the design of spinal cord stimulation therapies: from neural circuits to patient-specific simulations. J Physiol 601:3103–3121. 10.1113/JP282884 [DOI] [PMC free article] [PubMed] [Google Scholar]
- McIntyre CC, Grill WM, Sherman DL, Thakor NV (2004) Cellular effects of deep brain stimulation: model-based analysis of activation and inhibition. J Neurophysiol 91:1457–1469. 10.1152/jn.00989.2003 [DOI] [PubMed] [Google Scholar]
- McIntyre CC, Richardson AG, Grill WM (2002) Modeling the excitability of mammalian nerve fibers: influence of afterpotentials on the recovery cycle. J Neurophysiol 87:995–1006. 10.1152/jn.00353.2001 [DOI] [PubMed] [Google Scholar]
- Melzack R, Wall P (1965) Pain mechanisms: a new theory A. Science 150:971–979. 10.1126/science.150.3699.971 [DOI] [PubMed] [Google Scholar]
- Metzger CS, Hammond MB, Paz-Solis JF, Newton WJ, Thomson SJ, Pei Y, Jain R, Moffitt M, Annecchino L, Doan Q (2021) A novel fast-acting sub-perception spinal cord stimulation therapy enables rapid onset of analgesia in patients with chronic pain. Expert Rev Med Devices 18:299–306. 10.1080/17434440.2021.1890580 [DOI] [PubMed] [Google Scholar]
- Miller JP, Eldabe S, Buchser E, Johanek LM, Guan Y, Linderoth B (2016) Parameters of spinal cord stimulation and their role in electrical charge delivery: a review. Neuromodulation 19:373–384. 10.1111/ner.12438 [DOI] [PubMed] [Google Scholar]
- Miocinovic S, Parent M, Butson CR, Hahn PJ, Russo GS, Vitek JL, McIntyre CC (2006) Computational analysis of subthalamic nucleus and lenticular fasciculus activation during therapeutic deep brain stimulation. J Neurophysiol 96:1569–1580. 10.1152/jn.00305.2006 [DOI] [PubMed] [Google Scholar]
- Mirzakhalili E, Barra B, Capogrosso M, Lempka SF (2020) Biophysics of temporal interference stimulation. Cell Syst 11:557–572.e5. 10.1016/j.cels.2020.10.004 [DOI] [PubMed] [Google Scholar]
- Mirzakhalili E, Rogers ER, Lempka SF (2023) An optimization framework for targeted spinal cord stimulation. J Neural Eng 20:056026. 10.1088/1741-2552/acf522 [DOI] [PMC free article] [PubMed] [Google Scholar]
- Niu J, et al. (2013) Modality-based organization of ascending somatosensory axons in the direct dorsal column pathway. J Neurosci 33:17691–17709. 10.1523/JNEUROSCI.3429-13.2013 [DOI] [PMC free article] [PubMed] [Google Scholar]
- North RB, Ewend MG, Lawton MT, Piantadosi S (1991) Spinal cord stimulation for chronic, intractable pain: superiority of ‘multi-channel’ devices. Pain 44:119–130. 10.1016/0304-3959(91)90125-H [DOI] [PubMed] [Google Scholar]
- North RB, Kidd DH, Zahurak M, James CS, Long DM (1993) Spinal cord stimulation for chronic, intractable pain: experience over two decades. Neurosurgery 32:384–395. 10.1227/00006123-199303000-00008 [DOI] [PubMed] [Google Scholar]
- Nuñez A, Buño W (1999) In vitro electrophysiological properties of rat dorsal column nuclei neurons. Eur J Neurosci 11:1865–1876. 10.1046/j.1460-9568.1999.00605.x [DOI] [PubMed] [Google Scholar]
- Parker J, Karantonis D, Single P (2020) Hypothesis for the mechanism of action of ECAP-controlled closed-loop systems for spinal cord stimulation. Healthc Technol Lett 7:76–80. 10.1049/htl.2019.0110 [DOI] [PMC free article] [PubMed] [Google Scholar]
- Parker JL, Karantonis DM, Single PS, Obradovic M, Cousins MJ (2012) Compound action potentials recorded in the human spinal cord during neurostimulation for pain relief. Pain 153:593–601. 10.1016/j.pain.2011.11.023 [DOI] [PubMed] [Google Scholar]
- Paz-Solís J, Thomson S, Jain R, Chen L, Huertas I, Doan Q (2022) Exploration of high- and low-frequency options for subperception spinal cord stimulation using neural dosing parameter relationships: the HALO study. Neuromodulation 25:94–102. 10.1111/ner.13390 [DOI] [PubMed] [Google Scholar]
- Rogers ER, Mirzakhalili E, Lempka SF (2023) Model-based analysis of subthreshold mechanisms of spinal cord stimulation for pain. J Neural Eng 20:066003. 10.1088/1741-2552/ad0858 [DOI] [PMC free article] [PubMed] [Google Scholar]
- Rogers ER, Zander HJ, Lempka SF (2022) Neural recruitment during conventional, burst, and 10-kHz spinal cord stimulation for pain. J Pain 23:434–449. 10.1016/j.jpain.2021.09.005 [DOI] [PMC free article] [PubMed] [Google Scholar]
- Rowe MJ (2002) Synaptic transmission between single tactile and kinaesthetic sensory nerve fibers and their central target neurones. Behav Brain Res 135:197–212. 10.1016/S0166-4328(02)00166-3 [DOI] [PubMed] [Google Scholar]
- Sagalajev B, Zhang T, Abdollahi N, Yousefpour N, Medlock L, Al-Basha D, Ribeiro-da-Silva A, Esteller R, Ratté S, Prescott SA (2023) Absence of paresthesia during high-rate spinal cord stimulation reveals importance of synchrony for sensations evoked by electrical stimulation. Neuron 112:404–420. 10.1016/j.neuron.2023.10.021 [DOI] [PubMed] [Google Scholar]
- Sato KL, King EW, Johanek LM, Sluka KA (2013) Spinal cord stimulation reduces hypersensitivity through activation of opioid receptors in a frequency-dependent manner. Eur J Pain 17:551–561. 10.1002/j.1532-2149.2012.00220.x [DOI] [PubMed] [Google Scholar]
- Simone DA, Sorkin LS, Oh U, Chung JM, Owens C, Lamotte RH, Willis WD (1991) Neurogenic hyperalgesia: central neural correlates in responses of spinothalamic tract neurons. J Neurophysiol 66:228–246. 10.1152/jn.1991.66.1.228 [DOI] [PubMed] [Google Scholar]
- Solanes C, Durá JL, Angeles Canós M, De Andrés J, Martí-Bonmatí L, Saiz J (2021) 3D patient-specific spinal cord computational model for SCS management: potential clinical applications. J Neural Eng 18:036017. 10.1088/1741-2552/abe44f [DOI] [PubMed] [Google Scholar]
- Thomson AM (2000) Molecular frequency filters at central synapses. Prog Neurobiol 62:159–196. 10.1016/S0301-0082(00)00008-3 [DOI] [PubMed] [Google Scholar]
- Tiede J, Brown L, Gekht G, Vallejo R, Yearwood T, Morgan D (2013) Novel spinal cord stimulation parameters in patients with predominant back pain. Neuromodulation 16:370–375. 10.1111/ner.12032 [DOI] [PubMed] [Google Scholar]
- Titus ND, Gilbert JE, Grill WM (2020) Biophysics and mechanisms of spinal cord stimulation for chronic pain. In: Handbook of neuroengineering (Thakor NV, ed), pp 1–45. Singapore: Springer. [Google Scholar]
- Tsodyks MV, Markram H (1997) The neural code between neocortical pyramidal neurons depends on neurotransmitter release probability. Proc Natl Acad Sci U S A 94:719–723. 10.1073/pnas.94.2.719 [DOI] [PMC free article] [PubMed] [Google Scholar]
- Turecek J, Lehnert BP, Ginty DD (2022) The encoding of touch by somatotopically aligned dorsal column subdivisions. Nature 612:310–315 10.1038/s41586-022-05470-x [DOI] [PMC free article] [PubMed] [Google Scholar]
- van den Honert C, Mortimer JT (1979) The response of the myelinated nerve fiber to short duration biphasic stimulating currents. Ann Biomed Eng 7:117–125. 10.1007/BF02363130 [DOI] [PubMed] [Google Scholar]
- Vickery RM, Gynther BD, Rowe MJ (1994) Synaptic transmission between single slowly adapting type I fibres and their cuneate target neurones in cat. J Physiol 474:379–392. 10.1113/jphysiol.1994.sp020030 [DOI] [PMC free article] [PubMed] [Google Scholar]
- Weyand TG, Boudreaux M, Guido W (2001) Burst and tonic response modes in thalamic neurons during sleep and wakefulness. J Neurophysiol 85:1107–1118. 10.1152/jn.2001.85.3.1107 [DOI] [PubMed] [Google Scholar]
- Zander HJ, Graham RD, Anaya CJ, Lempka SF (2020) Anatomical and technical factors affecting the neural response to epidural spinal cord stimulation. J Neural Eng 17:036019. 10.1088/1741-2552/ab8fc4 [DOI] [PMC free article] [PubMed] [Google Scholar]
- Zhang TC, Janik JJ, Grill WM (2014) Modeling effects of spinal cord stimulation on wide-dynamic range dorsal horn neurons: influence of stimulation frequency and GABAergic inhibition. J Neurophysiol 112:552–567. 10.1152/jn.00254.2014 [DOI] [PubMed] [Google Scholar]