Abstract
Computational methods in biology can infer large molecular interaction networks from multiple data sources and at different resolutions, creating unprecedented opportunities to explore the mechanisms driving complex biological phenomena. Networks can be built to represent distinct conditions and compared to uncover graph-level differences—such as when comparing patterns of gene-gene interactions that change between biological states. Given the importance of the graph comparison problem, there is a clear and growing need for robust and scalable methods that can identify meaningful differences. We introduce node2vec2rank (n2v2r), a method for graph differential analysis that ranks nodes according to the disparities of their representations in joint latent embedding spaces. Improving upon previous bag-of-features approaches, we take advantage of recent advances in machine learning and statistics to compare graphs in higher-order structures and in a data-driven manner. Formulated as a multi-layer spectral embedding algorithm, n2v2r is computationally efficient, incorporates stability as a key feature, and can provably identify the correct ranking of differences between graphs in an overall procedure that adheres to veridical data science principles. By better adapting to the data, node2vec2rank clearly outperformed the commonly used node degree in finding complex differences in simulated data. In the real-world applications of breast cancer subtype characterization, analysis of cell cycle in single-cell data, and searching for sex differences in lung adenocarcinoma, node2vec2rank found meaningful biological differences enabling the hypothesis generation for therapeutic candidates. Software and analysis pipelines implementing n2v2r and used for the analyses presented here are publicly available.
2. Introduction
Advances in sequencing technologies and computational biology now enable graph representations for a multitude of molecular interactions, including gene regulation and epigenetics. These biological networks can be inferred by integrating multiple data modalities to create increasingly accurate and fine-grain descriptions of complex biological processes (Silverbush et al., 2019; Schulte-Sasse et al., 2021), leading to unprecedented opportunities to better understand complex disease etiologies and search for potential therapeutic targets (Reel et al., 2021; Ruiz et al., 2021). Given networks representing different biological contexts and conditions, graph differential analysis aims to identify the higher-order mechanisms that differentiate them, such as regulatory differences between healthy and diseased populations, or tracking the evolution and differentiation of biological processes and pathologies.
Differential analysis is a major component of well-established data science pipelines for tabular data such as gene expression. There, generalized linear model tools like edgeR (Robinson et al., 2010), DESeq2 (Love et al., 2014), and limma (Ritchie et al., 2015), have been used to create differential rankings of genes between groups that are then checked against databases of biological pathways (Ashburner et al., 2000; Kanehisa and Goto, 2000) to assign domain-relevant interpretations (Subramanian et al., 2005). An equivalent paradigm for graphs would complement these pipelines to reveal differences in higher-order gene interactions such as communities and cascades, including genes that, while not showing differential expression, are regulated differently and exhibit functional variations between biological states (Lopes-Ramos et al., 2020; Weighill et al., 2021; Saha et al., 2023).
A natural way to extend differential analysis pipelines with graph comparison is to infer a network for each biological state and then rank nodes based on differences in their summary statistics. A common choice for such a statistic is the node degree corresponding to the sum of all edge weights of a node, which is an interpretable proxy for differences in node connectivity. This bag-of-features approach, however, does not fully use higher-order graph structures like communities and cascades. For example, the degree is oblivious to fundamental operations such as adding and removing neighbors while preserving the number of edges.
In contrast to the bag-of-features paradigm, representation learning can infer node representations and relevant summaries that capture higher-order graph structures in a data-driven manner. Representation-based methods such as statistical modeling (Hoff et al., 2002; Rubin-Delanchy et al., 2022; Arroyo et al., 2021; Gallagher et al., 2021; Levin et al., 2019) and graph machine learning (Grover and Leskovec, 2016; Hamilton et al., 2017; Perozzi et al., 2014; Veličković et al., 2017) often exhibit better performance in graph tasks including node clustering or classification and link prediction without having to choose the node statistics explicitly.
Taking advantage of node representation learning to enable graph differential analysis in scientific applications, while well-motivated, poses many challenges. Comparing multiple graphs assigns the problem to the less studied multi-layer graph analysis regime (Kivelä et al., 2014), where one must generate a joint latent space in which nodes from different graphs can be correctly and meaningfully contrasted. In addition, a mapping from node embeddings to graph differences is essential to quantify node-specific discrepancies between networks. In the case of a single graph, concepts such as communities are characterized by affinity and structural equivalence that translate to proximity in the latent space. However, graph differences between multiple graphs are less well characterized, and the latent vector arithmetic is less well defined. One additional feature—and challenge—of graphs is that they are known to exhibit a no-free-lunch behavior where many “truths” can be conveyed simultaneously (Peel et al., 2017; Priebe et al., 2019), implying that multiple types of meaningful differences may be detectable and should be accounted for in graph comparison.
Finally, the overall procedure of graph comparison should be computationally efficient, trustworthy, and amenable to easy integration with established computational pipelines. For example, some embedding algorithms based on neural networks or random walks are unstable when generating representations (Schumacher et al., 2020; Wang et al., 2022), and little is known about their theoretical properties such as convergence. Further, computationally efficient procedures not only facilitate the analysis of multiple large graphs but also support the creation of ensembles consistent with veridical data science stability principles (Yu and Kumbier, 2020).
Our solution to the representation-based graph differential analysis task is to rank the nodes based on their disparities in the multi-layer latent space. This simple scheme resembles the clarity of bag-of-feature methods that compare node summary statistics but instead uses data-driven statistics and vector arithmetic that capture higher-order graph structures. As a multi-layer node embedding algorithm, we consider the unfolded adjacency spectral embedding (UASE) with singular value decomposition (Gallagher et al., 2021) that allows us to efficiently analyze multiple large graphs and to establish theoretical guarantees regarding the correct ranking of differences. For stability, we aggregate the rankings obtained from generating multiple latent spaces by varying the number of dimensions and considering different distance metrics to measure node disparity. The ranked output is then readily available for downstream applications such as gene set enrichment analysis and visualization of the largest differences.
In summary, our contributions are as follows. We developed node2vec2rank (n2v2r), a computationally efficient and stable graph differential method that uses the rich representation power of graphs based on multi-layer spectral embedding. We formally prove identifiability for the correct ranking of node differences in weighted graphs and two distance metrics. Finally, we validate the performance with both single-cell and bulk real-world data, with multiple network inference methods, different biological questions and applications, and different downstream analysis tools. The Python code and data analysis notebooks are publicly available at https://github.com/pmandros/n2v2r.
The Node2vec2rank Framework
We are interested in the problem of ranking nodes in unipartite graphs based on how much their “behavior” changes between graphs as captured through the application of appropriate criteria. Given a set of graphs with a common set of nodes, we denote their weighted adjacency matrices as , such that is the weight of edge in graph .
Under this formulation, the (weighted) node degree statistic, also known as connectivity, is defined as
| (1) |
which for a pair of graphs and leads to the Degree Difference (DeDi) ranking
| (2) |
with being the node with the q-th largest absolute degree difference between the two graphs. The degree is a valid node summary statistic for graph comparison, given its interpretability, but it is unable to detect the more complex differences occurring at higher-order graph structures such as communities and cascades. For example, consider a situation in which nodes change connectivity between graphs but maintain their sum of edge weights (in Figure 2, we simulated such a scenario).
Figure 2:
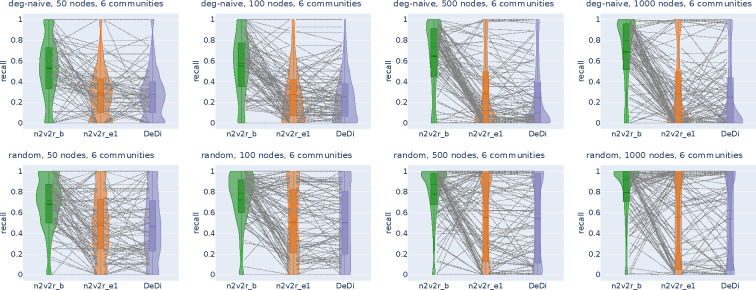
Recall violin plots for retrieving the nodes of the communities with the largest changes between two graphs. The data follow a dynamic stochastic block model with six communities constructed such that the community probabilities vary between the two graphs. The first row corresponds to degree-naive differences, where we permute the probabilities of a community to simulate changing connections but not degree. The second row corresponds to random differences, where we randomly change the probabilities of a community. For each scenario, we generate 2000 pairs of graphs by randomly applying the interventions and adding Gaussian noise. The number of nodes increases along the columns. The goal is to retrieve the nodes of the intervened community. For a random subset of 100(5%) sampled graphs, we connect the corresponding recall estimates for all methods. The solid and dotted lines in the violins correspond to the median and mean, respectively. The three methods compared are the proposed Borda aggregated n2v2r_b, the one-dimensional n2v2r_e1 with Euclidean distance, and the degree difference ranking DeDi.
Differential Ranking based on Multi-Layer Node Embeddings
Contrary to bag-of-features approaches, node embedding algorithms infer high-dimensional node representations that can encode the higher-order graph structures in a data-driven manner. For a single graph, an embedding function maps nodes to a point cloud in a latent space of dimensions, such that where the embedding of node is the vector corresponding to the row . We perform graph differential analysis by ranking nodes based on the disparity of their representations between graphs. We term this framework node2vec2rank (n2v2r).
A naive implementation of n2v2r for two graphs would involve obtaining two node embeddings from two separate applications of the embedding function, arriving at
| (3) |
where is the node that has the q-th largest disparity and is some distance metric. While this formulation is straightforward, there is one crucial requirement for n2v2r to be meaningful, which is the construction of a latent space that is provably common for all graphs—otherwise, any comparison would be misleading. For example, the naive n2v2r on two gene regulatory networks would create two separate embedding spaces that are not guaranteed to capture the same latent biology; the first latent dimension of the first graph could correspond to a metabolic pathway, while the first latent dimension on the second graph might correspond to a cell-signaling pathway.
This requirement is satisfied by multi-layer node embedding algorithms , such as statistical models (Gallagher et al., 2021) and fine-tuning and transfer learning techniques (Grover and Leskovec, 2016; Dingwall and Potts, 2018), that given a set of graphs with nodes each, they create a joint embedding space with sets of -dimensional representations
| (4) |
Now given two graphs, , n2v2r ranks with
| (5) |
where is the node that has the q-th largest disparity in the joint embedding space generated by .
Ranking given Multiple Graphs
The ranking process can be naturally extended using vector arithmetic to account for applications with graphs, a situation that can occur when comparing multiple conditions or tracking the evolution of a series of ordered graphs. In these instances, n2v2r first applies its multi-layer embedding algorithm and then uses three comparison strategies to produce pairwise rankings. The one-vs-all strategy performs pairwise comparisons, comparing the embedding to the mean of the remaining embeddings such that the ranking of node between graph and the rest is a function of
| (6) |
When an ordering for the graphs is available, the sequential strategy compares the embedding for to the previous embedding ; an alternative one-vs-before strategy adopts a stricter notion of ordering (such as for longitudinal data) and compares the embedding with the mean of all previous embeddings
| (7) |
The former method highlights nodes with the largest transition between consecutive network states, while the latter considers all previous graphs and focuses on unique differences for each graph in the ordered set.
Consensus and Stable Ranking
It should be noted that obtaining a “one true and meaningful” ranking is impossible in practice. One aspect to consider is the complexity of the graphs as objects, as they can convey multiple truths depending on the graph representation used (Priebe et al., 2019). Node ranking also depends on the choice of embedding dimensionality and the disparity measure used, both of which can be non-trivial to set for real-world data. These can be particularly problematic in Life Science applications where one wants to balance the predictability, computability, and stability of a method with the need to identify interpretable factors associated with the various biological states under study (Yu and Kumbier, 2020).
In n2v2r, we address this by generating a diverse collection of rankings using the cross-product of different choices for embedding dimensions and disparity functions. These rankings can then be aggregated into a single stable consensus ranking. As an aggregate function, we use the Borda voting scheme that outputs the mean rank of every node across all rankings. Note that the main requirement for enabling stability given arbitrarily large graphs is computational efficiency, meaning that the individual applications of n2v2r should be tractable. We present the n2v2r framework in Figure 1, where we simulated a case-control study with two graphs.
Figure 1:
Illustration of node2vec2rank and an analysis pipeline for a case-control study with two graphs. From the biological data, two gene regulatory networks are computationally inferred and subsequently contrasted using n2v2r to identify their differences. Node2vec2rank uses a multi-layer node embedding algorithm to create two sets of vector representations for all genes (depicted here in two dimensions). For every gene, n2v2r computes the disparity between its two representations, which is then used to rank the genes in descending order of disparities. The process is repeated multiple times, producing different embedding spaces (with dimensionalities of 2, 4, 8, 16, . . . ) and ranking based on different distance metrics (cosine, Euclidean, etc.). The multiple rankings are aggregated to produce a final stable ranking. The output is readily available to be used in downstream applications including visualizing the largest differences and performing gene set enrichment analysis.
Fitting Node2vec2rank with UASE
Reliable and effective tools for the analysis of complex scientific “big data” must be scalable with sound theoretical performance. For graph differential analysis, we need guarantees that the method retrieves the optimal ranking with mild assumptions and that the approach is scalable for multiple large graphs and ensembles that enable stability. We achieve these by employing the unfolded adjacency spectral embedding (UASE) as a multi-layer embedding algorithm (Gallagher et al., 2021), which we prove obtains the optimal ranking under an appropriate statistical model for real-world weighted graphs.
Multi-Layer Latent Position Model
We assume there exists a latent space in which the latent position dictates how node forms edges in graph . The weighted multi-layer latent position model assumes that the weight of an edge in depends only on the latent positions of nodes . For all and , we have
| (8) |
where is a symmetric real-valued distribution function, for all .
Under an approximate low-rank adjacency matrix assumption (see Appendix), valid for many real-world networks (Udell and Townsend, 2019), there exists a map representing the latent positions in a -dimensional space such that
| (9) |
Under this assumption, this general model covers a range of graph types extending the weighted generalized random dot product graph (Gallagher et al., 2023). For unweighted networks, is a Bernoulli distribution with some link probability function , and the latent position model is a special case of the multi-layer random dot product graph (Jones and Rubin-Delanchy, 2020; Gallagher et al., 2021). This includes the stochastic block model as well as mixed membership and degree-corrected variants.
Node2vec2rank with UASE
Given weighted adjacency matrices , we construct the unfolded adjacency matrix using column concatenation
| (10) |
Given embedding dimension , we compute the -truncated singular value decomposition (SVD) of , where are truncated left and right singular vectors, and is the diagonal matrix with the largest singular values. Using row concatenation to the right singular vectors corresponding to the graphs, we have
| (11) |
and the UASE for graph is defined by
| (12) |
UASE is particularly attractive in our multi-layer setting as it offers longitudinal stability, meaning that if a node has similar behavior in graphs and , then the embeddings and will be approximately equal (Gallagher et al., 2021). Moreover, SVD is a well understood, widely used, and scalable algorithm with multiple implementations. Finally, as the UASE is derived from the SVD of the weighted unfolded adjacency matrix representation, it is possible to derive statistical guarantees about the behavior of the resulting embeddings. Towards this end, we contribute Theorems 1, 2, the proofs of which, together with the necessary model assumptions, can be found in the Appendix.
Theorem 1 states that UASE converges to the -dimensional representation of the latent position up to an orthogonal transformation, extending previous UASE results for multiple unweighted binary graphs (Gallagher et al., 2021; Jones and Rubin-Delanchy, 2020) and a single weighted graph (Gallagher et al., 2023).
Theorem 1
(Uniform consistency of UASE). Under Assumptions 1, 2 and 3, there exists an orthogonal matrix such that, for all ,
| (13) |
with high probability as .
In the second part of n2v2r, we rank nodes based on node embedding disparities which are estimates of the latent position distances . Theorem 1 shows that the latent position distance estimate can only be consistent if the distance function is invariant up to orthogonal transformation, such that for all , we have that
| (14) |
Theorem 2 shows that fitting n2v2r with UASE is consistent for the Euclidean and cosine distances, both of which satisfy the invariance condition.
Theorem 2
(Uniform consistency of n2v2r). Under Assumptions 1, 2 and 3, for all ,
| (15) |
with high probability as for Euclidean distance, and cosine distance provided .
Simulation Experiments
We assessed the ability of n2v2r to detect differences in networks generated with a known ground truth. We explored network differences in two different regimes termed degree-naive and random. The first corresponds to graph differences where the structure and connections can change, but the degrees of nodes vary little, which is a key motivation for this work. In the second, we modeled random differences by allowing the degrees to vary arbitrarily. For comparison, we considered the degree difference ranking (DeDi), n2v2r with embedding dimension and Euclidean distance as a baseline (n2v2r_e1), as well as the resulting method n2v2r with Borda aggregation (n2v2r_b) for dimensionalities with Euclidean and cosine distances (aggregation over 22 different rankings). Note that the baseline n2v2r_e1 can be contrasted with DeDi to compare the performance of a one-dimensional bag-of-features approach against learning a one-dimensional feature.
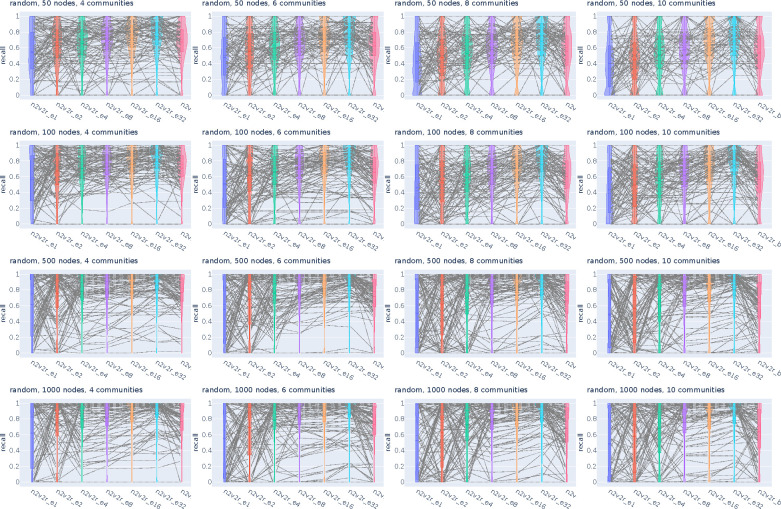
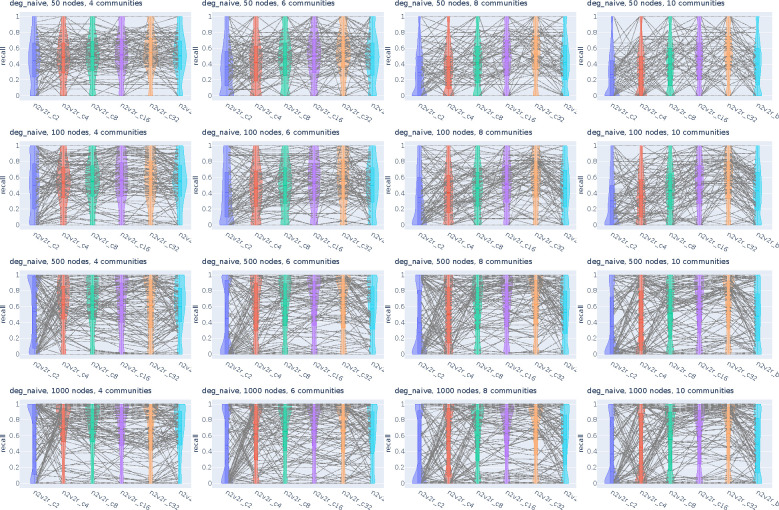
We simulated the differences by altering the probability matrices in a dynamic stochastic block model such that the community probabilities vary between two graphs (see Methods). The task is to retrieve the nodes of the community with the largest displacement in probability space. To cover a wide range of ratios, we altered the number of communities in and the number of nodes in , with the task becoming more challenging as the number of nodes decreases or as the number of communities increases. For example, the combination and implies that there is an average of 8 nodes per community. We sampled 2000 pairs of graphs for each combination of ,, and graph difference regime and generated violin plots for the mean recall in ranking the nodes of the community that changed the most at the top. The results for are shown in Figure 2 (results for all and are given in Appendix Figures A1, A2).
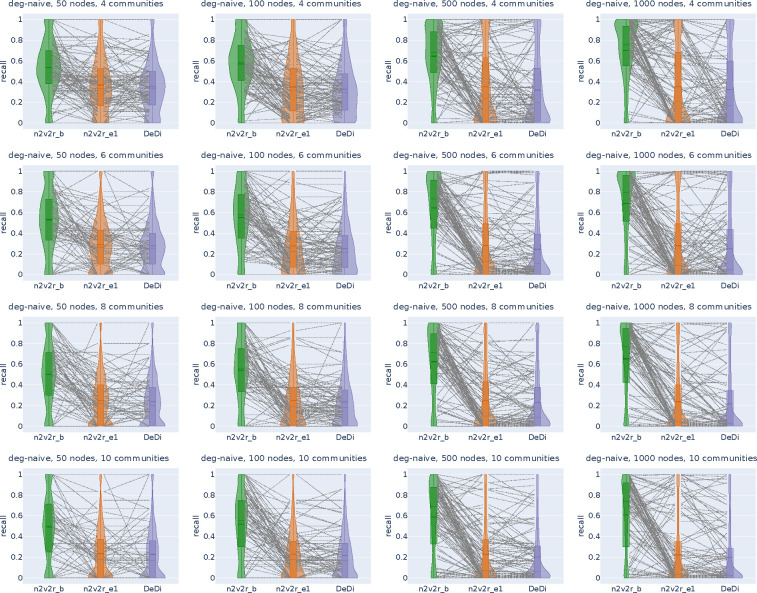
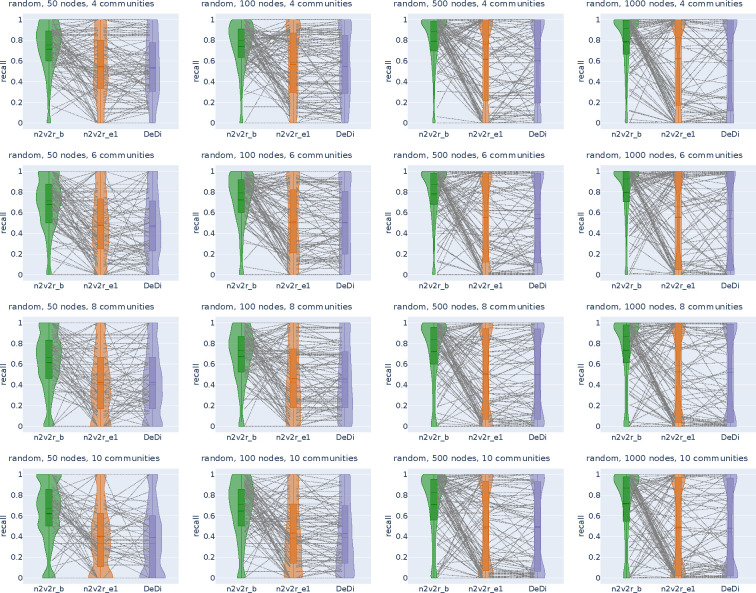
In the first row of Figure 2 with the degree-naive networks, we observe that DeDi is unable to find the target nodes as expected, the one-dimensional n2v2r has slightly better performance, and the aggregated n2v2r performs the best and exhibits the most stable performance, which improves with the number of nodes. For the random-difference networks in the second row of Figure 2, all methods exhibit improved performance since degree-naive is a harder case. We observe that the aggregated n2v2r has the best performance, while the one-dimensional DeDi and n2v2r exhibit large variability, with n2v2r performing slightly better. Overall, these results demonstrate that the statistical methods can indeed better adapt to the data, while a single dimension performs poorly at capturing complex graph differences.
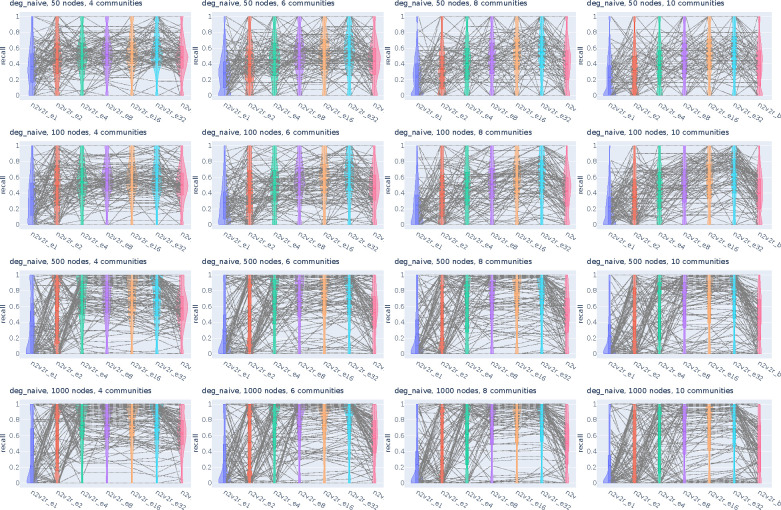
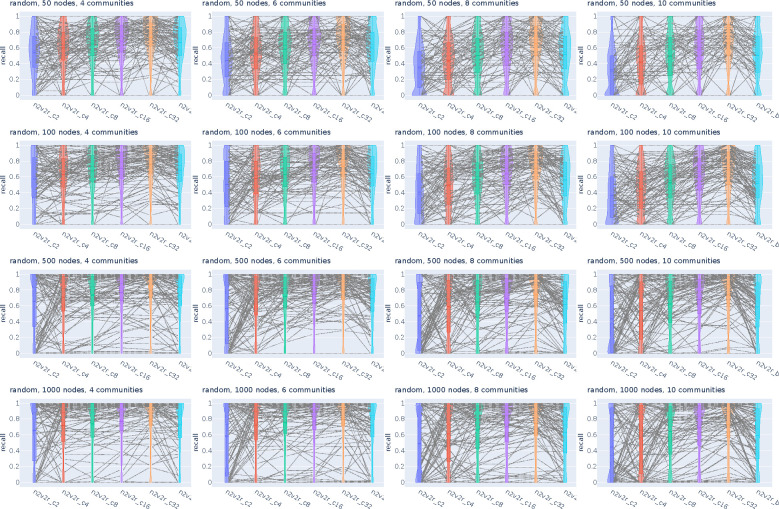
We also evaluated performance as a function of dimension, distance metric, and aggregation (Figures A3, A4, A5, A6). We found that both Euclidean and cosine distances perform well, with Euclidean having an advantage because the networks were generated as stochastic block models. Increasing the dimensionality also improved performance in the random differences case, while that is not entirely true for the degree-naive differences, where performance can decline due to overfitting, particularly for a small number of communities.
Biological Applications
To demonstrate the utility of node2vec2rank on real-world data, we performed graph differential analysis using gene regulatory and correlation-based networks. We considered the three biological questions of characterizing the differentiating processes of luminal A breast cancer subtype, studying cell-cycle transitions in single-cell data, and searching for sex differences in lung adenocarcinoma. The data analysis pipelines involved collecting, pre-processing, and integrating biological data, inferring gene interaction networks in different biological states, performing graph differential analysis, and using the ranking with downstream applications such as functional enrichment analysis and plotting. We used the Borda aggregated n2v2r with dimensionalities and using Euclidean and cosine distances (22 rankings in total).
Luminal A Breast Cancer
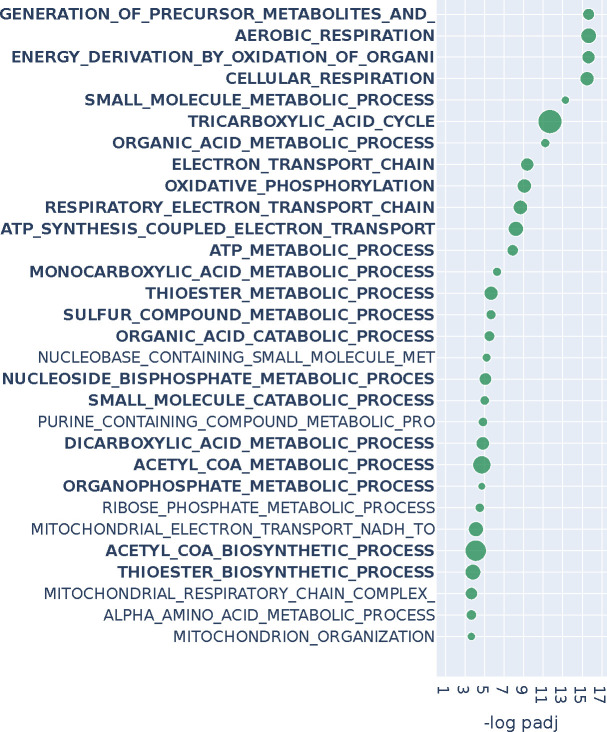
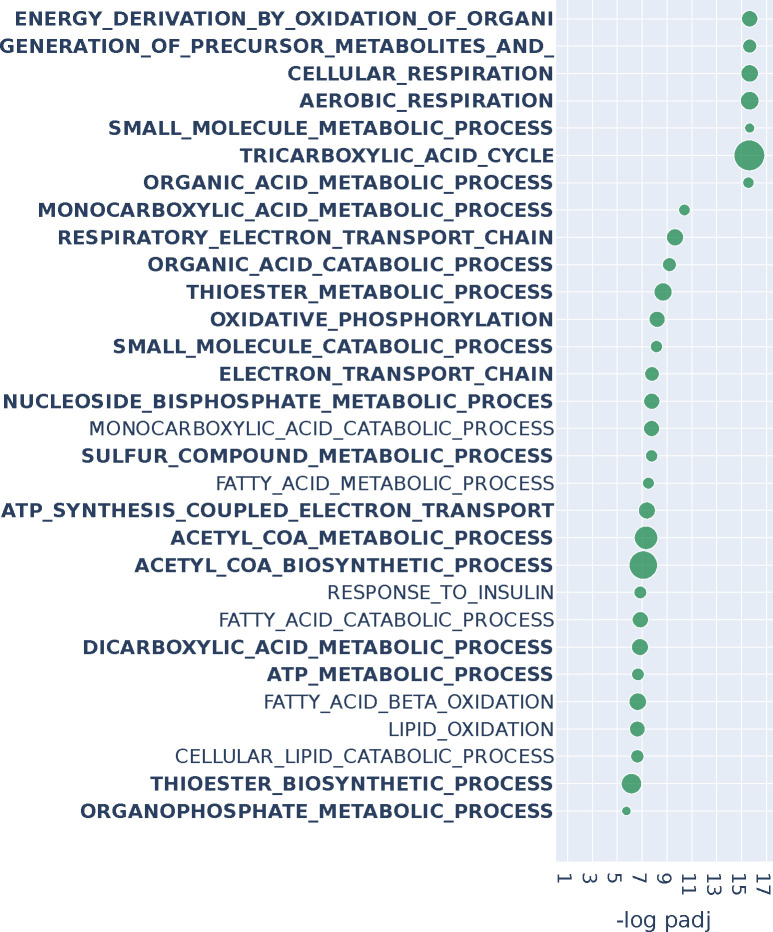
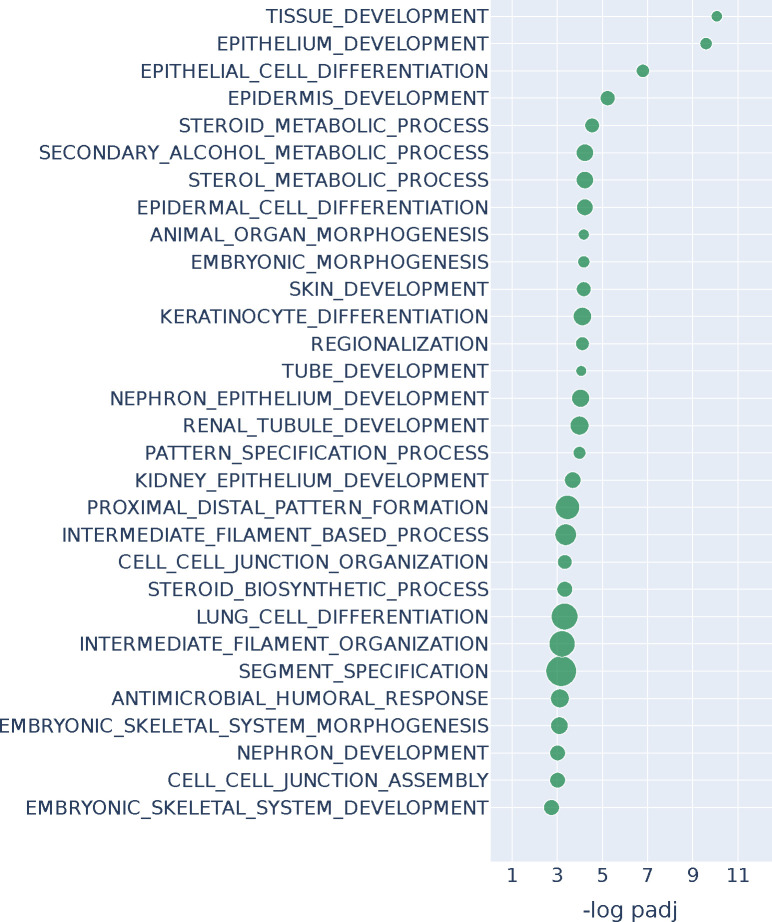
From the Cancer Genome Atlas (TCGA) we identified 60 individuals for whom expression profiling had been performed on both luminal A tumor and matched normal adjacent tissue (Cancer Genome Atlas Research Network et al., 2013). We downloaded the corresponding uniformly normalized and standardized gene expression data from Recount3 (Wilks et al., 2021) and inferred a pair of tumor and normal PANDA gene regulatory networks (see Methods). PANDA is a regulatory network inference method that integrates transcription factor motif and protein-protein interactions prior knowledge with gene expression to create bipartite transcription factor-to-gene regulatory networks (Glass et al., 2013). We transformed the bipartite graphs to unipartite by projecting them to gene-by-gene matrices that represent co-regulation. We then performed graph differential analysis with n2v2r and DeDi, selecting the top 2% (roughly 500) genes from each method to perform over-representation analysis using the biological processes gene ontology database (GOBP) (Ashburner et al., 2000). The runtime for n2v2r was approximately 5 minutes on a c5.12xlarge AWS EC2 instance. Figure 3 shows the top 30 FDR-adjusted pathways of n2v2r, with bold font indicating those found also by DeDi (Appendix Figure A7).
Figure 3:
Over-representation analysis with GOBP annotations for the top 2% of genes (roughly 500) of n2v2r on BRCA TCGA when comparing luminal A patients against matched adjacent normal samples using PANDA regulatory networks. We present the top 30 results ranked by adjusted p-values that pass a 0.1 FDR cutoff (equivalent to −log padj = 1). Bold indicates pathways common with DeDi when performing the same analysis. The size of the points indicates the overlap of the input gene set with the pathways. Long pathway names have been trimmed.
Many of the GOBP terms found to be significant are associated with metabolic processes, concordant with the hypothesis that a driver of luminal A breast cancer is the alteration of metabolic processes (Prat et al., 2015; Lunetti et al., 2019). We also found processes associated with the mitochondria, including oxidative phosphorylation (OXPHOS), consistent with reports that luminal A breast tumors exhibit increased OXPHOS activity relative to basal-like breast cancer and other subtypes (Cappelletti et al., 2017; Ortega-Lozano et al., 2022), and that OXPHOS activity is predictive of outcomes in estrogen receptor (ER) positive breast cancer (El-Botty et al., 2023; Koc et al., 2022). Changes in OXPHOS and mitochondrial functions more generally can alter how breast cancer cells adapt their metabolism to support rapid growth, survive under various conditions, and evade therapeutic interventions (Avagliano et al., 2019).
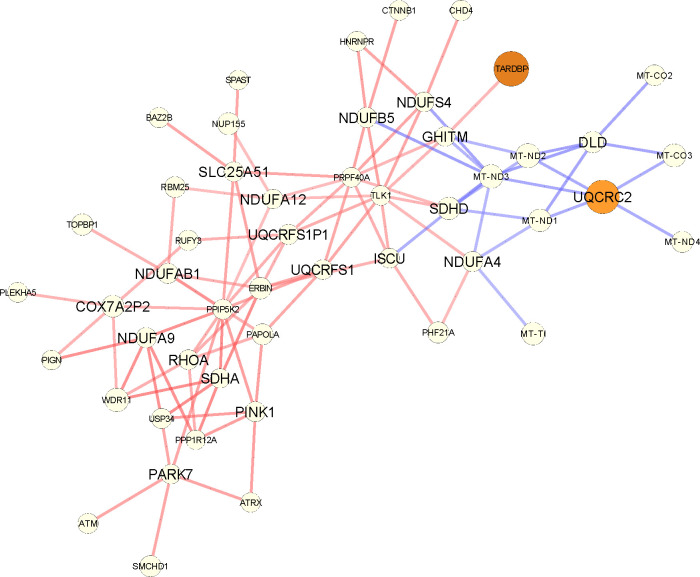
Increased regulatory connectivity of metabolically relevant genes for lumA can also be seen in the network comparison in Appendix Figures A8, A9. For example, the NDUFA9 and SDHA genes are common between multiple GO pathways. NDUFA9 is a component of complex I in the respiratory chain and its downregulation has been reported to promote metastasis by mediating mitochondrial function (Stroud et al., 2012; Li et al., 2015). SDHA, which is known to be a tumor suppressor gene, encodes one of the four subunits of the succinate dehydrogenase (SDH) enzyme, which plays a critical role in both OXPHOS and the Krebs cycle (Rutter et al., 2010); SDHA has also been identified as a marker for breast tumor progression and prognosis (Kim et al., 2013).
In contrast, differential gene expression analysis using DESeq2 followed by over-representation analysis for GOBP terms found only enrichment for general development processes that do not speak to the mechanisms that are altered in a disease-relevant manner (Appendix Figure A10), demonstrating the importance of network analyses.
Cell Cycle with Single-Cell RNA-seq
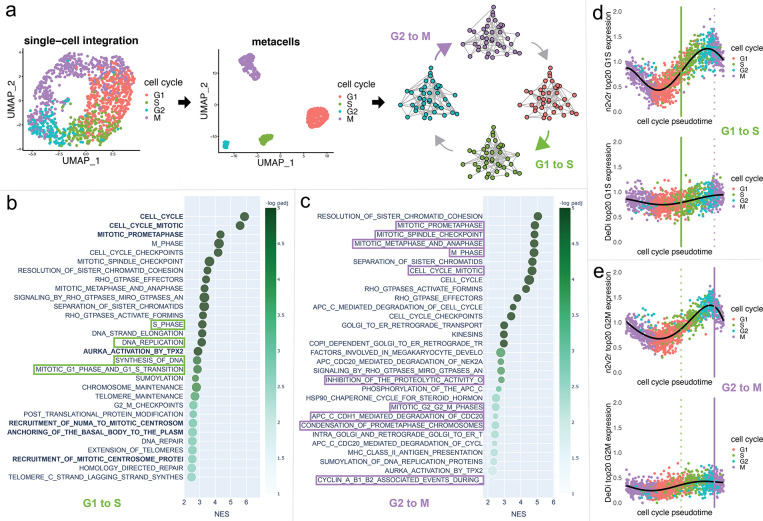
We investigated cell cycle transitions in single-cell data. Cells undergo the four phase transitions G1→S→G2→M when they grow and divide as part of the cell cycle. G1 is the first growth phase, which is followed by S, the synthesis phase where the cell replicates its DNA. Then, the cell enters a second growth phase G2, which will be followed by mitosis (M) where the cell physically divides into two daughter cells, after which the process repeats for the daughters. We used combined data from wild-type and AGO2 knock-out HeLa S3 human cell lines comprising 1477 unsynchronized cells (Schwabe et al., 2020). We integrated the data using Seurat (Hao et al., 2021) and aggregated single-cells to create “metacells” that represent the four cell-cycle states from which we constructed four topological overlap networks of dimensions 2420 × 2420 using hdWGCNA (Morabito et al., 2023) (see Methods). We applied n2v2r jointly on all networks using the sequential strategy of computing pairwise rankings of networks against the next in the cycle. To facilitate validation, we studied the well-known G1→S and G2→M transitions where the Reactome database contains explicitly annotated pathways (Gillespie et al., 2021). Runtime on a c5.12xlarge AWS EC2 instance was roughly 10 seconds.
An overview of the data integration and network inference process is given in Figure 4a. Figure 4b, shows the top 30 FDR adjusted gene set enrichment analysis (GSEA) results based on Kolmogorov–Smirnov testing using the function prerank of GSEApy (Fang et al., 2022) for annotation based Reactome pathways (see Methods). The green boxes indicate pathways that explicitly refer to the G1→S transition, and bold text indicates results also found using DeDi (corresponding enrichment results can be found in Appendix Figure A11). We see that n2v2r identifies at least 3 exclusive pathways that are related to G1→S while DeDi finds none. We also see that both methods pick up common pathways related to the G2→M transition. Panel c shows the top 30 GSEA results for the G2→M transition, with purple boxes indicating Reactome pathways explicitly annotated to this transition. We see that n2v2r finds pathways related to G2→M and with large enrichment scores while DeDi finds no significant results.
Figure 4:
Single-cell cell cycle transitions analysis. In panel a, the HeLa S3 cell line is processed using Seurat, with the cells being aggregated to create metacells from which four networks are being generated using hdWGCNA. The four networks correspond to the cell cycle phases G1, S, G2, and M (panel a). The two transitions that are being analyzed are G1 to S (green) and G2 to M (purple). In panel b, gene set enrichment analysis with the Reactome database and Kolmogorov–Smirnov test is performed to study the G1 to S transition, showing the top 30 results ranked by adjusted p-values that pass FDR 0.1 cutoff (equivalent to −log padj = 1). For this, we used the function prerank of GSEApy. The x-axis represents the normalized enrichment score, and color the −log padj value. The size of the points indicates the overlap of the leading gene sets with the pathways. Bold color indicates common top pathways that DeDi found on the same networks. The pathways that explicitly mention terms related to the G1 to S transition are placed in green boxes. The same procedure with purple boxes for the G2 to M transition is displayed in panel c. Long pathway names have been trimmed. In panel d, we plot the average scaled and normalized expression for the top 20 genes in the ranking of the G1 to S transition according to each method (n2v2r top, DeDi bottom). The x-axis represents the cell cycle pseudotime ordering of the cells using Revelio. The vertical lines represent the 0.9 quantile of pseudotime for G1 (left, green) and G2 (right, purple, dotted) cells, acting as proxies for the time the transitions occur. The black curve is a 5-th order polynomial fit to the data. Similarly, in panel e for the G2 to M transition.
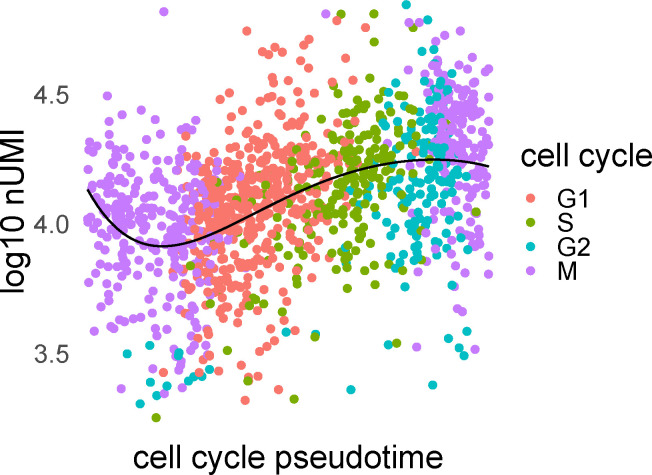
Since the analysis here fundamentally represents a time course captured in individual cells, we wanted to understand the overall profiles of genes found by n2v2r and DeDi during cell cycle phase transitions. Figure 4d,e, shows the average gene expression of the top 20 genes in all cells identified by n2v2r (top) and DeDi (bottom) for the two transitions; cells are ordered according to cell cycle pseudotime assigned using Revelio (Schwabe et al., 2020). It is interesting to note that the number of unique molecular identifiers (nUMI), corresponding to the number of distinct mRNA transcripts, increases with pseudotime and then drops after G2, which is where cell division occurs (Appendix Figure A12). Given the cellular processes active during the cell cycle, we expect the number of transcripts to track with marker genes that indicate the cell cycle phase. In panel d, with marker genes selected for the G1→S transition, we see that n2v2r identifies genes with a steep transition between these phases. In panel e, for the G2→M transition, n2v2r again retrieves genes that sharply decline in expression after entry into M, correctly capturing the point of mitosis. In contrast, the DeDi genes for both transitions were lowly expressed without marker behavior, thus failing to capture relevant cell cycle processes.
Sex Differences in Lung Adenocarcinoma
Lung cancer manifests differently in males and females, where both prognosis and response to therapy differ between the sexes (Reddy and Oliver, 2023; Silveyra et al., 2021) but mechanistic causes for these differences remain largely unknown (Legato et al., 2016; Özdemir et al., 2018). We explored differences in male and female gene co-expression patterns in lung adenocarcinoma (LUAD) using data from TCGA. We used the weighted correlation network analysis (WGCNA) R package (Langfelder and Horvath, 2008) to construct two sex-specific 26000 × 26000 co-expression networks (see Methods). The runtime for n2v2r was approximately 1 minute on a c5.12xlarge AWS EC2 instance. Lastly, we removed the Y chromosome genes from the rankings of both methods.
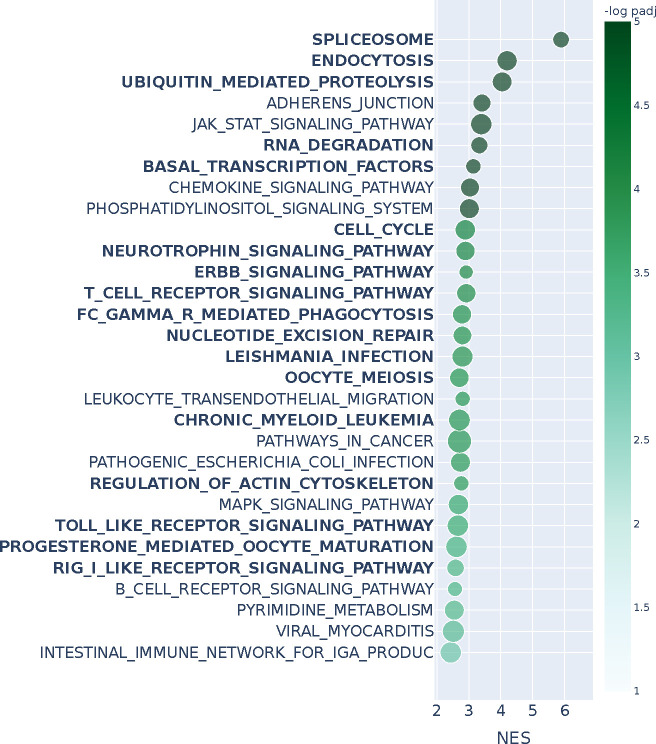
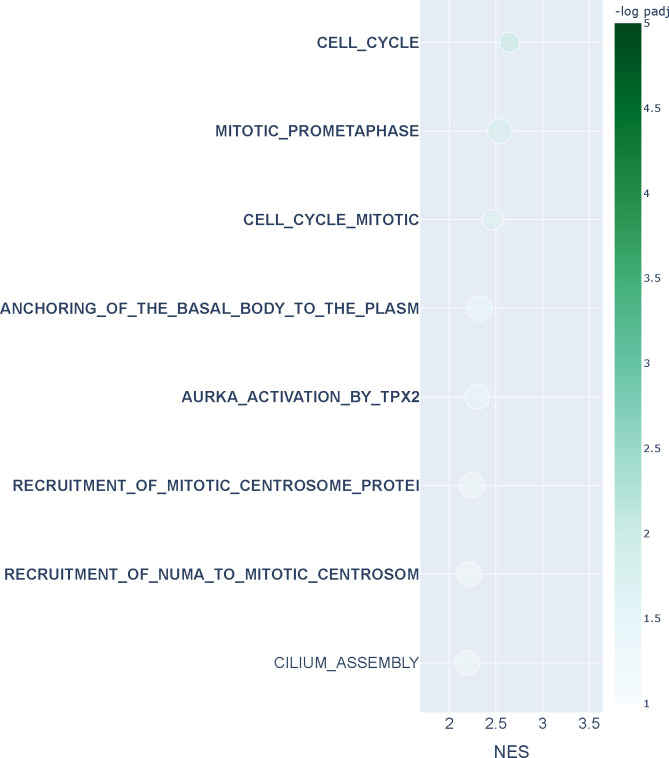
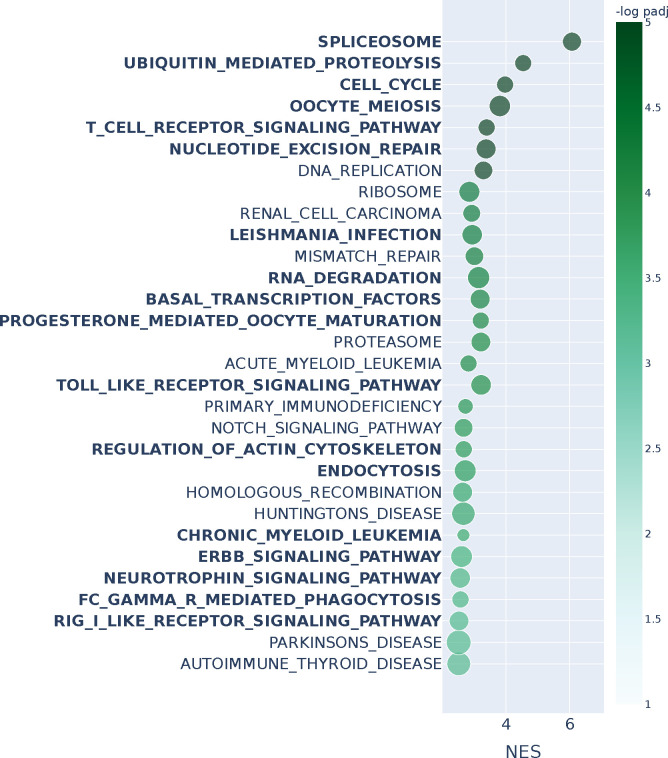
Figure 5 shows the top 30 enriched KEGG pathways based on gene set enrichment analysis using the ranked list from n2v2r; bold font indicates pathways also found using DeDi (Appendix Figure A13). We found a 60% overlap (18 out of 30) between the enriched pathways identified using n2v2r and DeDi. Not surprisingly, many of the common pathways are related to immune processes, such as the T cell receptor and Toll-like receptor signaling, which are known to be sex-biased in LUAD (Klein and Flanagan, 2016). In addition, pathways such as spliceosome, endocytosis, ubiquitin mediated proteolysis, and cell cycle, correspond to sex-biased cellular processes (Rubin et al., 2020; Rubin, 2022).
Figure 5:
Gene set enrichment analysis with KEGG annotations and Kolmogorov–Smirnov test for the entire n2v2r ranking on LUAD TCGA when comparing male against female PANDA regulatory networks. We present the top 30 results ranked by adjusted p-values that pass a 0.1 FDR cutoff (equivalent to −log padj = 1). Bold indicates pathways common with DeDi when performing the same analysis. The x-axis represents the normalized enrichment score, and color the −log padj value. The size of the points indicates the overlap of the leading gene sets with the pathways. Long pathway names have been trimmed.
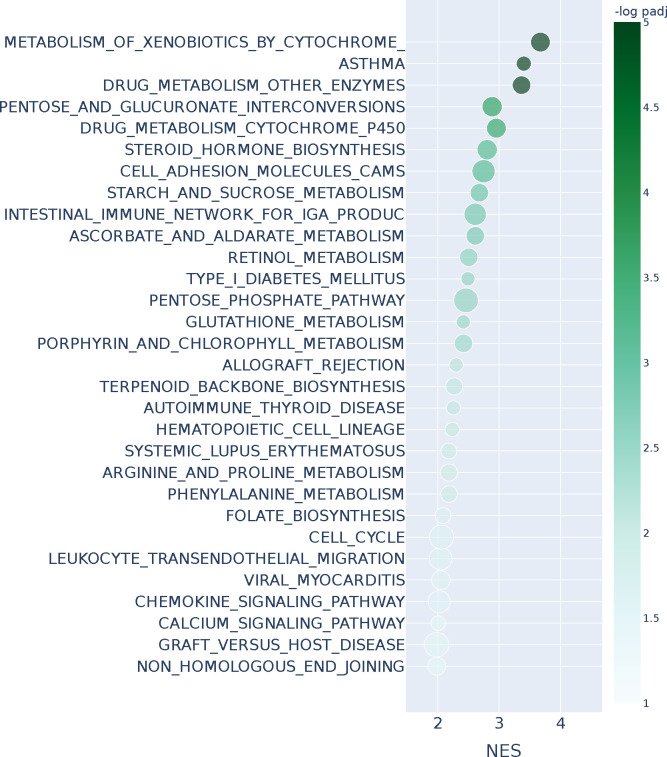
The enriched pathways that are exclusive to the DeDi ranking include many related to neurodegenerative disorders, other cancer types, and broad cellular pathways such as ribosome and DNA replication (Figure A13) that provide little insight into sex-specific LUAD mechanisms. In contrast, the exclusive pathways of n2v2r allowed identification of specific cancer-related processes that include the MAPK and phosphatidylinositol pathways known to be regulated by sex hormones with their disruption leading to propagation of non-small cell lung cancer cells and tumor growth (Fuentes et al., 2021). Another example is B-cell receptor signaling, with B-cell related genes reported as significantly upregulated in the LUAD tumors of females, which also have a higher number of infiltrating B-cells (Klein and Flanagan, 2016); this sex-specific B-cell difference has also been reported in the TCGA LUAD samples (Li et al., 2023).
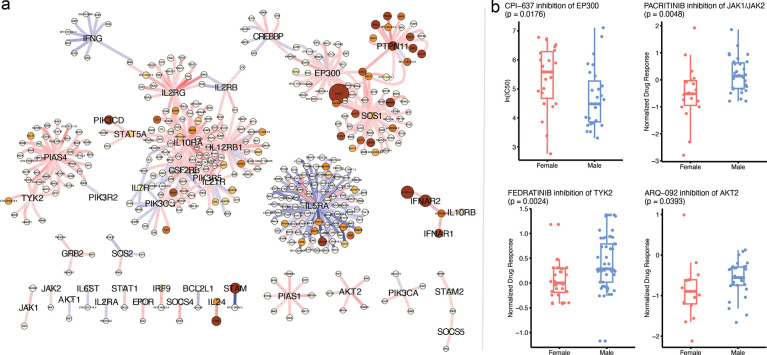
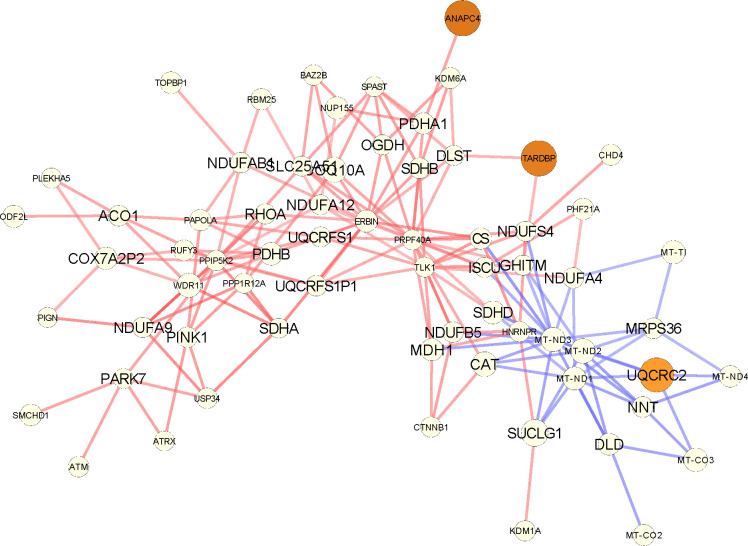
Furthermore, among the exclusive pathways found with n2v2r is the JAK/STAT signaling, a crucial cellular communication pathway involved in the regulation of various physiological processes, including immune responses, cell growth and differentiation, and identified as playing a role in lung cancer development and progression (Thomas et al., 2015; Hu et al., 2021). To explore further the putative sex bias of this interesting pathway, we first recovered from GSEApy the subset of genes from the n2v2r ranking that are most responsible for the pathway to be deemed significantly sex-biased. Then we plotted the subgraph of , focusing on those leading genes as central nodes (with larger font) and their top 500 connections. We present the subgraph in Figure 6a, with blue and red edges indicating higher co-expression in males and females, respectively. Node size reflects the degree difference, and color denotes whether the gene is significantly differentially expressed between males and females based on DESeq2 tabular analysis (Love et al., 2014).
Figure 6:
Probing the leading genes of the JAK/STAT signaling pathway for sex differences. Panel a shows the top 500 edges of the differential network centered on the n2v2r leading genes of the JAK/STAT pathway as returned by GSEApy, shown here with larger fonts. Red edges mean greater co-expression in females, and blue edges greater in males. The size of the nodes is the absolute degree difference. Nodes are colored according to the adjusted p-value from differential gene expression analysis with DESeq2: white is not significant, yellow to red is significant between 0.1 and 0. Panel b shows significant sex-biased drug responses (lower more sensitive) by inhibiting JAK/STAT genes in LUAD cell lines that are not differential in node degree and gene expression. The EP300 is from the GDSC repository, the rest from PRISM.
We observe that the majority of the leading genes do not exhibit sex differences with gene expression and node degree. However, we found significant sex differences in drug responses. In particular, we considered the PRISM (Yu et al., 2016) and GDSC (Yang et al., 2012) databases that contain results of small molecule drug treatments of LUAD cell lines derived from both male and female donors and found significant sex-based differences for compounds targeting genes in the JAK/STAT signaling pathway (see Methods). Figure 6b shows that inhibitors targeting five JAK/STAT pathway genes, EP300, JAK1, JAK2, TYK2, and AKT2, exhibit significant sex-biased responses. For JAK1, JAK2, TYK2, and AKT2, we found a strong female bias in correlation network connectivity (only red edges) and that this corresponded with inhibitory drugs being more effective for females; inhibitors of EP300 produced a better response in males. These results suggest that n2v2r can capture sex differences in co-expression networks that transcend gene expression and degree.
One additional gene, IL5RA, also exhibited substantial sex-biased differences in correlation patterns (Figure 6). The IL5RA, a protein, is involved in the IL-5 signaling pathway, which plays a key role in regulating immune responses and particularly in the activation of eosinophils. IL5RA has been implicated in multiple pulmonary diseases, including COPD and asthma, as well as lung adenocarcinoma (Fan et al., 2021; Sibille et al., 2022). Little is known, however, regarding the role of IL5RA in LUAD sex differences. A recent meta-analysis of GWAS data found IL5RA to be significantly sex-biased in lung epithelial tissue (Gautam et al., 2019), consistent with our observation of a male bias in the differential network (more blue edges). This suggests that sex-specific differences in the immune microenvironment, including the presence of specific immune cells such as eosinophils, may influence the course of the disease and possibly influence response to immunotherapy checkpoint inhibitors in a sex-biased manner.
Lastly, the results for differential gene expression analysis with DESeq2 (Appendix Figure A14) are focused specifically on well-known sex-biased metabolic processes and less so on other cancer related processes (Krumsiek et al., 2015). Here, we observe the synergistic yet distinct contributions of both tabular and graph-based analyses within the same data analysis pipeline.
Overall, the three biological questions with real-world data we considered show that node2vec2rank can effectively compare high-dimensional networks to produce biologically meaningful results and clearly demonstrate its advantages over alternative methods such as DeDi and tabular analysis.
Discussion
Computational methods in Life Sciences are now commonly used to infer increasingly accurate and detailed graph representations for the various phenomena under investigation. Comparing the networks corresponding to different system states is therefore a key application for uncovering novel system-driving factors. Identifying the key features that distinguish a set of graphs is, however, a challenging task since graphs can be arbitrarily complex in terms of size and the higher-order associations they represent. Towards this end, we developed node2vec2rank (n2v2r), a multi-layer node embedding method that effectively utilizes the rich representation power of graphs to perform graph differential analysis. In contrast to bag-of-features approaches that consider user-defined node summary statistics, n2v2r infers node representations in a data-driven manner that go beyond connectivity proxy measures such as node degree for which simulations validated their sub-optimal performance. Based on the unfolded adjacency spectral embedding (UASE) algorithm and singular value decomposition, n2v2r is an efficient, stable, and transparent method that provably identifies the correct ranking of differences given multi-layer weighted networks, producing an output that is readily available for well-established data analysis pipelines; aspects critical for veridical data science applications in the Life Sciences.
Applying n2v2r to three biological applications allowed us to identify key features that were not detected with differential expression tabular analysis with DESeq2 or graph-based degree difference analysis with DeDi. In characterizing the luminal A breast cancer subtype with gene regulatory networks and bulk data from the Cancer Genome Atlas project (TCGA), we showed that both n2v2r and DeDi rankings were able to identify key metabolic processes such as oxidative phosphorylation (OXPHOS), surpassing DESeq2. In the cell cycle analysis with single-cell data gene co-expression networks, n2v2r identified multiple biological processes that are known to be activated during the respective cell-cycle phases, and found marker genes that exhibit meaningful oscillatory expression patterns over the entirety of the cell cycle, clearly outperforming DeDi. In searching for sex differences in lung adenocarcinoma (LUAD) using bulk TCGA data and co-expression networks, n2v2r found known sex-biased pathways in LUAD, including B-cell associated processes and other aspects of immune response that can provide insights into LUAD development and progression and cancer immunotherapy. In an exploratory setup, n2v2r led us to investigate genes in the JAK/STAT signaling pathway that are neither differentially expressed nor differential in their node degree. We found that inhibition of the proteins encoded by these genes in lung cancer cell-lines results in sex-biased drug responses, meaning that n2v2r recovered actionable regulatory patterns that are invisible to standard analysis methods. We were further able to generate research avenues for the sex-biased role of IL5RA in LUAD, with recent studies investigating its clinical significance in LUAD and confirming the significant sex bias in lung epithelial tissue with a genome-wide association meta-analysis.
A challenge in developing n2v2r was the choice of embedding dimensionality. It is common for machine learning methods to use a large number of dimensions such as 64, 128, 256, etc, but measuring distances in these embedding spaces tends to become meaningless as the dimensions grow. The exact number of dimensions where this occurs, especially for graphs with different characteristics, is difficult to establish. The Borda aggregation helps to average and stabilize the performance, which is beneficial in cases of misspecification. We opted for the default number of dimensions to be moderate, aiming for 4 to 24 with an increment of 2, for a total of 22 rankings (11 with cosine distance and 11 with Euclidean distance). This showed consistently good results in three widely different real-world data applications. Another more informed option would be to consider the singular values and amount of variance explained and to place a window around the elbow point in the scree plot.
Overall, and to the best of our knowledge, node2vec2rank is the first method that provides an effective and theoretically justified method to compare networks, validating its performance through a diverse set of applications. Although we limited our analysis to unipartite networks, we believe that the method can be extended to multipartite networks that more accurately represent processes such as gene regulation. While spectral embedding is applicable to such networks in single graph analysis (Modell et al., 2022), the extension to multiple graphs is less clear. Knowing which graph is affected the most by differences in node and pathway may allow the identification of directionality between related networks. One possible approach would be to consider the sign of the difference in node embedding norms with a larger norm implying a more active node in the comparison. Lastly, considering non-linear interactions and node disparities as functions of local neighborhood, as well as incorporating node and edge features, all while maintaining theoretical guarantees, interpretability, and efficiency, will enable the discovery of more complex differential patterns.
Finally, although biological applications motivated the development of n2v2r, the framework is general, and the method can easily be applied to graph comparison problems that arise in other disciplines.
Methods
Simulated Network Generation
We generate pairs of binary graphs following two stochastic block models with communities and community probability matrices . Each node is assigned to one of the communities uniformly at random, the same in both graphs . For convenience, we drop the unnecessary superscript for community assignments.
First, we generate the adjacency matrix by independently sampling Bernoulli edges for each pair of nodes according to their community assignments,
| (16) |
as given by the multi-layer latent position model in Equation 8. However, the method for generating the adjacency matrix will differ from this latent position model to provide a better test of the n2v2r framework.
To generate we adjust the first graph to satisfy the correct community probabilities given by ,
| (17) |
We consider two possible cases for the pair of nodes and :
- if , we delete the edge if it exists with probability
- If , we add the edge if it does not exist with probability
In all other cases, the adjacency matrices remain the same. Under this sampling method, Equation 17 is satisfied.
Simulated Network Differences and Ground Truth Assignment
Both regimes are simulated by intervening on a randomly sampled community probability matrix to create the second . For the degree-naive differences, we sample a uniformly at random with values ranging in [0, 0.5]. Then, to create we “flip” the first row vector and column vectors of while (1) maintaining as is. The effect of this transformation is that the community represented by the first row and column will have its connections with the rest of the communities re-assigned, but the overall degree remains the same. An example of this operation with four communities is the following, highlighting with bold the elements to be flipped:
Finally, we proceed to add noise to the remaining of with 50% probability following a normal distribution .
For the second regime of random differences, we follow a similar scheme. First, we sample a uniformly at random with values ranging in [0, 0.5]. Then we create by completely re-sampling the first row and column of with another set of values in [0, 0.5]. Then, we proceed to add noise to the remaining of with 50% probability following a normal distribution .
Note that the Gaussian noise added can cause the intervened community to fall in ranks, which would invalidate its ground truth assignment as the most changing. To overcome this, we introduce a rejection sampling scheme where we reject a pair of matrices if the community-wise Borda aggregated Euclidean, cosine, and Chebyshev distances between and do not rank the intervened community as the most changing.
Single-cell Cell Cycle Network Generation and Analysis
We used the single-cell data of Schwabe et al. (2020) available with GEO accession number GSE142277 that corresponds to 1477 cells from HeLa S3 wild-type and AGO2 knock-out (AGO2KO) cell lines (Schwabe et al., 2020). We used the Seurat v4.3.0.1 pipeline to remove cells with fewer than 200 genes detected and greater than 5% mitochondrial ratio, arriving at 1282 cells. We used SCTransform to regress out the two batches, wild-type and AGO2KO.
With the processed HeLa S3 data, we used hdWGCNA (Morabito et al., 2023) v0.2.26 to create gene correlation networks from metacells. The metacells are created with the MetacellsByGroups function that performs KNN on PCA space with number of neighbors , maximum number of shared cells between two metacells set to 10, and grouped by the four stages. We used this setting to get a reasonable amount of metacells, amounting to 792 in total (out of 1282). Then, with functions SetDatExpr and PlotSoftPowers with default settings, we tested for soft-thresholds for each network and used 5 on all networks, which was the most common value to avoid any imbalances; soft-thresholding affects the mean connectivity of the networks. We then constructed four topological overlap matrices (TOM) using function ConstructNetwork. The TOM is a similarity matrix based on the number of genes two genes have in common after thresholding. We drop all genes which are not common to all networks, ending up with 2420. For the plots in panels d and e, we used the functions getPCAData and getOptimalRotation from Revelio v0.1.0 to retrieve the cycle pseudotime and order the cells.
Bulk Data Network Generation
Biological networks have been built by using the transcriptomic profiling data collected by The Cancer Genome Atlas (Cancer Genome Atlas Research Network et al., 2013) and subsequently reprocessed and made available by the Recount3 project (Wilks et al., 2021) (downloaded on 02 Nov 2022). We used established gene expression pre-processing protocols: counts were logTPM transformed, and genes that have less than 1 TPM in more than 90% of the samples were removed. We also remove samples that have less than 30% tumor purity using the consensus method from (Aran et al., 2015). We end up with 1201 samples and 25687 genes for BRCA, and 574 samples and 26000 genes for LUAD.
For the luminal A (lumA) versus adjacent normal comparison, we filtered the processed data for lumA patients for which adjacent normal tissue samples exist, resulting in 60 patients. We also removed four genes with constant values for a total of 25683 genes. We used the 60 tumor samples and the 60 adjacent normal samples to compute two PANDA networks (Glass et al., 2013) with netZooPy v0.9.13 (Ben Guebila et al., 2023). PANDA requires as input both a transcription factor (TF)-to-gene motif binding prior and a TF-to-TF prior protein-protein interaction (PPI) network. Following (Lopes-Ramos et al., 2020), we generated the TF-to-gene prior network with putative motif targets using FIMO (Grant et al., 2011). First, we downloaded the Homo sapiens TF motifs with direct or inferred evidence from the Catalog of Inferred Sequence Binding Preferences (CIS-BP) Build 2.0 (http://cisbp.ccbr.utoronto.ca). FIMO then maps the position weight matrices (PWM) to the human genome (hg38) and we retained only the significant matches (threshold: p ≤ 10−5) occurring within the promoter regions of Ensembl genes (Gencode v39 (Frankish et al., 2020), downloaded from http://genome.ucsc.edu/cgi-bin/hgTables). The promoter regions include [−750; +250] base pairs upstream and downstream the transcription start site (TSS). We were then able to retrieve a network of 997 transcription factors targeting 61485 genes. For the TF PPI networks, we retrieved data from the StringDB database (version 11.5) (Szklarczyk et al., 2021), downloaded with the associated Bioconductor package. We kept only the TFs present in the motif prior, and we normalized them by dividing each score by 1000, thereby restricting the values between 0 and 1. We also transformed the PPI networks into symmetric networks with self-loops. After running PANDA on both lumA cancer and control populations, we obtained two bipartite networks of 997 TFs and 25410 genes. We then transformed each PANDA bipartite network to a gene-by-gene unipartite network that represents co-regulation with the transformation , resulting in two 25410 by 25410 networks.
For the LUAD male versus female comparison we used 238 and 277 male and female tumor samples, respectively. From gene expression, we computed two WGCNA unsigned networks (version 1.72.1) with soft-threshold 10 using the functions pickSoftThreshold and adjacency.
Over-representation and Gene Set Enrichment Analysis
For over-representation and gene set enrichment analyses, we used the GSEApy Python package (Fang et al., 2022). With function enrichr we performed over-representation analysis with a hypergeometric test that tests whether an input set of genes is significantly associated with a database of pathways. Similarly, with function prerank we performed gene set enrichment analysis with a Kolmogorov–Smirnov test to test whether a ranked list of genes is significantly associated with the database. We used the unweighted version with 1500 permutations. We used three gene pathway annotation databases, namely GOBP (Ashburner et al., 2000), KEGG (Kanehisa and Goto, 2000), and Reactome (Gillespie et al., 2021), versions v7.5.1 downloaded from the Molecular Signatures Database (MSigDB) (http://www.broadinstitute.org/gsea/msigdb/collections.jsp). We filtered pathways with less than 5 genes and with more than 1500 genes. We used an FDR cutoff of 0.1 and ranked results based on their p-adjusted values.
Differential Graph Plotting and Gene Expression Analysis
To plot the differential graphs in the TCGA BRCA and LUAD analyses, we used Cytoscape (Shannon et al., 2003). For differential expression analysis, we used the R package DESeq2 (Love et al., 2014) v1.36.0 with the original RNA-seq data (un-normalized counts) for the same genes and samples we used to build the networks. The ranking of genes is based on the adjusted p-values.
LUAD Drug Responses
To validate the predictions of n2v2r, we utilized drug response data from GDSC (Yang et al., 2012) and PRISM (Yu et al., 2016), specifically concentrating on LUAD cell lines obtained from both male and female donors. We conducted a comparison of drug response outcomes between male and female LUAD cell lines for each drug, targeting n2v2r JAK/STAT leading genes that were not differentially expressed. We performed a non-exhaustive search through the leading genes, aiming to find a small set of significant results for which we employed the Wilcoxon rank sum test. For many genes, including IL10RA, IL2RA, PIAS1, PIAS4, SOS2, we did not find entries in both databases. EP300 was significantly biased in GDSC but not in PRISM, while AKT2, JAK1, JAK2, were significantly biased in PRISM but not in GDSC. TYK2 had no drug response in GDSC but was significantly biased in PRISM. Lastly, IL5RA had no entries in GDSC, and was not significantly biased in PRISM.
Reproducibilty Statement and Data Availability
Tool versions are mentioned in their respective sections. Notebooks to recreate the biological experiment bubbleplots and subgraphs are available at https://github.com/pmandros/n2v2r; the yaml file reproduces the exact python environment we used. The scripts to generate the single-cell, bulk, and simulated networks, as well as the drug responses, are available at Zenodo 10.5281/zenodo.10558426. Also, in the same repository we uploaded the biological networks and gene expression used in the three real-world analyses.
We used seed 42 in our n2v2r python code (random.seed, numpy.random.seed, controlling the the simulated network generation and the prerank function of GSEApy. We found that the prerank function does not produce consistent GSEA plots despite the seed, and different runs can produce slightly different p-values. This can affect the order of the top pathways in bubble plots, as well as some of the bottom pathways can be exchanged with pathways that were not in the top 30 but have near identical adjusted p-values. Gene expression pre-processing and network inference for both bulk and single-cell data follow standard protocols as provided by the respective tools. The parameters were the default, except for the single-cell metacell creation where we had to ensure enough metacells for hdWGCNA. For soft-thresholding in WGCNA we used 10 as it was the middle value in the [1, 20] range used by the function pickSoftThreshold. For soft-thresholding using hdWGCNA we used 5 as it was the most common value between all networks for function TestSoftPowers.
3. Acknowledgments
The authors would like to thank Camila Lopes-Ramos for insightful discussions regarding sex differences. This work was supported by grants from the National Institutes of Health: P.M., V.F., C.C., J.F., E.S., and J.Q. were supported by R35CA220523; J.Q. was also supported by U24CA231846, P50CA127003, R01HG011393; E.S. was also supported by the American Lung Association grant LCD-821824. I.G. was supported by the Additional Funding Programme for Mathematical Sciences, delivered by EPSRC (EP/V521917/1) and the Heilbronn Institute for Mathematical Research.
Appendix
Assumptions and Proofs
In this section, we outline the necessary model assumptions then provide a sketch proof of Theorem 1 covering the main steps rather than going into the technical details. The proof follows a similar argument to the consistency proof from the original generalized random dot product graph model paper (Rubin-Delanchy et al., 2022). This proof was separately modified to allow for weighted networks (Gallagher et al., 2023) and multi-layer networks (Jones and Rubin-Delanchy, 2020), and combining these two sets of adjustments proves the consistency of unfolded adjacency spectral embedding.
Model Assumptions
We introduce three assumptions on the weighted multi-layer latent position model to enable sensible node embeddings into low-dimensional space.
Assumption 1
(Low-rank expectation). There exists maps and for such that
Assumption 1 is not a practical restriction on the multi-layer graph model as many real-world networks have low rank (Udell and Townsend, 2019). We define the output of the latent position maps from Assumption 1 by the matrices and with rows given by
One possible choice for the maps , which defines a choice for the map , is based on the mean unfolded adjacency matrix . The low-rank assumption states that the -truncated SVD is exact. Using these left and right singular vectors, we can define a canonical choice for the maps,
where divides the right singular vector into blocks corresponding to the graphs using row concatenation. Other choices for the maps are possible but these ultimately represent orthogonal transformations of the embeddings . This will get absorbed into the orthogonal transformation in Theorem 1.
Assumption 2
(Exponential tails). There exists constants such that
Assumption 2 states that the edge weights are bounded with high probability. This is necessary to prevent very large edge weights in the networks, which would otherwise ruin the structure in an embedding.
It is satisfied trivially for bounded distributions like the Bernoulli and beta distributions, and many other common distributions like the exponential distribution and the Gaussian distribution . This is a rephrasing of the condition from the weighted generalized random dot product graph model (Gallagher et al., 2023).
Assumption 3
(Singular values of ). The d non-zero singular values of mean unfolded adjacency matrix satisfy
Assumption 3 is usually written as a condition on the joint distribution of the latent positions controlling how the matrices and deviate from their corresponding second moment matrices (Rubin-Delanchy et al., 2022; Jones and Rubin-Delanchy, 2020; Gallagher et al., 2023). However, the goal of this assumption is always the same; regulating the growth of the singular values of the matrix as . In our analysis, we directly assume this condition, rather than introducing distributions for the latent positions .
Proof of Theorem 1
We now outline a sketch proof of Theorem 1 using the model assumptions given by Assumptions 1, 2 and 3.
Proof outline.
The starting point of the theorem revolves around the difference between the unfolded adjacency matrix and its unfolded mean matrix . Under Assumption 2 the spectral norm of their difference has the following asymptotic bound,
| (A1) |
This is a consequence of the matrix analog of the Bernstein inequality. Using this result the probability can be controlled using the edge weight moments upper bounds,
with high probability as . From this property, both the singular value matrices and , and the subspaces spanned by and , are approximately equal. The first is a consequence of Weyl’s inequality,
The second is derived from the Davis-Kahan theorem (Yu et al., 2015) using Assumption 3 about the size of ,
The orthogonal matrix here solves the one-mode orthogonal Procrustes problem that aligns the left and right singular vectors of the matrices and ,
where denotes the Frobenius norm. Using this orthogonal matrix , we can compare how the UASE over all graphs behaves in relation to the canonical choice defined by the maps . The proof uses the decomposition
for some residual matrix , which implies that, for all ,
| (A2) |
Using the asymptotic behaviour of from Equation A1, the first term is controlled asymptotically by the bound,
The majority of the proof is to show that the residual matrix is well-behaved starting from the spectral norm properties described above. This is a technical exercise in matrix perturbation using the existing techniques from the proofs for binary, weighted, and multi-layer graphs (Rubin-Delanchy et al., 2022; Gallagher et al., 2023; Jones and Rubin-Delanchy, 2020). Applying the same approach in this setting gives
This is the dominating term in Equation A2 meaning that
This controls the rate of convergence although the statement in Theorem 1 is only concerned that this converges to zero as .
Proof of Theorem 2
Proof. The proof uses invariance under orthogonal transformation and the triangle inequality of Euclidean and cosine distance,
Alternatively, we could have started considering the distance between the latent positions and derived the similar inequality,
Together these give the following inequality for the maximum possible error over all nodes for any distance functions invariant under orthogonal transformation,
For Euclidean distance, Theorem 1 states that the two terms on the right-hand side tend to zero with high probability as giving the first result. For cosine distance, if a sequence of points converges with respect to Euclidean distance to a non-zero limit, then the sequence also converges with respect to cosine distance. Therefore, if both , Theorem 1 states that the two terms on the right-hand side tend to zero with high probability as giving the second result.
Figure A1:
Recall violin plots for retrieving the most changing nodes between two graphs. We intervene by permuting the community probabilities of a single community to simulate changing connections but not degree, and then updating the second adjacency matrix accordingly. We generate 2000 pairs of graphs by randomly applying this intervention and adding Gaussian noise. The goal is to retrieve the nodes of the intervened community as the top most changing. The number of nodes increases along the columns, while the number of communities increases along the rows. For a random subset of 100(5%) sampled graph pairs we connect the corresponding method recall estimates. The solid and dotted lines in the violins correspond to the median and mean, respectively.
Figure A2:
Recall violin plots for retrieving the most changing nodes between two graphs. We intervene by randomly changing the community probabilities of a single community and then updating the second adjacency matrix accordingly. We generate 2000 pairs of graphs by randomly applying this intervention and adding Gaussian noise. The goal is to retrieve the nodes of the intervened community as the top most changing. The number of nodes increases along the columns, while the number of communities increases along the rows. For a random subset of 100(5%) sampled graph pairs we connect the corresponding method recall estimates. The solid and dotted lines in the violins correspond to the median and mean, respectively.
Figure A3:
Violin plots for recall in retrieving the top most different nodes between two graphs for Euclidean distance and increasing embedding dimensionality and Borda aggregation. We intervene by permuting the community probabilities of a single community to simulate changing connections but not degree, and then updating the second adjacency matrix accordingly. We generate 2000 pairs of graphs by randomly applying this intervention and adding Gaussian noise. The goal is to retrieve the nodes of the intervened community as the top most changing. For a random subset of 100(5%) sampled graph pairs we connect the corresponding method recall estimates. The solid and dotted lines in the violins correspond to the median and mean, respectively.
Figure A4:
Violin plots for recall in retrieving the top most different nodes between two graphs for Euclidean distance and increasing embedding dimensionality and Borda aggregation. We intervene by randomly changing the community probabilities of a single community and then updating the second adjacency matrix accordingly. We generate 2000 pairs of graphs by randomly applying this intervention and adding Gaussian noise. The goal is to retrieve the nodes of the intervened community as the top most changing. For a random subset of 100(5%) sampled graph pairs we connect the corresponding method recall estimates. The solid and dotted lines in the violins correspond to the median and mean, respectively.
Figure A5:
Violin plots for recall in retrieving the top most different nodes between two graphs for cosine distance and increasing embedding dimensionality and Borda aggregation. We intervene by permuting the community probabilities of a single community to simulate changing connections but not degree, and then updating the second adjacency matrix accordingly. We generate 2000 pairs of graphs by randomly applying this intervention and adding Gaussian noise. The goal is to retrieve the nodes of the intervened community as the top most changing. For a random subset of 100(5%) sampled graph pairs we connect the corresponding method recall estimates. The solid and dotted lines in the violins correspond to the median and mean, respectively.
Figure A6:
Violin plots for recall in retrieving the top most different nodes between two graphs for cosine distance and increasing embedding dimensionality and Borda aggregation. We intervene by randomly changing the community probabilities of a single community and then updating the second adjacency matrix accordingly. We generate 2000 pairs of graphs by randomly applying this intervention and adding Gaussian noise. The goal is to retrieve the nodes of the intervened community as the top most changing. For a random subset of 100(5%) sampled graph pairs we connect the corresponding method recall estimates. The solid and dotted lines in the violins correspond to the median and mean, respectively.
Figure A7:
Over-representation analysis with GOBP and hypergeometric test for the top 2% most changing genes (roughly 500) of DeDi on the BRCA TCGA cohort when comparing luminal A patients against matched adjacent normal samples using PANDA regulatory networks. We present the top 30 results ranked by adjusted p-values that pass a 0.1 FDR cutoff (equivalent to −log padj = 1). Bold indicates common top pathways with n2v2r. The size of the points indicates the overlap of the input gene list with the pathways Long pathway names have been trimmed.
Figure A8:
The subgraph corresponding to the differential PANDA network focusing on the genes of the cellular respiration GOBP pathway that are part of the input list, as returned by GSEApy (shown here with larger fonts). For every such gene, we plot their top 5 neighbors (in absolute edge weight). Red edges mean higher co-regulation in luminal A patients and blue edges in their adjacent normal samples. The size of the nodes is the absolute degree difference. Nodes are colored according to the FDR adjusted p-value from differential gene expression analysis with DESeq2: white is not significant, yellow to red is significant between 0.1 and 0.
Figure A9:
The subgraph corresponding to the differential PANDA network focusing on the genes of the oxidative phosphorylation GOBP pathway that are part of the input list, as returned by GSEApy (shown here with larger fonts). For every such gene, we plot their top 5 neighbors (in absolute edge weight). Red edges mean higher co-regulation in luminal A patients, and blue in their adjacent normal samples. The size of the nodes is the absolute degree difference. Nodes are colored according to the FDR adjusted p-value from differential gene expression analysis with DESeq2: white is not significant, yellow to red is significant between 0.1 and 0.
Figure A10:
Over-representation analysis with GOBP and hypergeometric test for the top 2% most changing genes (roughly 500) by using differential gene expression with DESeq2 on the BRCA TCGA cohort when comparing luminal A patients against matched adjacent normal samples. We present the top 30 results ranked by adjusted p-values that pass a 0.1 FDR cutoff (equivalent to −log padj = 1). The size of the points indicates the overlap of the input gene list with the pathways. Long pathway names have been trimmed.
Figure A11:
Single-cell cell cycle transitions experiment Reactome results for DeDi. The HeLa S3 cell line is integrated using Seurat, with the cells being aggregated to create metacells from which 4 networks are being generated using hdWGCNA. The 4 networks correspond to the cell cycle phases G1, S, G2, and M. The two transitions that are being analyzed are G1 to S and G2 to M. In this bubbleplot, gene set enrichment analysis with the Reactome database is performed to study the G1 to S transition, showing the top 30 pathways ranked by adjusted p-values that survive FDR 0.1 cutoff (equivalent to −log padj = 1). The x-axis represents the normalized enrichment score, and color the −log padj value. The size of the points indicates the overlap of the leading gene sets with the pathways. Bold color indicates common pathways with n2v2r. The pathways that explicitly mention terms related to the G1 to S transition are placed in green boxes. The same procedure for the G2 to M transition was performed, but there were no significant results. Long pathway names have been trimmed.
Figure A12:
Logarithm of number of unique molecular identifiers per cell sorted according to cell cycle pseudotime and colored by cell cycle phase. The black curve is a 5-th order polynomial fit.
Figure A13:
Gene set enrichment analysis with KEGG and Kolmogorov–Smirnov test for the entire DeDi ranking on the LUAD TCGA cohort when comparing male with female patient WGCNA networks. We present the top30 results ranked by adjusted p-values that pass a 0.1 FDR cutoff (equivalent to −log padj = 1). Bold indicates common top pathways with n2v2r. The x-axis represents the normalized enrichment score, and color the −log padj value. The size of the points indicates the overlap of the leading gene sets with the pathways. Long pathway names have been trimmed.
Figure A14:
Gene set enrichment analysis with KEGG and Kolmogorov–Smirnov test for the entire DESeq2 ranking on the LUAD TCGA cohort when comparing male with female patient gene expression. We present the top30 results ranked by adjusted p-values that pass a 0.1 FDR cutoff (equivalent to −log padj = 1).The x-axis represents the normalized enrichment score, and color the −log padj value. The size of the points indicates the overlap of the leading gene sets with the pathways. Long pathway names have been trimmed.
References
- Aran D., Sirota M., and Butte A. J.. 2015. Systematic pan-cancer analysis of tumour purity. Nature Communications 6, 1 (Dec. 2015), 8971. [DOI] [PMC free article] [PubMed] [Google Scholar]
- Arroyo J., Athreya A., Cape J., Chen G., Priebe C. E., and Vogelstein J. T.. 2021. Inference for Multiple Heterogeneous Networks with a Common Invariant Subspace. J Mach Learn Res 22, 141 (March 2021), 1–49. [PMC free article] [PubMed] [Google Scholar]
- Ashburner M., Ball C. A., Blake J. A., Botstein D., Butler H., Cherry J. M., Davis A. P., Dolinski K., Dwight S. S., Eppig J. T., Harris M. A., Hill D. P., Issel-Tarver L., Kasarskis A., Lewis S., Matese J. C., Richardson J. E., Ringwald M., Rubin G. M., and Sherlock G.. 2000. Gene Ontology: tool for the unification of biology. Nat Genet 25, 1 (May 2000), 25–29. [DOI] [PMC free article] [PubMed] [Google Scholar]
- Avagliano A., Ruocco M. R., Aliotta F., Belviso I., Accurso A., Masone S., Montagnani S., and Arcucci A.. 2019. Mitochondrial Flexibility of Breast Cancers: A Growth Advantage and a Therapeutic Opportunity. Cells 8, 5 (Apr 2019). [DOI] [PMC free article] [PubMed] [Google Scholar]
- Ben Guebila M., Wang T., Lopes-Ramos C. M., Fanfani V., Weighill D., Burkholz R., Schlauch D., Paulson J. N., Altenbuchinger M., Shutta K. H., Sonawane A. R., Lim J., Calderer G., van IJzendoorn D. G. P., Morgan D., Marin A., Chen C.-Y., Song Q., Saha E., DeMeo D. L., Padi M., Platig J., Kuijjer M. L., Glass K., and Quackenbush J.. 2023. The Network Zoo: a multilingual package for the inference and analysis of gene regulatory networks. Genome Biology 24, 1 (March 2023), 45. [DOI] [PMC free article] [PubMed] [Google Scholar]
- Cancer Genome Atlas Research Network, Weinstein J. N., Collisson E. A., Mills G. B., Shaw K. R., Ozenberger B. A., Ellrott K., Shmulevich I., Sander C., and Stuart J. M.. >2013. The Cancer Genome Atlas Pan-Cancer analysis project. Nat Genet 45, 10 (Oct. 2013), 1113–1120. DOI: 10.1038/ng.2764 [DOI] [PMC free article] [PubMed] [Google Scholar]
- Cappelletti V., Iorio E., Miodini P., Silvestri M., Dugo M., and Daidone M. G.. 2017. Metabolic footprints and molecular subtypes in breast cancer. Dis. Markers 2017 (Dec. 2017), 7687851. [DOI] [PMC free article] [PubMed] [Google Scholar]
- Dingwall N. and Potts C.. 2018. Mittens: an Extension of GloVe for Learning Domain-Specialized Representations. In Proceedings of the 2018 Conference of the North American Chapter of the Association for Computational Linguistics: Human Language Technologies, Volume 2 (Short Papers), Walker Marilyn, Ji Heng, and Stent Amanda (Eds.). Association for Computational Linguistics, New Orleans, Louisiana, 212–217. DOI: 10.18653/v1/N18-2034 [DOI] [Google Scholar]
- El-Botty R., Morriset L., Montaudon E., Tariq Z., Schnitzler A., Bacci M., Lorito N., Sourd L., Huguet L., Dahmani A., Painsec P., Derrien H., Vacher S., Masliah-Planchon J., Raynal V., Baulande S., Larcher T., Vincent-Salomon A., Dutertre G., Cottu P., Gentric G., Mechta-Grigoriou F., Hutton S., Driouch K., Bièche I., Morandi A., and Marangoni E.. 2023. Oxidative phosphorylation is a metabolic vulnerability of endocrine therapy and palbociclib resistant metastatic breast cancers. Nature Communications 14, 1 (14 Jul 2023), 4221. DOI: 10.1038/s41467-023-40022-5 [DOI] [PMC free article] [PubMed] [Google Scholar]
- Fan T., Pan S., Yang S., Hao B., Zhang L., Li D., and Geng Q.. 2021. Clinical Significance and Immunologic Landscape of a Five-IL(R)-Based Signature in Lung Adenocarcinoma. Front Immunol 12 (Aug. 2021), 693062. [DOI] [PMC free article] [PubMed] [Google Scholar]
- Fang Z., Liu X., and Peltz G.. 2022. GSEApy: a comprehensive package for performing gene set enrichment analysis in Python. Bioinformatics 39, 1 (11 2022), btac757. DOI: arXiv: 10.1093/bioinformatics/btac757 arXiv:https://academic.oup.com/bioinformatics/article-pdf/39/1/btac757/48448971/btac757.pdf [DOI] [PMC free article] [PubMed] [Google Scholar]
- Frankish A., Diekhans M., Jungreis I., Lagarde J., Loveland J., Mudge J. M., Sisu C., Wright J. C., Armstrong J., Barnes I., Berry A., Bignell A., Boix C., Carbonell Sala S., Cunningham F., Di Domenico T., Donaldson S., Fiddes I., García Girón C., Gonzalez J. M., Grego T., Hardy M., Hourlier T., Howe K. L., Hunt T., Izuogu O. G., Johnson R., Martin F. J., Martínez L., Mohanan S., Muir P., Navarro F. C. P., Parker A., Pei B., Pozo F., Riera F. C., Ruffier M., Schmitt B. M., Stapleton E., Suner M.-M., Sycheva I., Uszczynska-Ratajczak B., Wolf M. Y., Xu J., Yang Y., Yates A., Zerbino D., Zhang Y., Choudhary J., Gerstein M., Guigó R., Hubbard T. J. P., Kellis M., Paten B., Tress M. L., and Flicek P.. 2020. GENCODE 2021. Nucleic Acids Research 49, D1 (12 2020), D916–D923. DOI: 10.1093/nar/gkaa1087 [DOI] [PMC free article] [PubMed] [Google Scholar]
- Fuentes N., Rodriguez M. S., and Silveyra P.. 2021. Role of sex hormones in lung cancer. Experimental Biology and Medicine 246, 19 (2021), 2098–2110. DOI: 10.1177/15353702211019697 arXiv: 10.1177/15353702211019697. [DOI] [PMC free article] [PubMed] [Google Scholar]
- Gallagher I., Jones A., Bertiger A., Priebe C. E., and Rubin-Delanchy P.. 2023. Spectral embedding of weighted graphs. J. Amer. Statist. Assoc. (2023), 1–10. [Google Scholar]
- Gallagher I., Jones A., and Rubin-Delanchy P.. 2021. Spectral embedding for dynamic networks with stability guarantees. Advances in Neural Information Processing Systems 34 (2021), 10158–10170. [Google Scholar]
- Gautam Y., Afanador Y., Abebe T., López J. E., and Mersha T. B.. 2019. Genome-wide analysis revealed sex-specific gene expression in asthmatics. Hum Mol Genet 28, 15 (Aug. 2019), 2600–2614. [DOI] [PMC free article] [PubMed] [Google Scholar]
- Gillespie M., Jassal B., Stephan R., Milacic M., Rothfels K., Senff-Ribeiro A., Griss J., Sevilla C., Matthews L., Gong C., Deng C., Varusai T., Ragueneau E., Haider Y., May B., Shamovsky V., Weiser J., Brunson T., Sanati N., Beckman L., Shao X., Fabregat A., Sidiropoulos K., Murillo J., Viteri G., Cook J., Shorser S., Bader G., Demir E., Sander C., Haw R., Wu G., Stein L., Hermjakob H., and D’Eustachio P.. 2021. The reactome pathway knowledgebase 2022. Nucleic Acids Research 50, D1 (11 2021), D687–D692. DOI: 10.1093/nar/gkab1028 arXiv:https://academic.oup.com/nar/article-pdf/50/D1/D687/42058295/gkab1028.pdf [DOI] [PMC free article] [PubMed] [Google Scholar]
- Glass K., Huttenhower C., Quackenbush J., and Yuan G.-C.. 2013. Passing Messages between Biological Networks to Refine Predicted Interactions. PLOS ONE 8, 5 (05 2013), 1–14. DOI: 10.1371/journal.pone.0064832 [DOI] [PMC free article] [PubMed] [Google Scholar]
- Grant C. E., Bailey T. L., and Noble W. S.. 2011. FIMO: scanning for occurrences of a given motif. Bioinformatics 27, 7 (Apr 2011), 1017–1018. [DOI] [PMC free article] [PubMed] [Google Scholar]
- Grover A. and Leskovec J.. 2016. Node2vec: Scalable Feature Learning for Networks. In Proceedings of the 22nd ACM SIGKDD International Conference on Knowledge Discovery and Data Mining (KDD ‘16). Association for Computing Machinery, New York, NY, USA, 855–864. DOI: 10.1145/2939672.2939754 [DOI] [PMC free article] [PubMed] [Google Scholar]
- Hamilton W. L., Ying R., and Leskovec J.. 2017. Inductive Representation Learning on Large Graphs. In Proceedings of the 31st International Conference on Neural Information Processing Systems (NIPS’17). Curran Associates Inc., Red Hook, NY, USA, 1025–1035. [Google Scholar]
- Hao Y., Hao S., Andersen-Nissen E., III W. M. M., Zheng S., Butler A., Lee M. J., Wilk A. J., Darby C., Zagar M., Hoffman P., Stoeckius M., Papalexi E., Mimitou E. P., Jain J., Srivastava A., Stuart T., Fleming L. B., Yeung B., Rogers A. J., McElrath J. M., Blish C. A., Gottardo R., Smibert P., and Satija R.. 2021. Integrated analysis of multimodal single-cell data. Cell (2021). DOI: 10.1016/j.cell.2021.04.048 [DOI] [PMC free article] [PubMed] [Google Scholar]
- Hoff P. D., Raftery A. E., and Handcock M. S.. 2002. Latent Space Approaches to Social Network Analysis. J. Amer. Statist. Assoc. 97, 460 (Dec. 2002), 1090–1098. [Google Scholar]
- Hu X., Li J., Fu M., Zhao X., and Wang W.. 2021. The JAK/STAT signaling pathway: from bench to clinic. Signal Transduction and Targeted Therapy 6, 1 (Nov. 2021), 402. [DOI] [PMC free article] [PubMed] [Google Scholar]
- Jones A. and Rubin-Delanchy P.. 2020. The multilayer random dot product graph. arXiv preprint arXiv:2007.10455 (2020). [Google Scholar]
- Kanehisa M. and Goto S.. 2000. KEGG: Kyoto Encyclopedia of Genes and Genomes. Nucleic Acids Research 28, 1 (01 2000), 27–30. arXiv:https://academic.oup.com/nar/article-pdf/28/1/27/9895154/280027.pdf [DOI] [PMC free article] [PubMed] [Google Scholar]
- Kim S., Kim D. H., Jung W.-H., and Koo J. S.. 2013. Succinate dehydrogenase expression in breast cancer. Springerplus 2, 1 (July 2013), 299. [DOI] [PMC free article] [PubMed] [Google Scholar]
- Kivelä M., Arenas A., Barthelemy M., Gleeson J. P., Moreno Y., and Porter M. A.. 2014. Multilayer networks. Journal of Complex Networks 2, 3 (07 2014), 203–271. DOI: 10.1093/comnet/cnu016 arXiv:https://academic.oup.com/comnet/article-pdf/2/3/203/9130906/cnu016.pdf [DOI] [Google Scholar]
- Klein S. L. and Flanagan K. L.. 2016. Sex differences in immune responses. Nat Rev Immunol 16, 10 (Aug. 2016), 626–638. [DOI] [PubMed] [Google Scholar]
- Koc E. C., Koc F. C., Kartal F., Tirona M., and Koc H.. 2022. Role of mitochondrial translation in remodeling of energy metabolism in ER/PR(+) breast cancer. Front Oncol 12 (2022), 897207. [DOI] [PMC free article] [PubMed] [Google Scholar]
- Krumsiek J., Mittelstrass K., Do K. T., Stückler F., Ried J., Adamski J., Peters A., Illig T., Kronenberg F., Friedrich N., Nauck M., Pietzner M., Mook-Kanamori D. O., Suhre K., Gieger C., Grallert H., Theis F. J., and Kastenmüller G.. 2015. Gender-specific pathway differences in the human serum metabolome. Metabolomics 11, 6 (Dec. 2015), 1815–1833. [DOI] [PMC free article] [PubMed] [Google Scholar]
- Langfelder P. and Horvath S.. 2008. WGCNA: an R package for weighted correlation network analysis. BMC Bioinformatics 1 (2008), 559. https://bmcbioinformatics.biomedcentral.com/articles/10.1186/1471-2105-9-559 [DOI] [PMC free article] [PubMed] [Google Scholar]
- Legato M. J., Johnson P. A., and Manson J. E.. 2016. Consideration of Sex Differences in Medicine to Improve Health Care and Patient Outcomes. JAMA 316, 18 (11 2016), 1865–1866. DOI: 10.1001/jama.2016.13995 arXiv:https://jamanetwork.com/journals/jama/articlepdf/2577141/jvp160127.pdf [DOI] [PubMed] [Google Scholar]
- Levin K., Athreya A., Tang M., Lyzinski V., Park Y., and Priebe C. E.. 2019. A central limit theorem for anomnibus embedding of multiple random graphs and implications for multiscale network inference. (June 2019). arXiv:1705.09355 [stat]. [Google Scholar]
- Li L. D., Sun H. F., Liu X. X., Gao S. P., Jiang H. L., Hu X., and Jin W.. 2015. Down-Regulation of NDUFB9Promotes Breast Cancer Cell Proliferation, Metastasis by Mediating Mitochondrial Metabolism. PLoS One 10, 12 (2015), e0144441. [DOI] [PMC free article] [PubMed] [Google Scholar]
- Li X., Wei S., Deng L., Tao H., Liu M., Zhao Z., Du X., Li Y., and Hou J.. 2023. Sex-biased molecular differences in lung adenocarcinoma are ethnic and smoking specific. BMC Pulmonary Medicine 23, 1 (March 2023), 99. [DOI] [PMC free article] [PubMed] [Google Scholar]
- Lopes-Ramos C. M., Chen C.-Y., Kuijjer M. L., Paulson J. N., Sonawane A. R., Fagny M., Platig J., Glass K., Quackenbush J., and DeMeo D. L.. 2020. Sex Differences in Gene Expression and Regulatory Networks across 29 Human Tissues. Cell Rep 31, 12 (June 2020), 107795. [DOI] [PMC free article] [PubMed] [Google Scholar]
- Love M. I., Huber W., and Anders S.. 2014. Moderated estimation of fold change and dispersion for RNA-seq data with DESeq2. Genome Biology 15, 12 (Dec. 2014), 550. [DOI] [PMC free article] [PubMed] [Google Scholar]
- Lunetti P., Di Giacomo M., Vergara D., De Domenico S., Maffia M., Zara V., Capobianco L., and Ferramosca A.. 2019. Metabolic reprogramming in breast cancer results in distinct mitochondrial bioenergetics between luminal and basal subtypes. FEBS J 286, 4 (Feb. 2019), 688–709. [DOI] [PubMed] [Google Scholar]
- Modell A., Gallagher I., Cape J., and Rubin-Delanchy P.. 2022. Spectral embedding and the latent geometry of multipartite networks. (2022). arXiv:stat.ME/2202.03945 [Google Scholar]
- Morabito S., Reese F., Rahimzadeh N., Miyoshi E., and Swarup V.. 2023. hdWGCNA identifies co-expression networks in high-dimensional transcriptomics data. Cell reports Methods (2023). https://www.biorxiv.org/content/10.1101/2022.09.22.509094v1 [DOI] [PMC free article] [PubMed] [Google Scholar]
- Ortega-Lozano A. J., Gómez-Caudillo L., Briones-Herrera A., Aparicio-Trejo O. E., and Pedraza-Chaverri J..2022. Characterization of Mitochondrial Proteome and Function in Luminal A and Basal-like Breast Cancer Subtypes Reveals Alteration in Mitochondrial Dynamics and Bioenergetics Relevant to Their Diagnosis. Biomolecules 12, 3 (Feb. 2022). [DOI] [PMC free article] [PubMed] [Google Scholar]
- Özdemir B. C., Csajka C., Dotto G.-P., and Wagner A. D.. 2018. Sex Differences in Efficacy and Toxicity of Systemic Treatments: An Undervalued Issue in the Era of Precision Oncology. Journal of Clinical Oncology 36, 26 (2018), 2680–2683. DOI: 10.1200/JCO.2018.78.3290 arXiv: 10.1200/JCO.2018.78.3290. [DOI] [PubMed] [Google Scholar]
- Peel L., Larremore D. B., and Clauset A.. 2017. The ground truth about metadata and community detection in networks. Science Advances 3, 5 (May 2017), e1602548. [DOI] [PMC free article] [PubMed] [Google Scholar]
- Perozzi B., Al-Rfou R., and Skiena S.. 2014. DeepWalk: online learning of social representations. In Proceedings of the 20th ACM SIGKDD international conference on Knowledge discovery and data mining. ACM, New York New York USA, 701–710. [Google Scholar]
- Prat A., Pineda E., Adamo B., Galván P., Fernández A., Gaba L., Díez M., Viladot M., Arance A., and Munõz M.. 2015. Clinical implications of the intrinsic molecular subtypes of breast cancer. The Breast 24 (2015), S26–S35. DOI: 10.1016/j.breast.2015.07.008 [DOI] [PubMed] [Google Scholar]
- Priebe C. E., Park Y., Vogelstein J. T., Conroy J. M., Lyzinski V., Tang M., Athreya A., Cape J., and Bridgeford E.. 2019. On a two-truths phenomenon in spectral graph clustering. Proceedings of the National Academy of Sciences 116, 13 (2019), 5995–6000. [DOI] [PMC free article] [PubMed] [Google Scholar]
- Reddy K. D. and Oliver B. G. G.. 2023. Sexual dimorphism in chronic respiratory diseases. Cell & Bioscience 13, 1 (March 2023), 47. DOI: 10.1186/s13578-023-00998-5 [DOI] [PMC free article] [PubMed] [Google Scholar]
- Reel P. S., Reel S., Pearson E., Trucco E., and Jefferson E.. 2021. Using machine learning approaches for multi-omics data analysis: A review. Biotechnol Adv 49 (March 2021), 107739. [DOI] [PubMed] [Google Scholar]
- Ritchie M. E., Phipson B., Wu D., Hu Y., Law C. W., Shi W., and Smyth G. K.. 2015. limma powers differential expression analyses for RNA-sequencing and microarray studies. Nucleic Acids Research 43, 7 (01 2015), e47–e47. arXiv:https://academic.oup.com/nar/article-pdf/43/7/e47/7207289/gkv007.pdf [DOI] [PMC free article] [PubMed] [Google Scholar]
- Robinson M. D., McCarthy D. J., and Smyth G. K.. 2010. edgeR: a Bioconductor package for differential expression analysis of digital gene expression data. Bioinformatics 26, 1 (Jan. 2010), 139–140. [DOI] [PMC free article] [PubMed] [Google Scholar]
- Rubin J. B.. 2022. The spectrum of sex differences in cancer. Trends in Cancer 8, 4 (2022), 303–315. [DOI] [PMC free article] [PubMed] [Google Scholar]
- Rubin J. B., Lagas J. S., Broestl L., Sponagel J., Rockwell N., Rhee G., Rosen S. F., Chen S., Klein R. S., Imoukhuede P., and Luo J.. 2020. Sex differences in cancer mechanisms. Biology of Sex Differences 11, 1 (April 2020), 17. DOI: 10.1186/s13293-020-00291-x [DOI] [PMC free article] [PubMed] [Google Scholar]
- Rubin-Delanchy P., Cape J., Tang M., and Priebe C. E.. 2022. A Statistical Interpretation of Spectral Embedding: The Generalised Random Dot Product Graph. Journal of the Royal Statistical Society Series B: Statistical Methodology 84, 4 (Sept. 2022), 1446–1473. [Google Scholar]
- Ruiz C., Zitnik M., and Leskovec J.. 2021. Identification of disease treatment mechanisms through the multiscale interactome. Nat Commun 12, 1 (March 2021), 1796. [DOI] [PMC free article] [PubMed] [Google Scholar]
- Rutter J., Winge D. R., and Schiffman J. D.. 2010. Succinate dehydrogenase - Assembly, regulation and role in human disease. Mitochondrion 10, 4 (Jun 2010), 393–401. [DOI] [PMC free article] [PubMed] [Google Scholar]
- Saha E., Guebila M. B., Fanfani V., Fischer J., Shutta K. H., Mandros P., DeMeo D. L., Quackenbush J., and Lopes-Ramos C. M.. 2023. Gene regulatory Networks Reveal Sex Difference in Lung Adenocarcinoma. (Sept. 2023). [DOI] [PMC free article] [PubMed] [Google Scholar]
- Schulte-Sasse R., Budach S., Hnisz D., and Marsico A.. 2021. Integration of multiomics data with graph convolutional networks to identify new cancer genes and their associated molecular mechanisms. Nature Machine Intelligence 3, 6 (June 2021), 513–526. [Google Scholar]
- Schumacher T., Wolf H., Ritzert M., Lemmerich F., Bachmann J., Frantzen F., Klabunde M., Grohe M., and Strohmaier M.. 2020. The Effects of Randomness on the Stability of Node Embeddings. (May 2020). arXiv:2005.10039 [cs, stat]. [Google Scholar]
- Schwabe D., Formichetti S., Junker J. P., Falcke M., and Rajewsky N.. 2020. The transcriptome dynamics of single cells during the cell cycle. Mol Syst Biol 16, 11 (Nov. 2020), e9946. [DOI] [PMC free article] [PubMed] [Google Scholar]
- Shannon P., Markiel A., Ozier O., Baliga N. S., Wang J. T., Ramage D., Amin N., Schwikowski B., and Ideker T.. 2003. Cytoscape: a software environment for integrated models of biomolecular interaction networks. Genome Res 13, 11 (Nov. 2003), 2498–2504. [DOI] [PMC free article] [PubMed] [Google Scholar]
- Sibille A., Corhay J.-L., Louis R., Ninane V., Jerusalem G., and Duysinx B.. 2022. Eosinophils and Lung Cancer: From Bench to Bedside. International Journal of Molecular Sciences 23, 9 (2022). DOI: 10.3390/ijms23095066 [DOI] [PMC free article] [PubMed] [Google Scholar]
- Silverbush D., Cristea S., Yanovich-Arad G., Geiger T., Beerenwinkel N., and Sharan R.. 2019. Simultaneous integration of multi-omics data improves the identification of cancer driver modules. Cell Syst. 8, 5 (May 2019), 456–466.e5. [DOI] [PubMed] [Google Scholar]
- Silveyra P., Fuentes N., and Rodriguez Bauza D. E.. 2021. Sex and Gender Differences in Lung Disease. Springer International Publishing, Cham, 227–258. DOI: 10.1007/978-3-030-68748-9_14 [DOI] [PMC free article] [PubMed] [Google Scholar]
- Stroud D. A., Formosa L. E., Wijeyeratne X. W., Nguyen T. N., and Ryan M. T.. 2012. Gene knockout using transcription activator-like effector nucleases (TALENs) reveals that human NDUFA9 protein is essential for stabilizing the junction between membrane and matrix arms of complex I. J Biol Chem 288, 3 (Dec. 2012), 1685–1690. [DOI] [PMC free article] [PubMed] [Google Scholar]
- Subramanian A., Tamayo P., Mootha V. K., Mukherjee S., Ebert B. L., Gillette M. A., Paulovich A., Pomeroy S. L., Golub T. R., Lander E. S., and Mesirov J. P.. 2005. Gene set enrichment analysis: A knowledge-based approach for interpreting genome-wide expression profiles. Proceedings of the National Academy of Sciences 102, 43 (Oct. 2005), 15545–15550. [DOI] [PMC free article] [PubMed] [Google Scholar]
- Szklarczyk D., Gable A. L., Nastou K. C., Lyon D., Kirsch R., Pyysalo S., Doncheva N. T., Legeay M., Fang T., Bork P., Jensen L. J., and von Mering C.. 2021. The STRING database in 2021: customizable protein-protein networks, and functional characterization of user-uploaded gene/measurement sets. Nucleic Acids Research (Database issue) 49 (2021). [DOI] [PMC free article] [PubMed] [Google Scholar]
- Thomas S. J., Snowden J. A., Zeidler M. P., and Danson S. J.. 2015. The role of JAK/STAT signalling in the pathogenesis, prognosis and treatment of solid tumours. British Journal of Cancer 113, 3 (July 2015), 365–371. [DOI] [PMC free article] [PubMed] [Google Scholar]
- Udell M. and Townsend A.. 2019. Why are big data matrices approximately low rank? SIAM Journal on Mathematics of Data Science 1, 1 (2019), 144–160. [Google Scholar]
- Veličković P., Cucurull G., Casanova A., Romero A., Liò P., and Bengio Y.. 2017. Graph Attention Networks. In ICLR 2018. http://arxiv.org/abs/1710.10903 [Google Scholar]
- Wang C., Rao W., Guo W., Wang P., Liu J., and Guan X.. 2022. Towards Understanding the Instability ofNetwork Embedding. IEEE Transactions on Knowledge and Data Engineering 34, 2 (Feb. 2022), 927–941. [Google Scholar]
- Weighill D., Ben Guebila M., Glass K., Platig J., Yeh J. J., and Quackenbush J.. 2021. Gene targeting indisease networks. Front. Genet. 12 (April 2021), 649942. [DOI] [PMC free article] [PubMed] [Google Scholar]
- Wilks C., Zheng S. C., Chen F. Y., Charles R., Solomon B., Ling J. P., Imada E. L., Zhang D., Joseph L., Leek J. T., Jaffe A. E., Nellore A., Collado-Torres L., Hansen K. D., and Langmead B.. 2021. recount3: summaries and queries for large-scale RNA-seq expression and splicing. Genome Biology 22, 1 (Nov. 2021), 323. [DOI] [PMC free article] [PubMed] [Google Scholar]
- Yang W., Soares J., Greninger P., Edelman E. J., Lightfoot H., Forbes S., Bindal N., Beare D., Smith J. A., Thompson I. R., Ramaswamy S., Futreal P. A., Haber D. A., Stratton M. R., Benes C., McDermott U., and Garnett M. J.. 2012. Genomics of Drug Sensitivity in Cancer (GDSC): a resource for therapeutic biomarker discovery in cancer cells. Nucleic Acids Res 41, Database issue (Nov. 2012), D955–61. [DOI] [PMC free article] [PubMed] [Google Scholar]
- Yu B. and Kumbier K.. 2020. Veridical data science. Proceedings of the National Academy of Sciences 117, 8 (2020), 3920–3929. DOI: 10.1073/pnas.1901326117 arXiv:https://www.pnas.org/doi/pdf/10.1073/pnas.1901326117 [DOI] [PMC free article] [PubMed] [Google Scholar]
- Yu C., Mannan A. M., Yvone G. M., Ross K. N., Zhang Y.-L., Marton M. A., Taylor B. R., Crenshaw A.,Gould J. Z., Tamayo P., Weir B. A., Tsherniak A., Wong B., Garraway L. A., Shamji A. F., Palmer M. A., Foley M. A., Winckler W., Schreiber S. L., Kung A. L., and Golub T. R.. 2016. High-throughput identification of genotype-specific cancer vulnerabilities in mixtures of barcoded tumor cell lines. Nature Biotechnology 34, 4 (April 2016), 419–423. [DOI] [PMC free article] [PubMed] [Google Scholar]
- Yu Y., Wang T., and Samworth R. J.. 2015. A useful variant of the Davis–Kahan theorem for statisticians. Biometrika 102, 2 (2015), 315–323. [Google Scholar]


