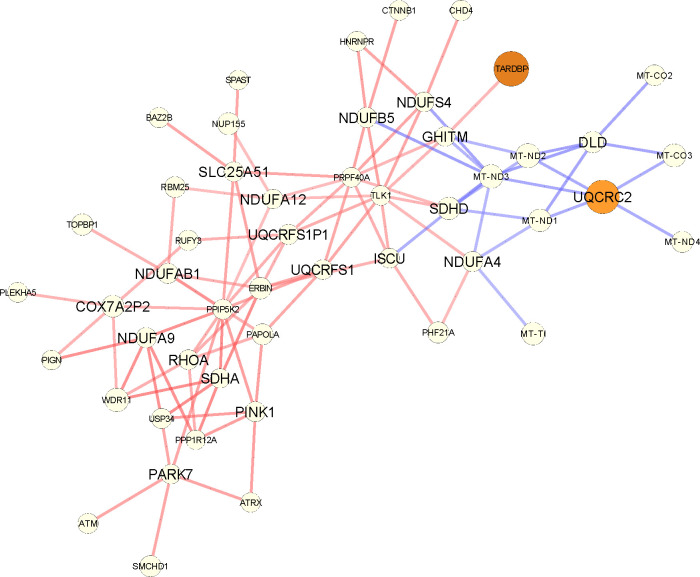
Figure A9:
The subgraph corresponding to the differential PANDA network focusing on the genes of the oxidative phosphorylation GOBP pathway that are part of the input list, as returned by GSEApy (shown here with larger fonts). For every such gene, we plot their top 5 neighbors (in absolute edge weight). Red edges mean higher co-regulation in luminal A patients, and blue in their adjacent normal samples. The size of the nodes is the absolute degree difference. Nodes are colored according to the FDR adjusted p-value from differential gene expression analysis with DESeq2: white is not significant, yellow to red is significant between 0.1 and 0.

