Figure 4:
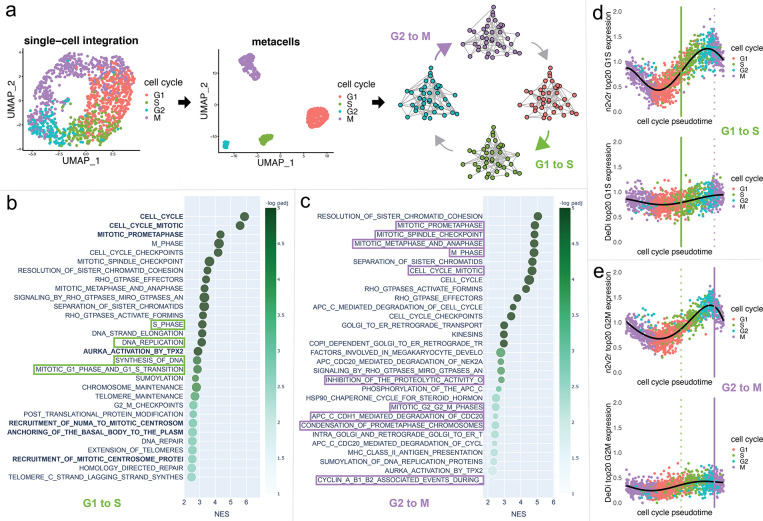
Single-cell cell cycle transitions analysis. In panel a, the HeLa S3 cell line is processed using Seurat, with the cells being aggregated to create metacells from which four networks are being generated using hdWGCNA. The four networks correspond to the cell cycle phases G1, S, G2, and M (panel a). The two transitions that are being analyzed are G1 to S (green) and G2 to M (purple). In panel b, gene set enrichment analysis with the Reactome database and Kolmogorov–Smirnov test is performed to study the G1 to S transition, showing the top 30 results ranked by adjusted p-values that pass FDR 0.1 cutoff (equivalent to −log padj = 1). For this, we used the function prerank of GSEApy. The x-axis represents the normalized enrichment score, and color the −log padj value. The size of the points indicates the overlap of the leading gene sets with the pathways. Bold color indicates common top pathways that DeDi found on the same networks. The pathways that explicitly mention terms related to the G1 to S transition are placed in green boxes. The same procedure with purple boxes for the G2 to M transition is displayed in panel c. Long pathway names have been trimmed. In panel d, we plot the average scaled and normalized expression for the top 20 genes in the ranking of the G1 to S transition according to each method (n2v2r top, DeDi bottom). The x-axis represents the cell cycle pseudotime ordering of the cells using Revelio. The vertical lines represent the 0.9 quantile of pseudotime for G1 (left, green) and G2 (right, purple, dotted) cells, acting as proxies for the time the transitions occur. The black curve is a 5-th order polynomial fit to the data. Similarly, in panel e for the G2 to M transition.

